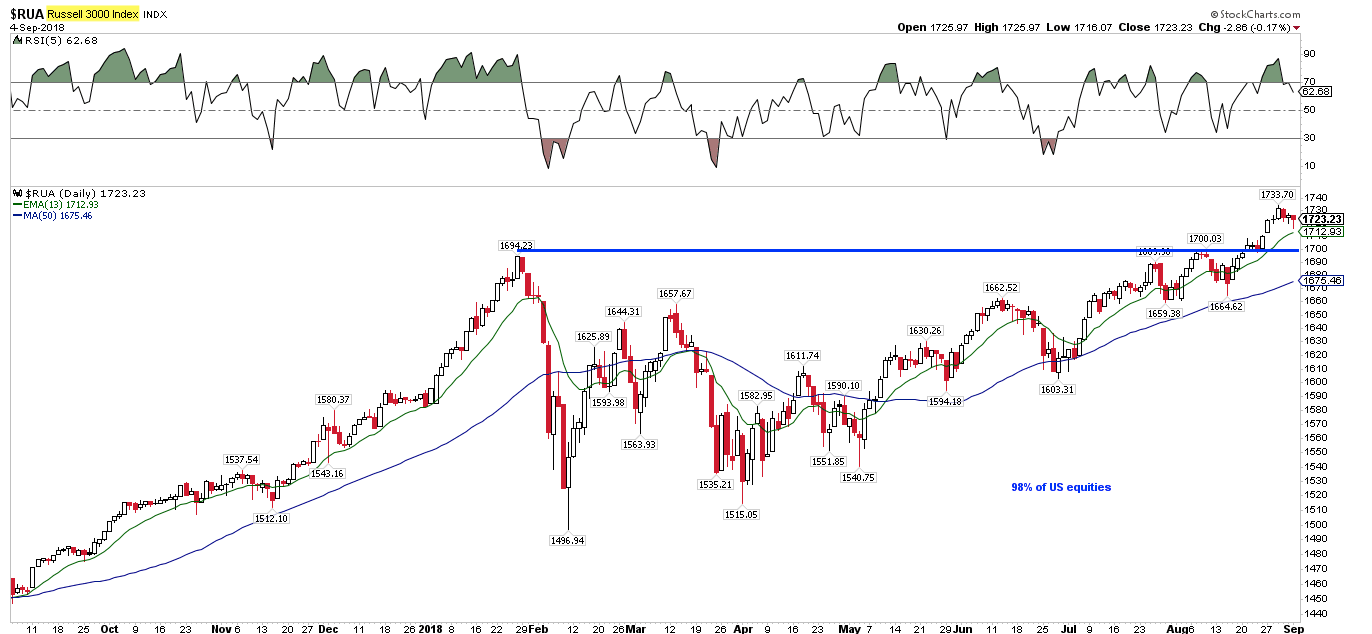
Summary: SPX, NDX, small caps as well as broad measures like the Russell 3000 - which equals 98% of total US market capitalization - made new all-time highs (ATHs) last week. Even when indices are adjusted for the dominant FAAMNG companies, the remaining 99% of stocks also at new ATHs. The trend is clearly higher, and several new momentum studies suggest that equities are likely to gain more before year-end.
If there is a reason for caution, the risk is mostly short-term (within the next month) and probably not very significant, as explained in this post.
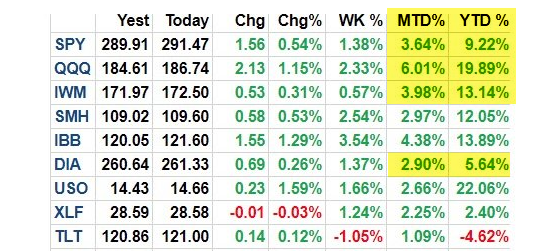
US equities rose for a 5th month in a row in August, gaining 4-6%. Through the first 8 months of the year, SPX is up 9% while the Nasdaq-100 is up 20% (table from alphatrends.net). Enlarge any chart by clicking on it.

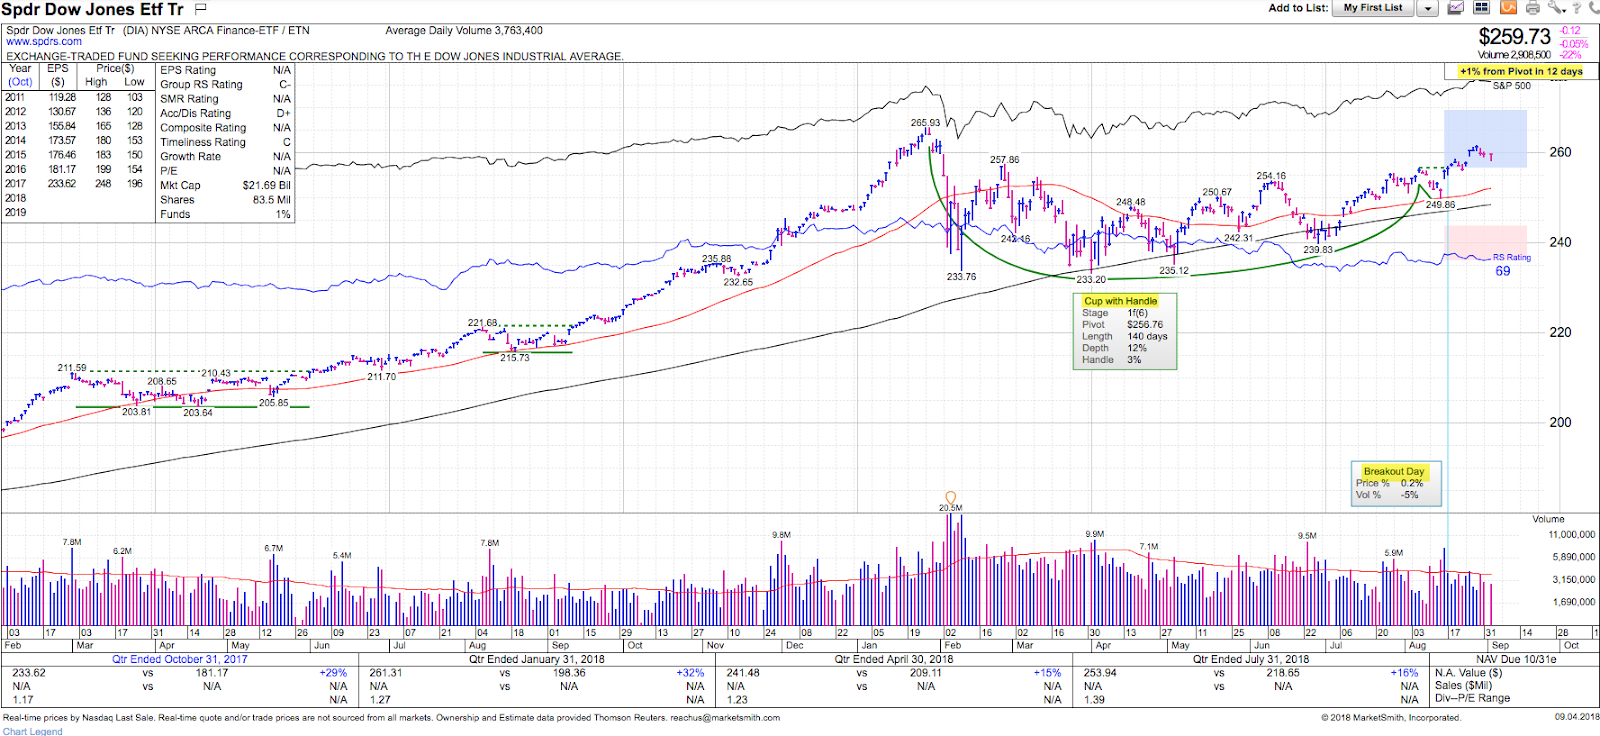
The transport sector also made a new ATH last week, providing a measure of comfort for Dow Theorists. The main laggard remains the Dow Industrials: it is still 2% from its January high but recently broke out of a bullish "cup and handle" pattern (green line) formed over the past 7 months (from IBD Investors; for a trial subscription, please use this link).
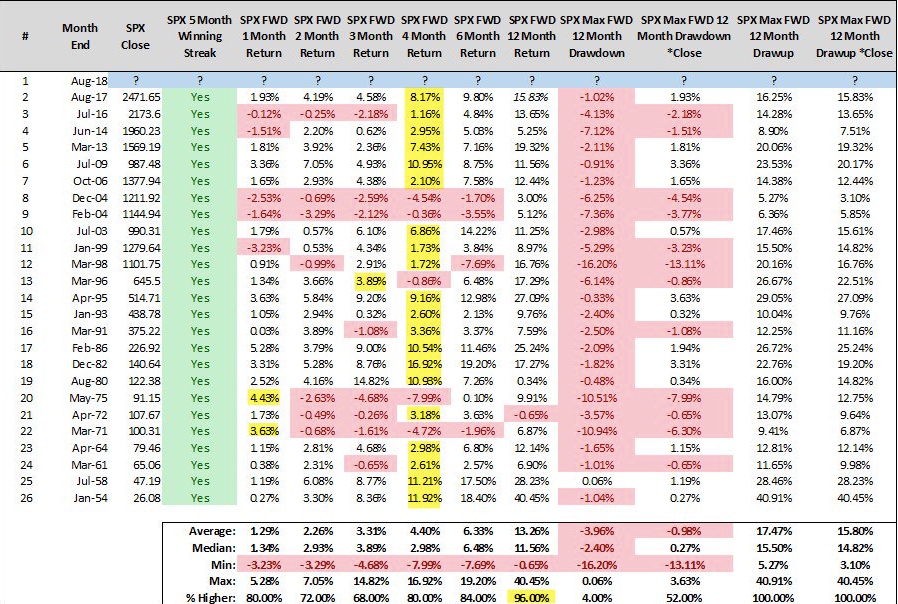
Years like 2018, where the SPX is up between 5-10% through August, have a strong propensity to continue higher to the end of the year. In the past 90 years, there have been 13 similar years: 12 of 13 (92%) closed higher at the end of one of the next 4 months and 11 of 13 (85%) added to their YTD gains through year end (from Nautilus Research).
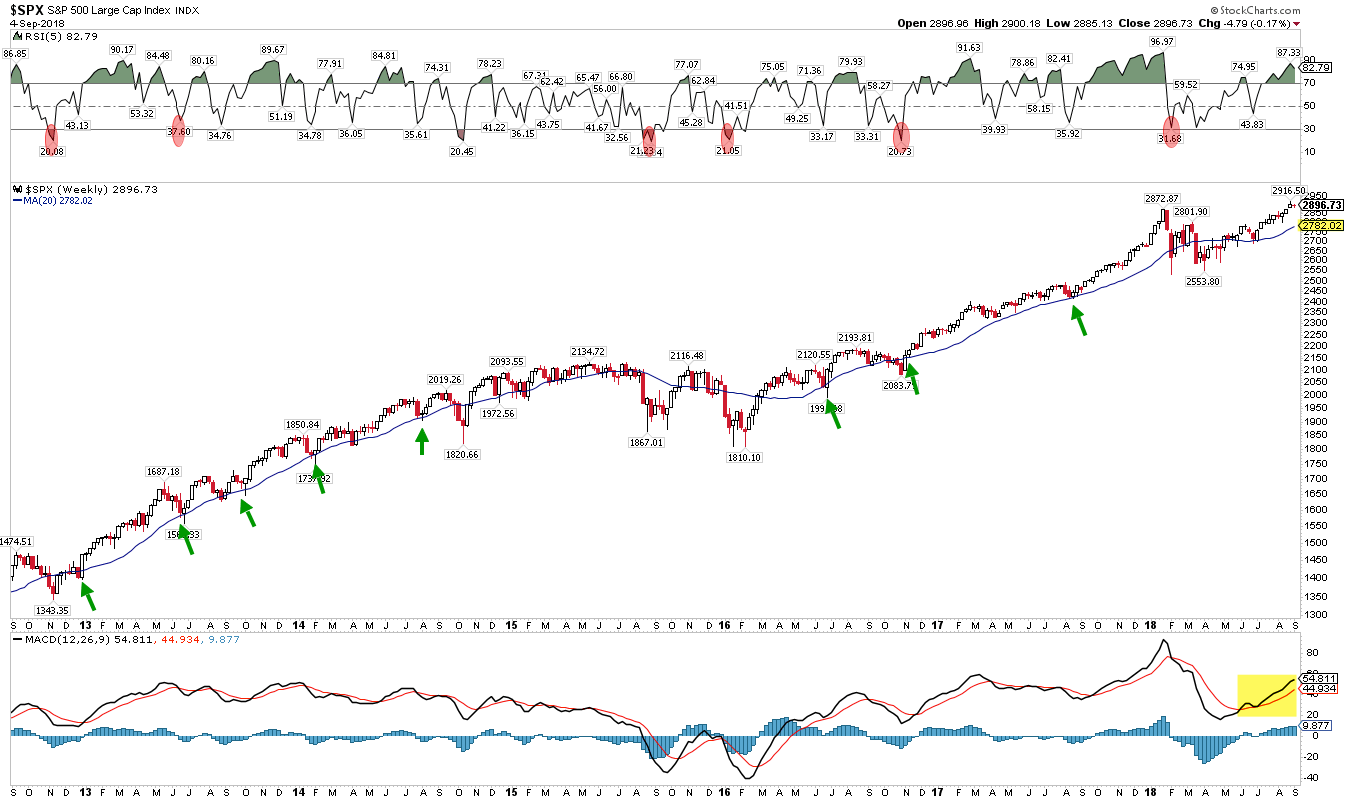
After a strong start to the year, SPX spent the next 7 months trying to regain its prior high. It finally succeeded a week ago Monday, then added to those highs Tuesday and Wednesday.
The balance of evidence points to continued strength in US equities over the coming months. That is further supported by the following:
First, the uptrend in US equities is fairly broad. In the past week, the small cap index (RUT), the Nasdaq indices (NDX and COMPQ) and the Russell 3000 (RUA), which comprises 98% of total US market capitalization, all made new ATHs.
Second, both the equal-weight SPX and NDX have made new ATHs in the past week. In other words, if you exclude the FAAMNG companies, the other 99% of SPX and 94% of NDX are also trading at a new high.
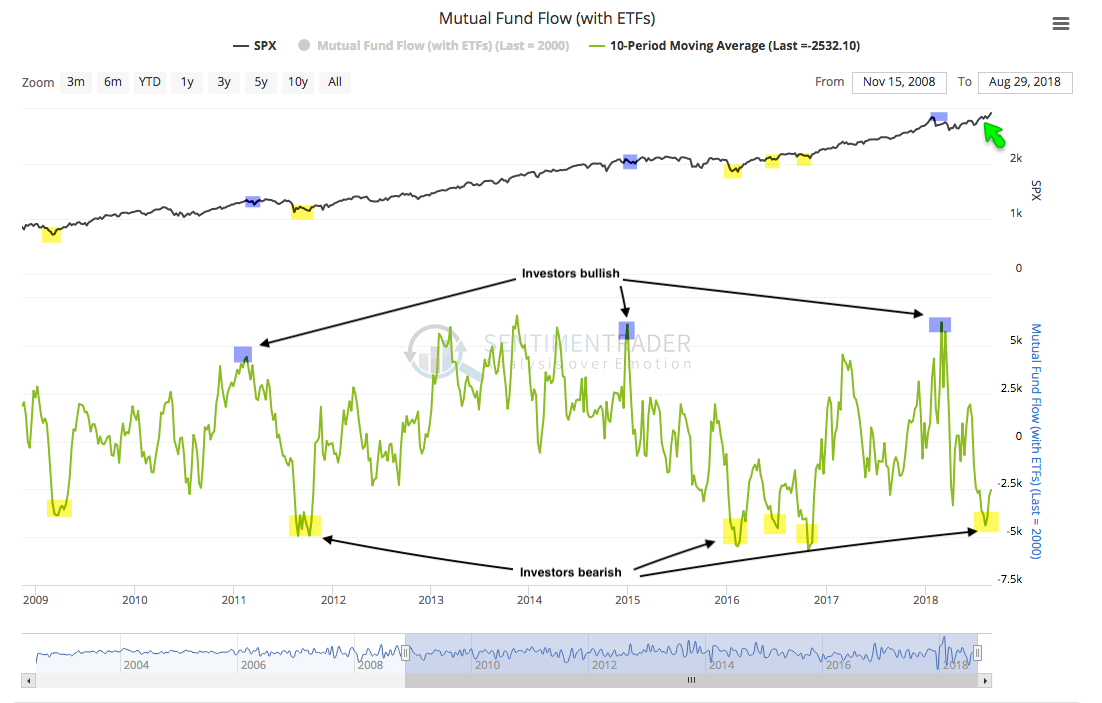
Third, for the most part, long term measures of investor sentiment are not overly bullish. Equity fund flows, for example, have been predominately negative since peaking in January. Could equities decline 3-5% in the next few weeks? Sure. Have they peaked for the year? That seems to be very unlikely (from Sentimentrader; to become a subscriber, please use this link).
Fourth, the rise in equities continues to not be driven by those companies doing the most share buybacks on a net basis (from Lisa Abramowicz of Bloomberg).
Finally, the macro economic environment supports the ongoing equity rally. In the past month:
Unemployment claims have fallen to a 49 year low. Historically, claims have started to rise at least 7 months ahead of the next recession (chart below).
Real retail sales made a new ATH, growing 3.4% yoy.
Industrial production (real manufacturing, mining and utility output) made a new ATH with annual growth of 4.2%.
New home sales through July are tracking annual growth of 5% YTD.
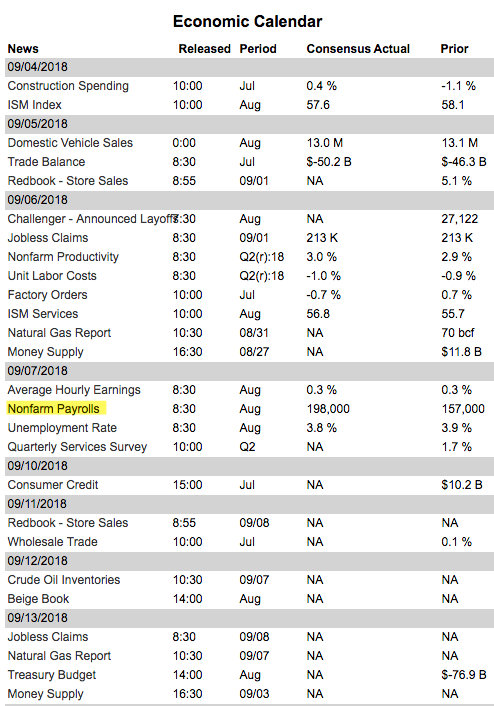
Why does any of this matter for the stock market? Equity prices typically fall ahead of the next recession, but the macro indictors highlighted above weaken even earlier and help highlight an oncoming bear market. On balance, these indicators are not hinting at an imminent recession (note blue text). Our monthly economic commentary is here.
Now, it's true that US equities are doing very well while those in Europe, Japan and in emerging markets are, at best, flat on the year. But outperformance by the US has not typically portended calamity: since 1990, this situation has occurred 10 times, with SPX higher 6 months later 80% of the time and 12 months later 100% of the time by an average of 17% (from Ned Davis Research).
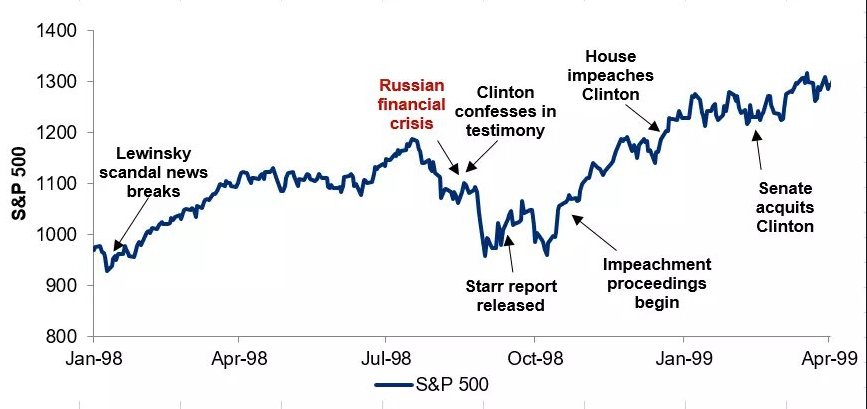
Politics are also an unlikely source of sustained market risk. The Clinton impeachment in 1998 provides an example: the SPX mostly rose throughout and ended the year more than 20% higher (from Barry Ritholtz).
The main market risk appears to be short term.
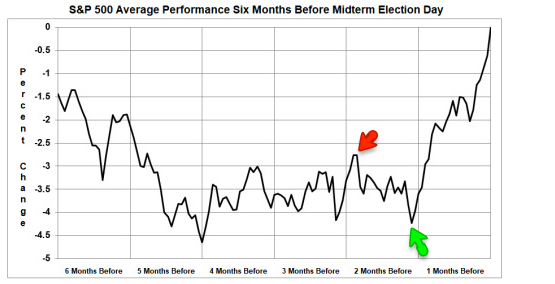
September has historically been a weak month for equities, especially in mid-term election years. Stocks typically peak early in the month and then begin to rally a month before the election (arrows; from Stock Almanac).
Now, it's true that the typical mid-term pattern has not been followed this year, and that August, which is also seasonally weak, was strong this year. But there are two reasons for caution.
First, short-term measures of investor sentiment are borderline extreme: the 10-day average equity-only put/call ratio is at a level where stocks have often traded sideways to lower over the next several weeks. There were similar readings to today's in both May and June and SPX subsequently gave up 1.5% and 3%, respectively.
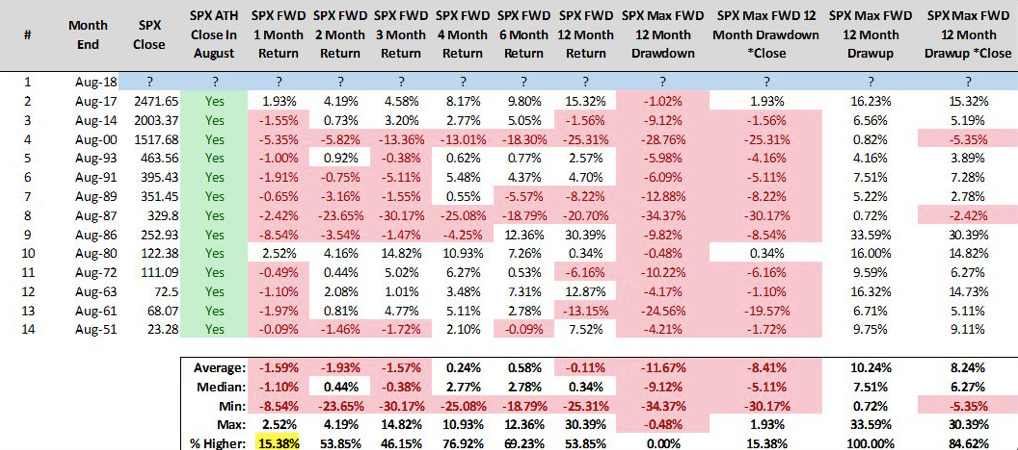
Second, new ATHs in August have had a historical tendency to precede weakness in September. There have been 13 years with a new ATH in August and SPX closed September lower in all but two (85%) by a median of 1% (from Steve Deppe).
For reference, the 2790 support level discussed earlier is less 4% lower than the August close.
IBD Investors
© F.A.S.T. Graphs
Read more commentaries by The Fat Pitch