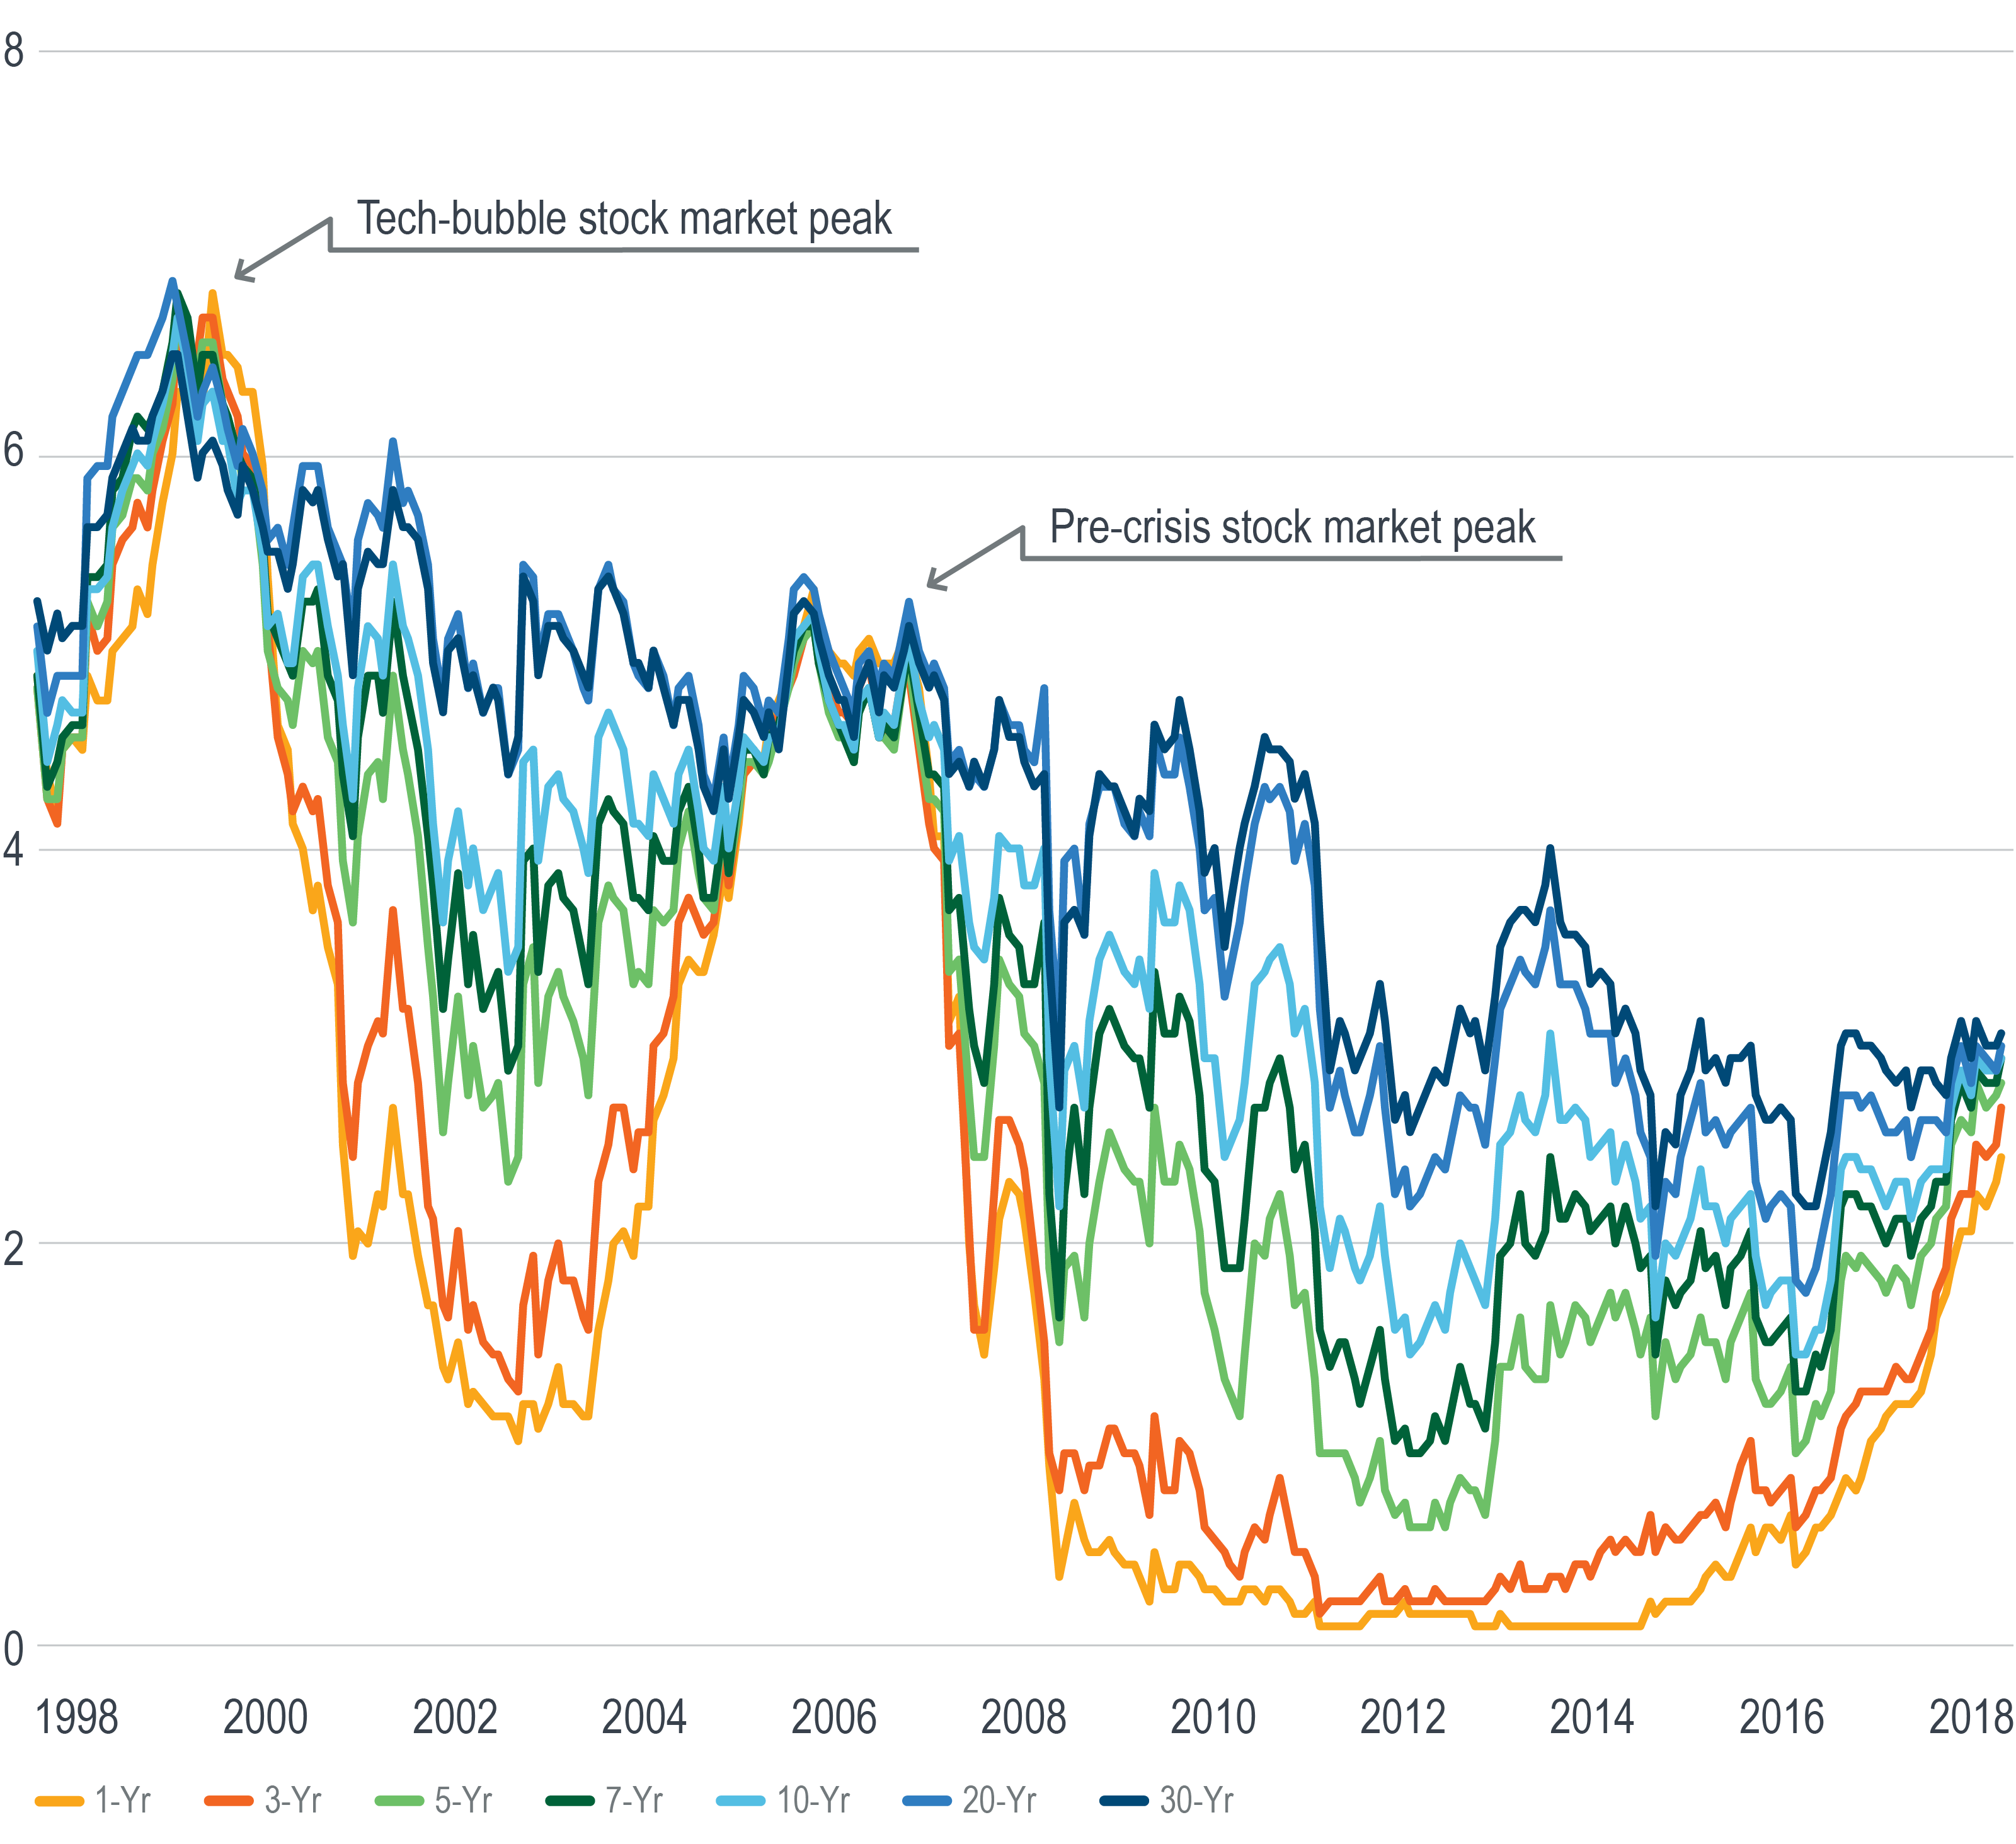
 The difference between the long and short ends of the yield curve is the smallest it’s been in more than a decade.
The last time it narrowed to this level was in 2007 just as the stock market was reaching its pre-crisis apex. Before that, it was in 2000 when the stock market hit its tech-bubble peak.
There are of course differences between then and now. The yield curve was higher then. Central bank balance sheets were a tiny fraction of what they are today. The stock market traded at a lower multiple in 2007 and a much higher one in 2000.
The world has changed in other ways too. In 2007 Netflix was just launching its movie streaming service and the “App Store” hadn’t opened yet. In 2000 the first iPhone was still seven years away and Mark Zuckerberg was just 16 years old.
In an historical “blink of an eye,” technology has profoundly changed the way we live, communicate and think. Amidst a shift so foundational, it seems unlikely that economic fundamentals would be immune.
So is the convergence of rates different this time around? Undoubtedly. How, exactly? We’ll have to wait and see.
Unless otherwise noted, data is sourced from Bloomberg.
Recipients must make their own independent decisions regarding any strategies or securities or financial instruments mentioned herein.
The products or services described or referenced herein may not be suitable or appropriate for the recipient. Many of the products and services described or referenced herein involve significant risks, and the recipient should not make any decision or enter into any transaction unless the recipient has fully understood all such risks and has independently determined that such decisions or transactions are appropriate for the recipient.
The results shown are historical, for informational purposes only, and do not guarantee future results.
Any discussion of risks contained herein with respect to any product or service should not be considered a disclosure of all risks or a complete discussion of the risks involved.
The recipient should not construe any of the material contained herein as investment, hedging, trading, legal, regulatory, tax, accounting or other advice. The recipient should not act on any information in this document without consulting its investment, hedging, trading, legal, regulatory, tax, accounting and other advisors.
The materials in this document represent the opinion of the authors and are not representative of the views of Milliman, Inc. Milliman does not certify the information, nor does it guarantee the accuracy and completeness of such information. Use of such information is voluntary and should not be relied upon unless an independent review of its accuracy and completeness has been performed. Materials may not be reproduced without the express consent of Milliman.
Data included in this document has been sourced from providers that Milliman FRM believes to be reliable from information available publicly or with consent of the provider of the source material. To the fullest extent permitted by law, no representation or warranty, express or implied is made by Milliman FRM as to the accuracy or completeness of the source data or any other information in this document.


