Weekly Market Summary
Membership required
Membership is now required to use this feature. To learn more:
View Membership BenefitsUS equities have returned to, and in some cases exceeded, their January all-time highs. The trend is clearly higher and several new momentum studies suggest that equities are likely to gain more into year-end. Recent macro and corporate results data also support the ongoing equity bull market. Despite the gains over the past 5 months, investor sentiment is not frothy.
What's new is that US equities now have a topping pattern in place: the momentum high in January has been followed a price high in August. This is how every major top in the past 40 years has started. On it's own, this doesn't suggest a major top is near. But in January, not even a topping pattern was visible in US stocks. That's no longer true.
Trade war rhetoric continues to provide sharp, interim market volatility. This week, the US and China resume trade talks for the first time in two months.
Halfway through August, US equities are on pace for a monthly gain of 2-4% (table from alphatrends.net). Enlarge any chart by clicking on it.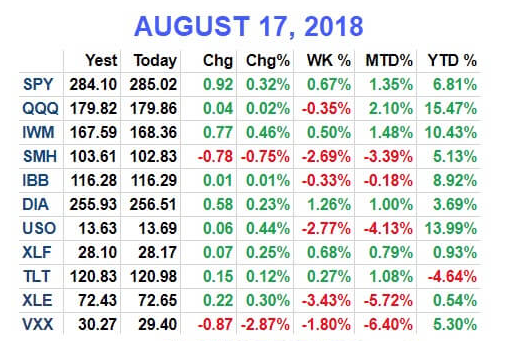
In the past month, COMPQ, NDX and RUT have each made new all-time highs (ATH). The Russell 3000, which comprises 98% of US equities, made an ATH August 7. Including dividends, the S&P 500 also made a new ATH on August 7. On a weekly closing basis, it made a new ATH on Friday. The trend for US equities is clearly higher.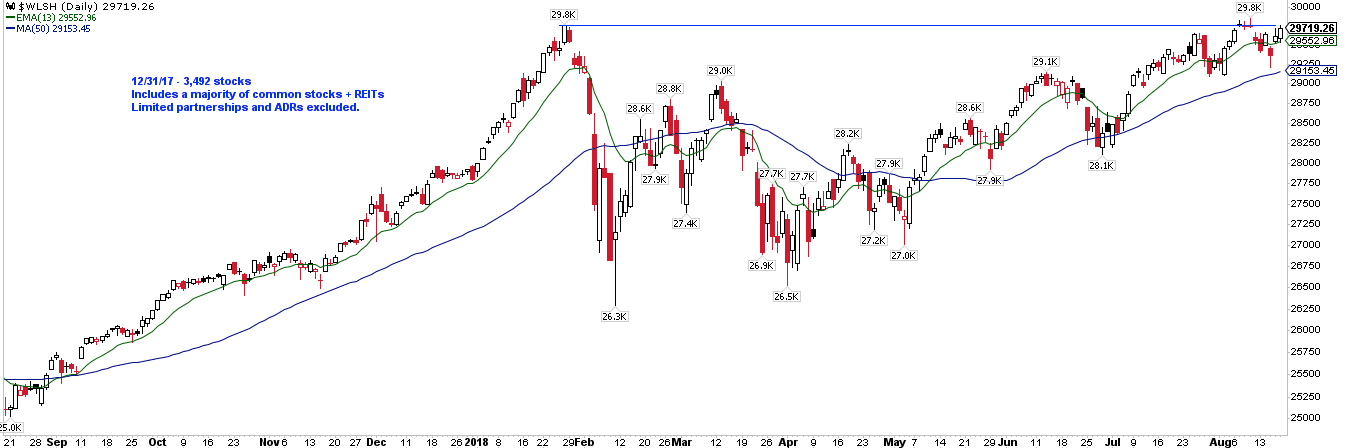
Larger cap companies in the S&P are outperforming, but that is not to say that other stocks are not also doing well. The equal-weight index ended Friday just 0.35% below its ATH. In other words, the average stock in the S&P is back to its ATH.
Since US stocks dropped more than 10% in February, our view has been twofold.
First, that uptrends weaken before they reverse, so stocks were likely to return to their highs before a larger correction (i.e., a bear market) was likely. That view was confirmed by a number of momentum studies as well as the macro data, corporate earnings and investor sentiment.
Second, that corrections have typically lasted a half year (or longer) so investor patience was needed as the correction would likely continue into the summer.
Now that both of these conditions have been satisfied, what happens next?
The bad news is this: major tops are characterized by a momentum high followed by a price high. In other words, stock indices shoot upwards, weaken and then slowly return to (and exceed) high prior highs as momentum weakens. In the same way, a ball thrown in the air decelerates into the high point of its arc before falling back down.
For the S&P, the momentum high was in January. In more than 40 years, weekly momentum had never been greater. Every major top since then has been defined by slowing momentum (top panel) price moved higher before peaking and then falling.
Now, the lead time from momentum top to price top can as short as 3 months to as long as 5 years. So, on it's own, this doesn't suggest a major top is near. But in January, not even a topping pattern was visible in US stocks. That's no longer true.
Several new momentum studies suggest US equities are very likely to continue rising this year.
First, SPX closed higher in April, May, June, and July. In the 11 times this has happened since 1935, the index closed higher 5 months later every time by median of 12% (from Ryan Detrick).
Second, SPX closed higher in 5 of the first 7 months of the year. In the 32 times this has happened since 1950, the index has closed higher 5 months later 94% of the time by a median of 6%. In the past 30 years, SPX has closed higher in all 16 instances (from Steve Deppe).
Finally, when COMPQ makes a new ATH in July (as it did this year), the index has closed higher in the next 6 months in 9 of the last 10 instances by a median 14%, and 12 months later in all 10 instances by a median 20% (from Steve Deppe).
Likewise, the macro data doesn't suggest a major top is near. Real retail sales grew 3.4% yoy in July, reaching a new ATH. Those sales are likely to plateau ahead of the next downturn; that's not happening yet. Likewise, industrial production also reached a new ATH in July, growing 4.2% yoy. Overall, the economy is doing well.
It's true that equity prices peak before the next recession but several macro indicators - employment, housing, consumption - peak before equity prices (chart from Doug Short). The weight of the evidence says the current expansion will likely last into early 2019 at a minimum. A recent post on this is here.
Corporate results also show continued growth and expanding profitability: in 2Q, sales grew 11%, earnings rose 27% and profit margins expanded to a new all-time high of 11.4%. According to BAML, pre-tax profits rose 13% yoy, indicating that expanding earnings are not just from the tax reform bill.
More importantly, fundamentals are driving the stock market higher, not valuations: earnings during the past 1 year and 2 years have risen faster than the S&P index itself. A new post on this is here.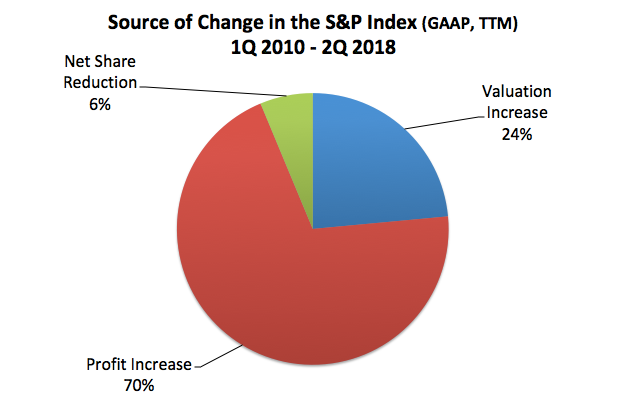
Although companies are using some of their earnings to buy their own shares, the relative amounts are not unusual and, more importantly, companies continue to invest for future growth: proportional R&D spending is at a record high and total investment is near record levels from 20 years ago (from HBR).
Both consumer and corporate balance sheets are solid. Household leverage is at the same level as 30 years ago. Debt delinquency rates are falling, to a 12-year low, unlike the rise into the prior recession (from Calculated Risk).
The leverage of companies in the S&P is at their 30-year average (yellow line). It's normal. A reminder that the S&P represents 80% of total US market cap while the Russell 2000 small cap index is just 1/10th the size of the S&P (from BAML).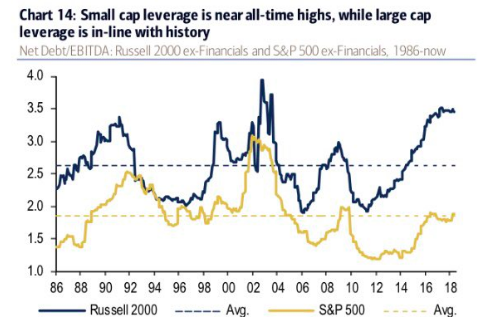
Overall, US non-financial corporate leverage is as low as it was 50 years ago (from BEA).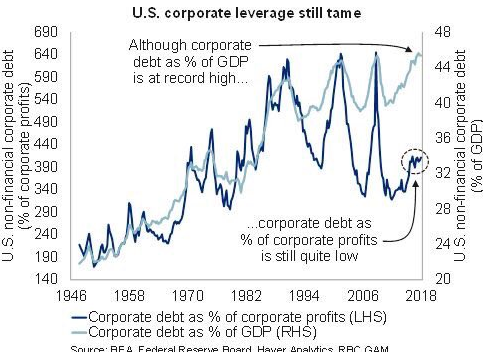
Given the strength in earnings, macro and equities, it would be unsurprising if investor sentiment was overly bullish, yet the evidence suggests it's not. Fund flows into domestic equity mutual funds and ETFs has been strongly negative in recent months. $30b has flowed out of those funds in the past 10 weeks and $100 has flowed out since the end of January and the prior peak in SPX (from ICI).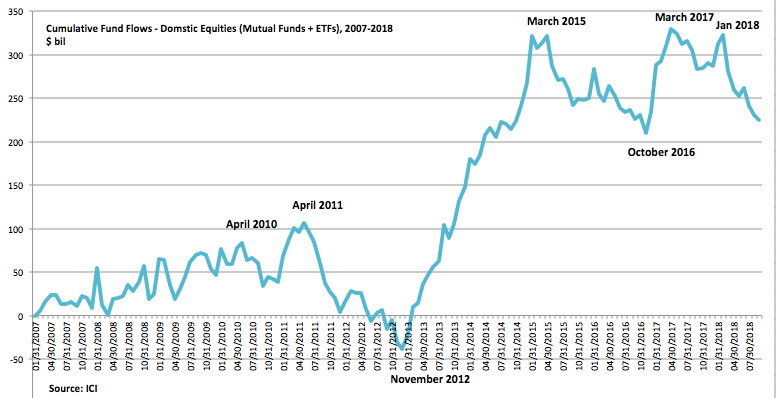
The Advisor and Investor Model (AIM) from Sentimentrader, which combines sentiment survey data from several sources, is also indicating a lack of overly bullish sentiment. The pattern is consistent with those following prior significant lows in SPX. Could SPX fall 3% in the next several weeks? Yes. Sentiment was similar in mid-June before a 3% drop. But a much bigger drop seems very unlikely on the basis of sentiment (from Sentimentrader; to become a subscriber and support the Fat Pitch, click here).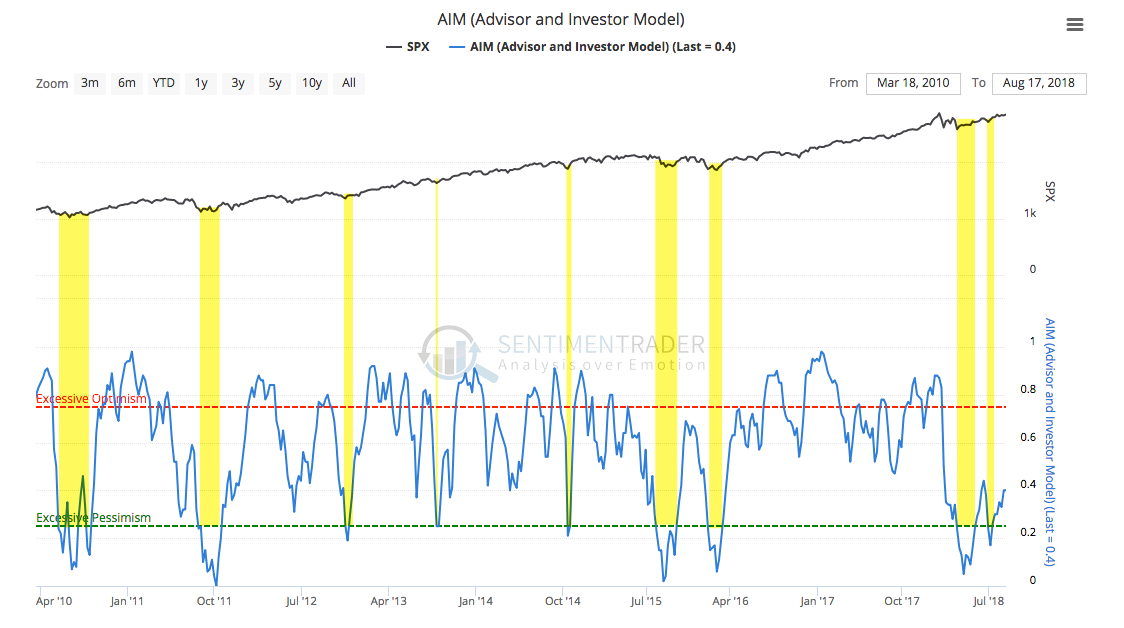
SPX broke above 2800 in mid-July, then backtested that level 4 times in the next 3 weeks and a 5th time this past Wednesday. Staying above the 2790 area (middle blue line) is thus a good line in the sand for the current uptrend. Exceeding the 2875 area (top blue line) likely signals move towards 3000 in the months ahead. Expect 2875 to be stiff resistance on at least the first attempt (2878 is WR2 this week).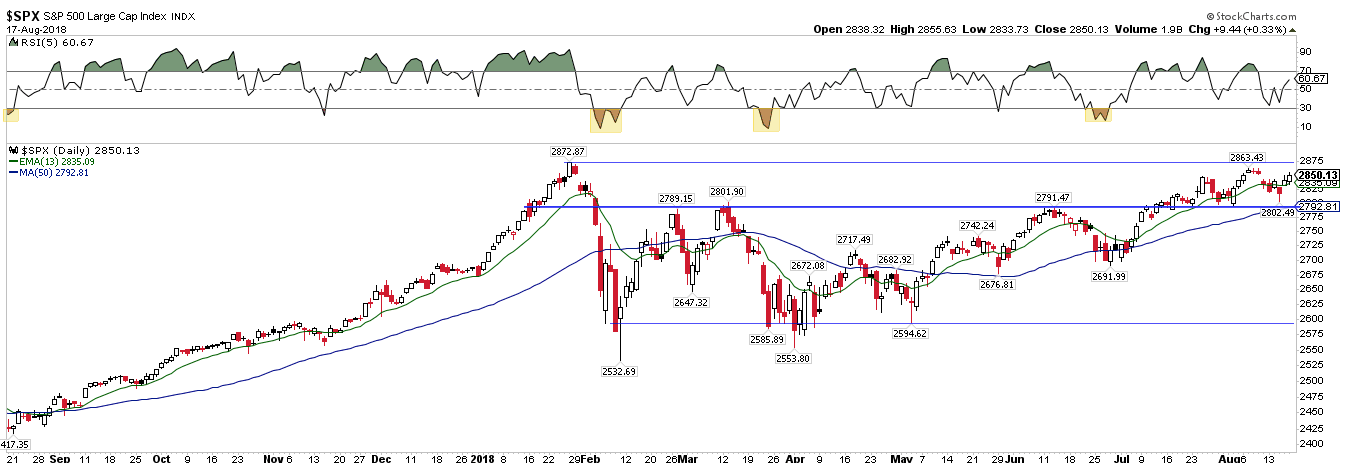
Stocks are in the seasonally weak August-September period. On average, stocks tend to rise, fall and not make much net progress during this period (yellow shading). In mid-term election years, there tends to be notably low at the start of October (green arrow), followed by a ramp into year end, something to keep in mind should stocks fall in the weeks ahead (from Stock Almanac).
Trade war rhetoric continues to be a trigger for equity weakness, as it has been all year. Conversely, a reduction in rhetoric has spurred several relief rallies. So it is notable that the US and China will hold trade talks this week (Wednesday and Thursday), the first in two months. This is a likely market moving event (from WSJ).
Copper prices started the year at a 4 year high, but trade uncertainty has knocked industrial commodity prices down over 20% in 2018. This is not a sign that US equities are in trouble.
20 years ago, copper was regarded as a useful economic tell but the reality is its track record is poor. The price of copper fell by half during the 1990s, during which time global GDP grew by 50%. Over the past 40 years, SPX has typically risen (blue arrows) while the price of copper has fallen (red arrows). A post on this is here.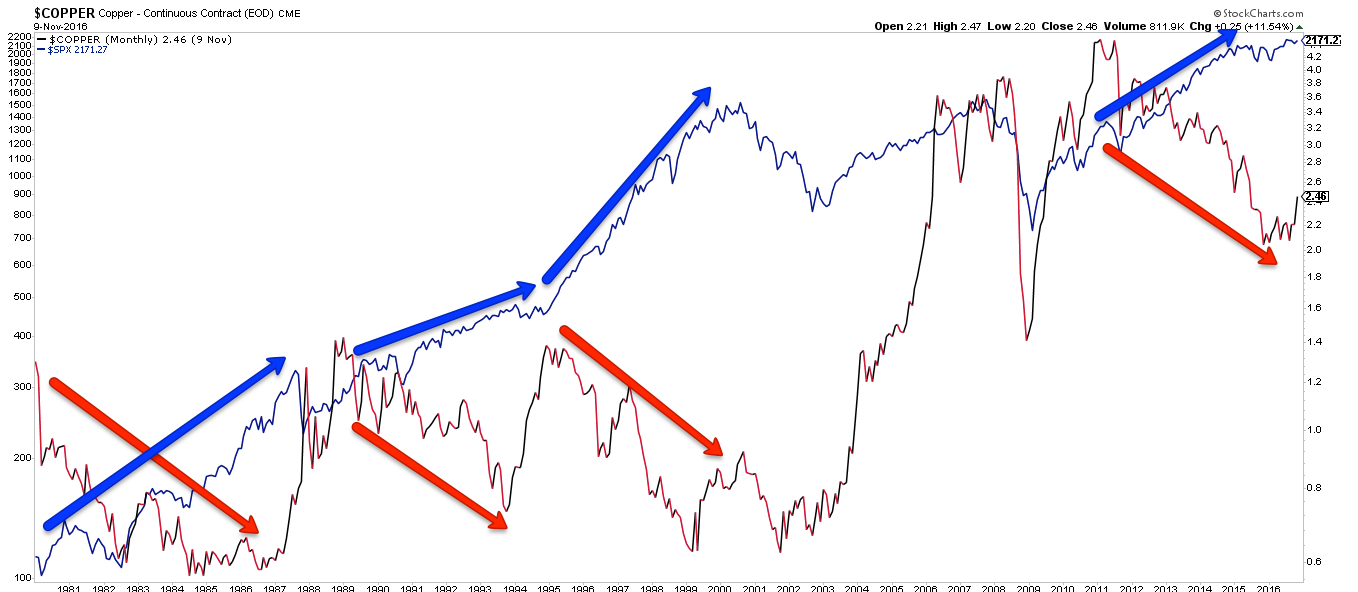
Emerging markets stocks have also been hammered in 2018 by trade rhetoric. On Wednesday, EM indices were 20% below their January peak. We wrote about the potential for EM stocks to start to outperform last month (that post is here). Since then, EEM has risen 4% and fallen 4%. The same set up still applies: this week's low appears to be a backtest of the last 7 year's trading range (yellow). So long as that low holds (blue line at ~$41), the last year qualifies as a "breakout" after a long consolidation. Below that level, the odds suggest a failure is more likely.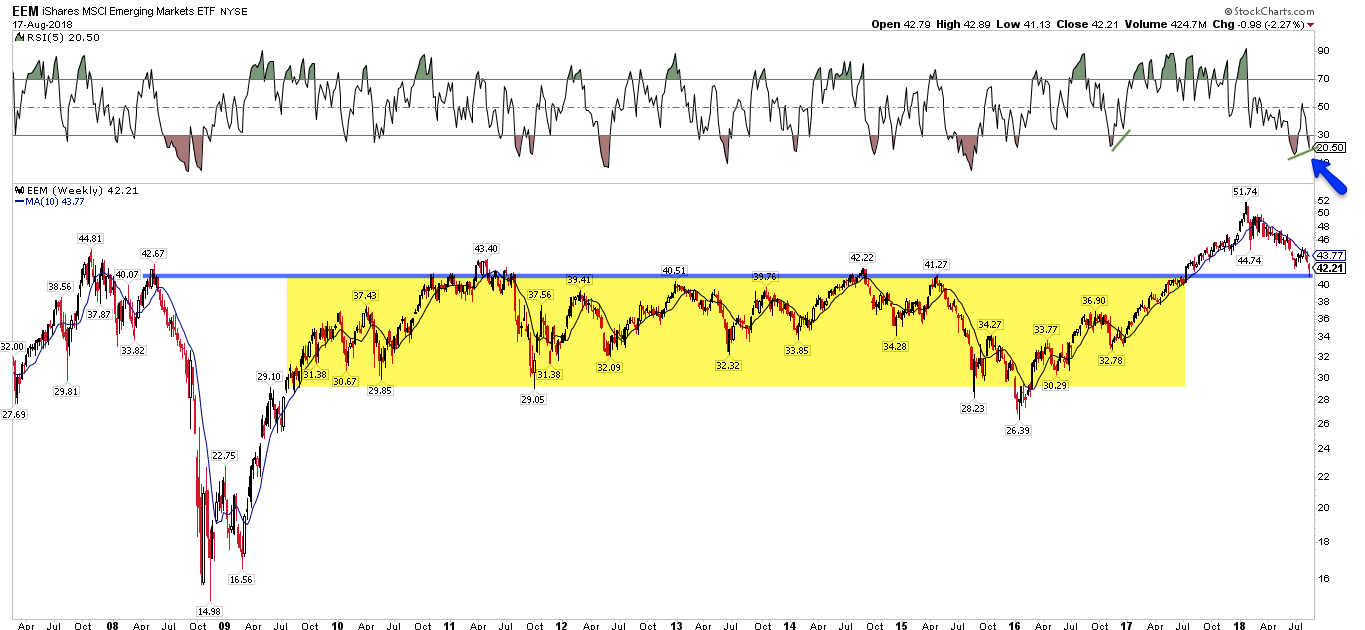
The tumult in Turkey, where the Lira has fallen 40% so far this year, has raised concerns that contagion will pummel US equities. This is unlikely. Take the Asian financial crisis as an example. In 1997, the Thai Baht and Indonesian Rupiah both devalued, the Hong Kong dollar was attacked and the crisis eventually spread to South Korea. The crisis started in July and by October, SPX was 6% higher. It was a dramatic event in Asia but not so much in the US.
The reaction in the US was similar in the aftermath of the devaluation of the Mexican peso in 1994, the Russian Ruble in 1998 and the Argentine Peso in 2001 (green line; from Mark Hulbert).
In summary, US equities have gained every month since April, and are up 1-2% so far in August. Our long term view remains that SPX will move higher by year-end.
On the calendar this week: US-China trade talks and FOMC minutes on Wednesday; new home sales on Thursday; durable goods orders on Friday (from IBD Investors).
Membership required
Membership is now required to use this feature. To learn more:
View Membership BenefitsSponsored Content
Upcoming Virtual Events View All


