Wait Until You See the Price of Gold in Venezuela Right Now

Last month in Venezuela’s capital city of Caracas, a cup of coffee would have set you back 2 million bolivars. That’s up from only 2,300 bolivars 12 months ago, meaning the price of a cup of joe has jumped nearly 87,000 percent, according to Bloomberg’s Café Con Leche Index. And you thought Starbucks was expensive.
But that was July. Prices in Venezuela are doubling roughly every 18 days. The International Monetary Fund (IMF) now projects inflation to hit an astronomical 1 million percent by the end of this year. This puts the beleaguered Latin American country on the same slippery path as Zimbabwe a decade ago and Germany in the 1920s, when a wheelbarrow full of marks was barely enough to get you a loaf of bread.
Venezuela’s socialist president Nicolas Maduro announced last week that the country plans to rein in hyperinflation by lopping off five zeroes from its currency. If you recall, Zimbabwe similarly tried to combat soaring prices of its own by issuing a cartoonish $100 trillion banknote—which in 2009 was still not enough to buy a bus ticket in the capital of Harare.
Without structural governmental reforms, a new bolivar is just as unlikely to steady Venezuela’s skyrocketing inflation or remedy its crumbling economy.
Gold Could Save Your Life
So where does this put gold? At some point, hyperinflation gets so ludicrously out of control that discussing exchange rates becomes pointless. But as of July 30, an ounce of the yellow metal would have gone for 211 million bolivars—an increase of more than 3.1 million percent from just the beginning of the year.
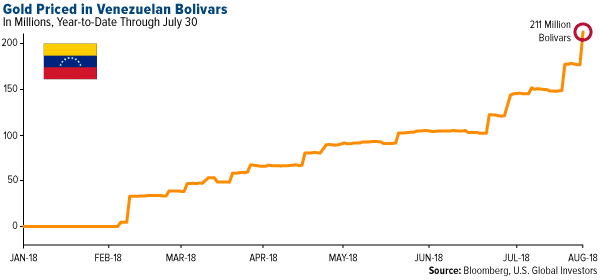
My point in bringing this up is to reinforce the importance of gold’s Fear Trade, which says that demand for the yellow metal rises when inflation threatens to destroy a nation’s currency—as it’s doing right now in Venezuela. A Venezuelan family that had the prudence to store some of its wealth in gold would be in a much better position today to survive or escape President Maduro’s corrupt, far-left regime.
In extreme cases like this, gold could literally help save lives.
Such was the case following the fall of Saigon in 1975. If not for gold, many South Vietnamese families might not have managed to escape the country. A seat on one of the thousands of fleeing boats reportedly went for eight or 10 taels of gold per adult, four or five taels per child. (A tael is slightly more than an ounce.) Gold was their passport. Thanks to the precious metal, tens of thousands of Vietnamese “boat people,” as they’re now known, were able to start new lives in the U.S., Canada, Australia and other developed countries.
Venezuela’s Once Prosperous Economy Destroyed by Corruption and Mismanagement
But back to Venezuela. Amid the corruption and mismanagement, the only thing helping the country pay its bills right now is gold. Two years ago, it had the world’s 16th largest gold reserves. Today it stands at number 26 as it’s sold off more than half its holdings since 2010. While countries such as China and Russia continue to add to their holdings, Venezuela has been the world’s largest seller of gold for the past two years.
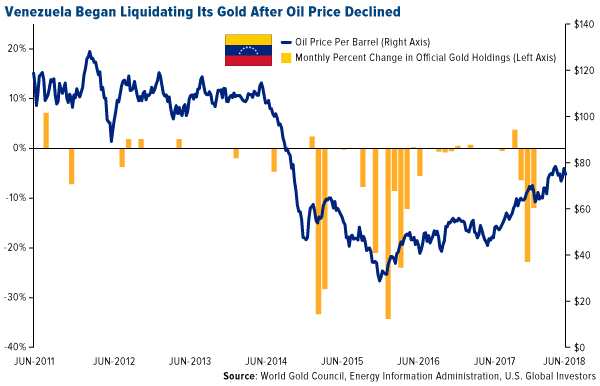
It’s hard to remember now, but as recently as 2001, Venezuela was the most prosperous country in all of South America. Like Zimbabwe, the OPEC nation is rich in natural resources, home to the world’s largest oil reserves and what’s believed to be the fourth largest gold mine. Oil exports account for virtually all of its export revenue.
In 2016, Venezuela was the third largest exporter of crude to the U.S. following Canada and Saudi Arabia, but with output in freefall, this is changing rapidly. For the first time ever in February, Colombia sold more crude oil to the U.S. than its eastern neighbor did. And in June, Venezuela’s state-owned oil and gas company, Petróleos de Venezuela (PDVSA), informed at least eight foreign clients that it would be unable to meet supply commitments. According to GlobalData, production is on track to fall to only 1 million barrels per day by 2019, down from 3 million a day in 2011, meaning the petrostate might soon have nothing left to deliver.
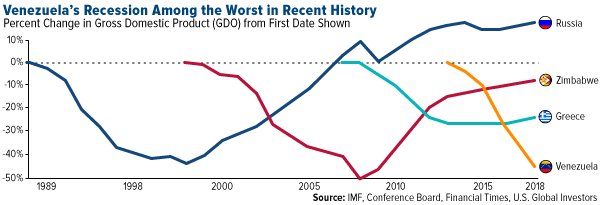
President Maduro now has the ignoble distinction of reigning over an economic recession that rivals the very worst in modern history. Last month, the IMF forecast that the country’s real gross domestic product (GDP) would fall 18 percent this year—the third straight year of double-digit declines.
A mass exodus of young, working-age Venezuelans, many of them college-educated, is unlikely to help. Estimates of the number of people who have fled the country in the past two years alone range from 1.7 million to as high as 4 million.
Their escape is no easy task, as numerous international airlines, citing rampant crime and a lack of electricity, have canceled all flights in and out of Caracas. The only U.S. carrier still operating in the country is American Airlines, which offers a single daily flight from the nation’s capital to Miami. Just two years ago, there were as many as 40 nonstop American flights, not to mention those of rival carriers, between the two cities—a sign of just how dramatic and swift Maduro’s mismanagement has been in crippling Venezuela’s once-robust economy.
The Diversification Benefits of Gold
The gold bears were on top this week, with the metal trading as low as $1,205 yesterday. That’s the closest it’s come to dipping below $1,200 since February 2017. Today’s lower-than-expected jobs report gave gold a modest boost, but it wasn’t enough to prevent a fourth straight week of price declines.
 |
click to enlarge |
In times like this, it’s important to remember that, according to gold’s DNA of volatility, it’s a non-event for the metal to close up or down 1 percent at the end of each session, 2 percent for the 10-day trading period. And guess what? The S&P 500 Index has the same level of volatility.
Ten days ago, gold was trading just under $1,230 an ounce, or 0.6 percent more than today. The math is sound.
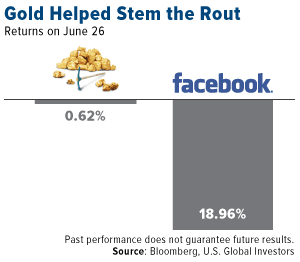
It’s also worth remembering that gold has traditionally had a low to negative correlation with other assets such as equities. This is why many investors over the years have used it as a portfolio diversifier.
Case in point: Last Thursday, Facebook suffered its worst single-day decline since the company went public in 2012. Its stock plunged 19 percent, erasing some $120 billion in market capitalization—the most ever in history for a single trading session.
Gold, meanwhile, held relatively steady, slipping only 0.62 percent.
Curious about learning more? Explore the two main drivers of gold, the Fear Trade and Love Trade, by clicking here!

Index Summary
- The major market indices finished up this week. The Dow Jones Industrial Average gained 0.05 percent. The S&P 500 Stock Index rose 0.76 percent, while the Nasdaq Composite climbed 0.96 percent. The Russell 2000 small capitalization index gained 0.60 percent this week.
- The Hang Seng Composite fell 4.51 percent this week; while Taiwan was down 0.57 percent and the KOSPI fell 0.32 percent.
- The 10-year Treasury bond yield remained essentially flat at 2.95 percent.
Domestic Equity Market
Strengths
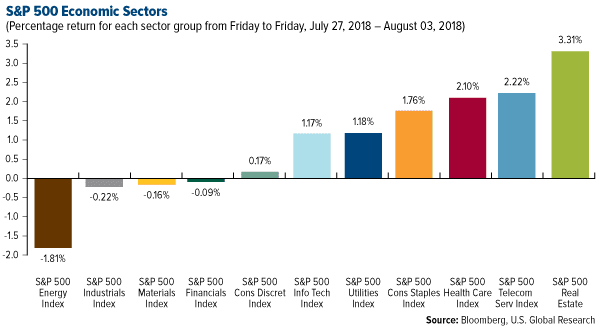
- Real Estate was the best performing sector of the week, increasing by 3.30 percent versus an overall increase of 0.72 percent for the S&P 500.
- Dish Network Corp was the best performing stock for the week, increasing by 12.74 percent.
- Apple became the first U.S. company worth $1 trillion after shares climbed 2.92 percent on Thursday, crossing the magic number of $207.05.
Weaknesses
- Energy was the worst performing sector for the week, decreasing by 1.80 percent versus an overall increase of 0.72 percent for the S&P 500.
- IPG Photonics Corp was the worst performing stock for the week, falling 27.54 percent.
- The conditions that triggered the most recent stock meltdown are still in place. A new study from Goldman Sachs says that the constrained liquidity the stock market experienced in February helped cause and worsen the sell-off. These conditions remain present and could cause further problems.
Opportunities
- Smart-speaker producer Sonos soared in its public trading debut with shares rocketing 33 percent to $19.91 during their first day of trading on the Nasdaq.
- Tesla reported a wider loss than expected for its second quarter, but expects to be profitable in the second half of the year as it ramps up Model 3 production. The electric car maker beat forecasts for revenue and its cash burn decreased compared with the first quarter.
- Google reportedly wants to launch a censored search engine in China after Sundar Pichai held secret government meetings. The project is codenamed "Dragonfly" and the new service may take the form of an Android app.
Threats
- Amazon reportedly plans to end its reliance on Oracle. Amazon, a longtime customer and competitor, plans to stop using Oracle's technology entirely by 2020, according to CNBC.
- Nintendo is just shy of reaching 20 million Switch consoles sold, but momentum is slowing. Second-year sales are down for the gaming console and Nintendo’s stock is taking a hit.
- The stock market is seeing abnormally large moves this earnings season. Goldman Sachs says single-stock moves have been more extreme this earnings season than at any other point in the past eight quarters.

The Economy and Bond Market
Strengths
- The unemployment rate fell one-tenth of a percentage point to 3.9 percent, as expected, and is around its lowest level in nearly 50 years.
- In the key wages category, average hourly earnings met expectations, increasing 2.7 percent over the same period a year ago.
- The Federal Reserve upgraded its assessment of the U.S. economy on Wednesday while keeping interest rates unchanged. In a widely expected move, the central bank's policymaking Federal Open Market Committee (FOMC) voted unanimously to keep the target range for its benchmark rate at 1.75 percent to 2 percent.
Weaknesses
- Payroll growth turned sluggish in July after two robust months, with total nonfarm payrolls increasing by 157,000. This was below the 190,000 expected by economists and the lowest gain since March.
- American manufacturers grew somewhat less rapidly in July, held back by shortages of skilled laborers and higher costs of raw materials due to tariffs. The Institute for Supply Management said its manufacturing index dipped to 58.1 percent in July from 60.2 percent in June. That is the lowest reading since April, though it is still a strong level. Economists had forecast the index to print at 59.5 percent.
- The highest interest rates in about a month and high home prices took their toll on the mortgage industry last week. The total mortgage application volume slipped 2.5 percent from the previous week and 12 percent from a year ago, according to the Mortgage Bankers Association's seasonally adjusted report. While homebuyers are less sensitive to weekly rate moves, mortgage applications to buy a home fell for the third straight week to the lowest level in a month.
Opportunities
- Next Friday, investors will be on the lookout for July’s U.S. inflation report. The current market consensus is forecasting an acceleration of July’s consumer price index (CPI) to 0.2 percent month-over-month, up from the 0.1 percent reading in June.
- U.S. producer prices will be released on Thursday, where the annual rate of producer price index (PPI) is forecast to remain at 3.4 percent in July.
- Given all the attention it has received in recent months, most everyone seems aware that the bond market’s yield curve has been flattening and is close to inverting, an event that has predicted U.S. recessions in the past. The recent firming of economic growth, however, is a reminder that the shrinking difference between short- and long-term Treasury yields by itself does not indicate economic weakness ahead. One the contrary, the economy tends to grow and stocks advance even as the curve spread retreats toward zero. In fact, a yield curve holding at the current levels would suggest a bright outlook for the economy and equities in the short-term.
Threats
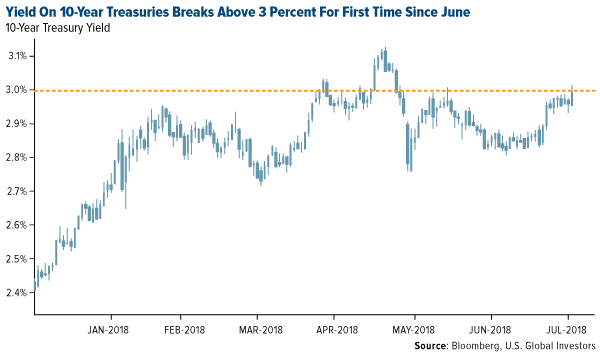
- Rising federal budget deficits are boosting the U.S. Treasury’s borrowing and could restrain a fast-growing economy as the cost of credit rises. The yield of 10-year Treasury notes climbed above 3 percent for the first time since June, as the Treasury Department announced it would increase auctions of U.S. debt by an additional $30 billion over the next three months. That included higher sales of two-year, three-year and five-year notes and the introduction of a new short-term security with a two-month maturity. In all, the Treasury plans to borrow $329 billion from July through September—up $56 billion from the agency’s April estimate—in addition to $440 billion in October through December. The figures are 63 percent higher than what the Treasury borrowed during the same six-month period last year.
- Given the rise in yields in response to the Treasury’s debt increase announcement this week, next Wednesday’s 10-year Treasury bond auction will be closely watched for an indication of bond yield pressures.
- Next Tuesday’s release of German industrial production is forecast to show a month-over-month contraction of -0.5 percent versus the prior reading of 2.6 percent growth.
Gold Market
This week spot gold closed at $1,213.30, down $9.90 per ounce or 0.81 percent. Gold stocks, as measured by the NYSE Arca Gold Miners Index, ended the week lower by 0.91 percent. Junior-tiered stocks outperformed seniors for the week, as the S&P/TSX Venture Index was lower by 0.75 percent. The U.S. Trade-Weighted Dollar Index rose 0.58 percent.
| Date | Event | Survey | Actual | Prior |
|---|---|---|---|---|
| Jul-30 | Germany CPI YoY | 2.1% | 2.0% | 2.1% |
| Jul-31 | Eurozone CPI Core YoY | 1.0% | 1.1% | 0.9% |
| Jul-31 | Conf. Board Consumer Confidence | 126.0 | 127.4 | 127.1 |
| Jul-31 | Caixin China PMI Mfg | 50.9 | 50.8 | 51.0 |
| Aug-1 | ADP Employment Change | 186k | 219k | 181k |
| Aug-1 | ISM Manufacturing | 59.4 | 58.1 | 60.2 |
| Aug-1 | FOMC Rate Decision (Upper Bound) | 2.00% | 2.00% | 2.00% |
| Aug-2 | Initial Jobless Claims | 220k | 218k | 217k |
| Aug-2 | Durable Goods Orders | -- | 0.8% | 1.0% |
| Aug-3 | Change in Nonfarm Payrolls | 193k | 157k | 248k |
| Aug-2 | Initial Jobless Claims | 220k | -- | 218k |
| Aug-2 | PPI Final Demand YoY | 3.4% | -- | 3.4% |
| Aug-3 | CPI YoY | 3.0% | -- | 2.9% |
Strengths
- The best performing metal this week was platinum, down just 0.04 percent as Impala Platinum announced it would need to slash 13,000 jobs in a restructuring move aimed at boosting income. Although gold is headed for a fourth weekly loss, the gold price rose on Friday after hitting its lowest in over a year when the U.S. Labor Department reported that total nonfarm payroll growth missed expectations. Nonfarm payrolls advanced 157,000, which was below estimates of 193,000. Gold rallied as much as $10 intraday on the news.
- Bloomberg reports that manufacturers are slowing production due to ongoing global trade spats. Reports this week showed that factory activity in the U.S, Europe and the Asia Pacific region slowed in July. Additionally, the fewest number of companies said that new orders are getting better since November 2016.
- The Perth Mint released figures for the month of July showing sales of 29,921 ounces of gold coins and bars, up from 16,847 in June. Silver sales also rose last month to 486,821 ounces, which is close to double the 229,280 ounces sold in June. The World Gold Council’s (WGC) chief market strategist, John Reade, said this week that “we may be underestimating how quickly gold mine production will decline over the next five years.” The WGC says that discoveries have been few and far between, overall operating costs are rising and political risks have grown in prospective regions. Slowing gold production could tighten supply and increase demand for the yellow metal.
Weaknesses
- The worst performing metal this week was palladium, down 1.45 percent as Norilsk Nickel reported palladium output jumped 40 percent quarter-over-quarter. Bloomberg’s weekly survey shows that gold traders and analysts were overall neutral on the yellow metal this week, which was the largest proportion of neutral positions in data going back to April 2015. Gold is heading for its fourth monthly drop and the longest streak since 2013, as investors favor the dollar, reports Bloomberg. The yellow metal’s volatility is near the lowest since January and has been trading in a narrow range for several months now. Ole Hansen, head of commodity strategy at Saxo Bank, said that “gold remains stuck in a relative tight range.”
- This week Vanguard announced that it is restructuring and changing the name of its $2.3 billion Vanguard Precious Metals and Mining Fund, reports Kitco News. The fund will be renamed the Vanguard Global Capital Cycles Fund and will reduce its exposure to mining stocks to just 25 percent from 80 percent. This move shows that negative sentiment and bearishness on gold and precious metals has hit a bottom, as Vanguard is one of the largest fund companies. Its rotation out of gold mining stocks could lead to some near-term weakness in share prices but could certainly be a buying opportunity as well. In terms of timing, Avi Gilbert, creator of Elliotwavetrader.net, noted “You don’t see these types of moves at market tops.”

- Remember that popular idiom often espoused that “there is no inflation”? Cheesecake Factory shares fell 14 percent one day this week due to second-quarter earnings results missing estimates and lowering full-year profit forecasts, reports Bloomberg. The company said that increases in minimum wage pushed labor costs up to almost 36 percent of revenue.
Opportunities
- UBS writes that gold shorts reached an all-time high this week of 20.80moz, while gold net longs declined. BMO Global Commodities Research emphasizes that investors should be wary of trend complacency when it comes to the gold market. BMO notes that the warning signs are in place for a correction, as the last time consumer confidence was this high was in 2000, just before the dotcom bubble burst. With confidence at multi-year highs and gold price volatility trading below the VIX Index, BMO adds that investors are reluctant to appreciate that China is now gearing up for a prolonged period of trade friction, and dismissing optionality around potential macroeconomic shocks.
- PIMCO writes that the outlook for gold is brightening. “Falling gold prices in the absence of rising real yields indicate that gold has cheapened relative to other U.S.-dominates flight-to-quality assets, like TIPS and Treasuries.” Too much emphasis is being placed on the dollar and many are saying that the greenback might have peaked. Bloomberg reports that Morgan Stanley, State Street Corp., and Wells Fargo are just a few of the big companies saying that the dollar is near its peak after gaining around 5 percent since mid-April. Michael Arone, chief investment strategist at State Street Global Advisors said in an interview with Bloomberg that “all of a sudden the popular trade is to be long the dollar.”
- Northern Empire Resources will be bought out by its largest holder Coeur Mining in a deal valued at around $90 million for its land package in Nevada, an 18-percent premium to the stock’s closing price on Wednesday. It’s refreshing to see some companies “get it right” now, and that all the cheap assets are going to be bought up by private equity, which was active again this week. Golden Star Resources Ltd. announced that it has entered a partnership with La Mancha Holdings, a private gold investment company. The deal could help push Golden Star to be a leading African gold producer with La Mancha investing around $125 million in cash through a private placement. La Mancha paid a 14 percent premium to the share price of Golden Star and also agreed to a two-year equity lockup.
Threats
- South African gold producers face continuing troubles and setbacks. The South African National Union of Mineworkers said this week that they are making no progress with employers regarding wage increases. Gold Fields’ South Deep Mine, which is over 3,000 meters below the ground, is not making the company any money. Although the mine could produce for 70 years and is built to target the world’s second largest known body of gold-bearing ore, the cost and technical challenges of working so far underground have hindered production. Bloomberg writes that Gold Fields has consistently missed production targets and the company has already spent around $2.3 billion on the mine. This week the African National Congress in South Africa decided to amend the constitution to allow land expropriation without compensation, which has increased concern for investors over the political implications of growing land redistribution.
- The yield of 10-year Treasury notes climbed above 3 percent for the first time since June, as the Treasury Department announced it would boost the amount of long-term debt it sells to $78 billion this quarter, up from $73 billion the previous quarter, according to Bloomberg. Some analysts say the fiscal outlook is deteriorating and political risk is looming over the dollar. Liz Capo McCormick of Bloomberg says that “U.S. Treasury Secretary Steven Mnuchin appears to be pulling off a bit of a magic trick – revving up debt issuance and not having to really pay up to do it.”
- On Friday, China announced plans to impose tariffs on an additional $60 billion worth of U.S. goods. Part of that includes a 25-percent tariff on imports of American liquefied natural gas (LNG). This is the first time fuel has been included in the growing U.S.-China trade war and could have serious implications for U.S. producers of LNG. As Russia is set to launch a new pipeline of gas into China in 2019, long-term contacts for imports of LNG from the U.S. could be less attractive to Chinese companies.

Blockchain and Digital Currencies
Strengths
- Of the cryptocurrencies tracked by CoinMarketCap, the best performing for the week ended August 3 was Speed Mining Service, which gained 172.74 percent. Square Inc. made $37 million in revenue from bitcoin sales in the first quarter of 2018. According to the company’s earnings, net quarterly revenue was $814 million, 6 percent of which came from the service adding to its Cash App late last year.
- Bitcoin mining company Bitmain Technologies reportedly brought in $1.1 billion in net profit for the first quarter of 2018, reports Fortune. The co-CEO of the world’s largest cryptocurrency mining company, recently revealed plans to conduct an initial public offering (IPO) in Hong Kong, the article continues, or “in an overseas market with U.S. dollar-denominated shares.”
- Initial coin offering (ICO) growth is on a tear despite the selloff in virtual currencies, reports Bloomberg. ICOs attracted a record $12 billion in the first half of 2018, up from $7 billion for the whole of 2017. That is more than a 50-fold jump from 2016, according to Autonomous Research LLP.
Weaknesses
- Of the cryptocurrencies tracked by CoinMarketCap, the worst performing for the week ended August 3 was WeToken, which lost 27.01 percent.
- Goldman Sachs released a note early this week predicting that the recent turnaround in bitcoin and other digital currencies will be short-lived, reports MarketWatch. “We expect further declines in the future given our view that these cryptocurrencies do not fulfill any of the three traditional roles of currency: they are neither a medium of exchange, nor a unit of measurement, nor a store of value,” wrote Sharmin Mossavar-Rahmani, CIO of Goldman’s Investment Strategy Group.
- A lot fewer people than you think are using bitcoin to buy and sell goods and services, writes Bloomberg News. After peaking at $411 million in September 2017, the amount of money that the largest 17 crypto merchant-processing services received in the best-known cryptocurrency has been on a steady decline, according to research startup Chainanalysis Inc. In fact, in May it hit a low of $60 million.
Opportunities
- On August 1, Mike Novogratz’ cryptocurrency-focused merchant bank, Galaxy Digital LP, began trading on Toronto’s TSX Venture Exchange, reports Bloomberg. Novogratz expressed his frustration with Canadian regulators that dragged out Galaxy’s listing for months, trapping his investors as bitcoin collapsed and crypto fever cooled, the article continues. However, this should be a triumphant move for the Goldman Sachs Group partner, as well as a milestone for the industry.
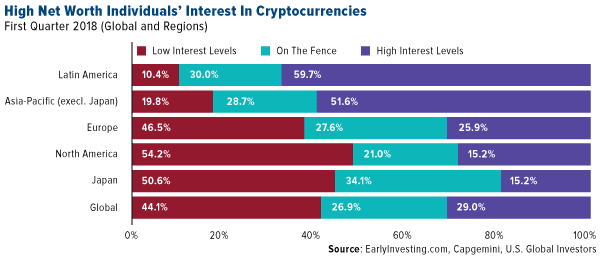
- According to a survey done by Capgemini, a French business consulting corporation, nearly 60 percent of high net worth individuals showed interest in investing in cryptocurrency in the first quarter of 2018. “Almost 80 percent of the respondents are worth $1 million to $5 million, roughly 2 percent are worth more than $20 million and the rest are worth somewhere between $5 million and $20 million,” the survey reported.
- Blockchain technology can help fight digital ad fraud, reports Campaignsandelections.com. Up to 75 cents of each marketing dollar spent on programmatic ad buying does not reach the publisher, according to advertising software provider MediaOcean. With a secure digital ledger to track inventory from the publisher as it makes its way through the “labyrinth of middlemen” however, a marketer has more transparency into how much they really get for their budget. Blockchain can do just that.
Threats
- “Corporate America’s love affair with all things blockchain may be cooling,” writes Bloomberg. According to Forrester Research Inc., a number of software projects based on blockchain technology will be wound down this year, while some companies pushing ahead with pilot tests are scaling back their ambitions and timelines. One analyst points out that such a pullback could hurt companies like IBM and Microsoft.
- Following the SEC’s decision to deny the Winklevoss twins their application for a digital asset-related ETF, bitcoin pundits are wondering what is holding things back. According to a MarketWatch article this week, some of the main issues that have recently given regulators pause include 1) security, 2) lack of liquidity, vulnerability to manipulation, and 3) valuation.
- Cryptocurrencies saw a second day of losses mid-week, with bitcoin now well below the psychological price point and a majority of other crypto assets in red, reports Coin360.com. Bitcoin fell below $7,500 Wednesday, having lost almost 3 percent on the day. Just last week the popular coin reached $8,431 on July 25.
Energy and Natural Resources Market
Strengths
- Iron ore was the best performing major commodity this week rising 6.49 percent. The commodity rallied after China port inventories declined.
- The best performing sector this week was the S&P 1500 Fertilizers and Agricultural Chemicals Index. The index rose 3.28 percent after a number of its constituents reported greater than expected demand for fertilizers, as well as higher realized prices.
- The best performing stock for the week was Resolute Forest Products Inc. The Canadian pulp and paper producer rose 19.51 percent. Resolute, which is North America's largest newsprint producer, hopes rare bipartisan political support in the United States will convince the U.S. International Trade Commission to overturn final import duties announced Thursday.
Weaknesses
- Lumber was the worst performing commodity this week. The commodity dropped 7.94 percent to a seven-month low as the trade spat between Canada and the U.S. drags on. Sentiment was further dampened as Bloomberg reported property prices are starting to head lower globally, citing an International Monetary Fund report.
- The worst performing sector this week was the S&P 1500 Steel Index. The index dropped 5.37 percent after market specialists suggested cheap foreign steel may become too tempting for American buyers. The U.S. steel price benchmark is up about 40 percent this year as producers raise prices to meet increased demand, increasing the likelihood that U.S. producers may face foreign competition even after taking import tariffs into account.
- The worst performing stock for the week was Ferrexpo PLC. The iron ore producer dropped 17.41 percent despite reporting record price premiums and strong revenue generation, after bad news prevailed with rising commodity prices driving up input costs.
Opportunities
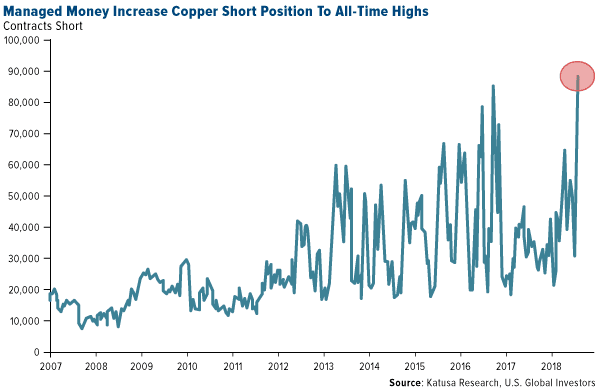
- Clear skies may lie ahead for copper as short positions have reached new all-time highs, as estimated by analysts at Katusa Research. Copper author and expert speaker Gianni Kovacevic chimed in to remind investors that last time such extreme short positioning occurred in copper, this resulted in a sharp 20-percent rally in the metal.
- Renewable energy is getting a strong push from global corporations. Businesses and public agencies are buying more clean energy than ever before, reports Bloomberg. Companies and agencies, excluding utilities, agreed to buy 7.2 gigawatts of clean energy worldwide so far this year, already shattering the record of 5.4 gigawatts for all of 2017.
- Steel futures climbed to the strongest in more than five years as China plans harsher capacity cuts this winter to reduce air pollution, adding momentum to a raft of recent measures to ensure cleaner skies, Bloomberg reports. Prices have soared more than 25 percent since March as the country toughened restrictions on industrial plants to protect the environment and continued to cut idle and excess capacity
Threats
- U.S. sanctions on Iran may not reduce the Asian nation’s supply to the global market. China’s largest refiner, Sinopec, will hold off on buying U.S. crude as an escalating trade war between Beijing and Washington threatens to make American imports more expensive. The U.S. has been unable to persuade China to cut Iranian oil imports – China is the world’s top crude buyer and Iran’s number one customer – having said previously that it opposed unilateral sanctions and increased monthly oil imports from the country by 26 percent in July.
- Senior U.S. administration officials announced that the president asked U.S. trade representative Robert Lighthizer to consider increasing the proposed tariffs on imports to 25 percent from the 10 percent announced last month.
- The bullion market has suffered its worst start to a year in almost a decade as U.S. investors pulled money out of gold-backed exchange traded funds. Gold demand totaled 1,959 tons in the first half, the lowest level since 2009, according to a report published by the World Gold Council on Thursday. Gold has been out of favor in the U.S. as the Federal Reserve lifted interest rates twice this year and signaled further hikes are on the way, FT notes.
China Region
Strengths
- The Philippines was the best performing country in the region this week, gaining 1.53 percent. Moody’s Investors Service reports that robust economic growth in the region is expected to sustain over the next few years, as the government focuses on infrastructure development (reinforcing the decade-long trend of increasing potential growth). Strong domestic demand and the economy’s limited reliance on foreign sources of financing shield the Philippines from the direct impact of abrupt global changes.
- The Thai baht was the best performing currency in the region this week, up 42 basis points.
- All sectors in the Hang Seng Composite were down this week as investors become risk averse with the escalation of trade tensions. Telecommunications was the best relative performing sector this week, down only 79 basis points.
Weaknesses
- China was the worst performing country in the region this week, losing 4.63 percent. Chinese equities have been battered by concerns about the U.S. trade rift, a slowing Chinese economy, weaker yuan and Beijing’s deleveraging efforts.
- The South Korean won was the worst performing currency in the region this week, down 71 basis points.
- Consumer services was the worst performing sector this week, down 7.54 percent.
Opportunities
- Chinese investors flocked into money-market products at a rate outpacing equities and bonds last quarter, adding to what is already the biggest segment of the nation’s mutual fund industry. After a shadow banking crackdown shrank the pool of investment products in China, money market funds are seen as a safer investment as trade war uncertainties weigh on stocks, while offering returns close to those of bonds. While Chinese equities have rebounded from their lows and corporate notes jumped last month amid a government shift toward easing, analysts say money-market funds will continue to be attractive to retail investors.
- Beijing is easing, with the Shanghai Interbank Offered Rate (SHIBOR) down 179 basis points over the past seven months. According to Corner Stone Macro research, Chinese government spending growth has already reaccelerated from 0 percent to 8 percent, and statements over the past few weeks suggest more is in the pipeline. It is clear that tariff concerns are moving Beijing to put in place polices to support/boost growth, already clearly on the monetary side, but these will also now take place on the fiscal front. China's Politburo said the deleveraging campaign will continue at a measured pace and will improve economic policies to be more forward-looking, flexible and effective in the second half of 2018. These comments followed a meeting led by Xi Jinping stressing infrastructure construction to repair weak links in the economy.
- In a research note, the Fitch Group unit said the Philippines remain one of the strongest consumer growth markets in Asia supported by strong economic growth trajectory, high levels of remittance inflows and falling unemployment. Moody’s also supports this positive view of the region.
Threats
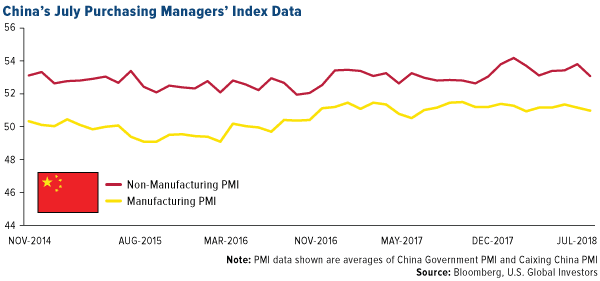
- China’s Caixin manufacturing PMI fell to 50.8 from 51.0 in July, an eight-month low, with new export orders in contraction for a fourth-straight month. Manufacturing PMI data was weak across the board in Asia (Taiwan 53.1 versus 54.5, India 52.3 versus 51.1, ASEAN 50.4 versus 51) with a weak export component indicating a relationship to loss in confidence due to increased trade uncertainties. Both the Caixin service and composite PMIs softened in July, mirroring the official data. Early indicators for the region suggest trade tensions are starting to bite. A weighted average of PMI export orders data for China, Japan, South Korea, Taiwan and Singapore has been trending down since the start of the year. In July, it edged into contractionary territory.
- According to EvercoreISI, uncertainty is a real negative in this trade war, while unpredictability is a negative in the global economy. Companies which are constantly trying to optimize their global supply chains have no idea what to do on – producing, hiring, investing, sourcing, pricing and planning. Restrictions on investment flows are serious and longer lasting than tariffs, since they eliminate near-permanent jobs and incomes. Tariffs come and go; they get implemented, do their damage, this is recognized, and then they get wiped away when the parties involved are ready to retreat.
- Thailand’s tourism authority expects second half tourist arrivals from China to fall after a deadly boat accident. Chinese travelers are expected to provide close to a third of estimated 2.09 trillion baht ($62.7 billion) of revenue from foreign holidaymakers this year. Tourism is a key economic engine for Thailand, accounting for around one-fifth of gross domestic product.
Emerging Europe
Strengths
- Hungary was the best performing country this week, gaining 2.27 percent. MOL Hungarian Oil and Gas contributed the most after the stock was upgraded to buy at Renaissance Capital.
- The Hungarian forint was the best performing currency this week, gaining 5 basis points against the U.S. dollar.
- Health care was the best performing sector among eastern European markets this week.
Weaknesses
- The Czech Republic was the worst performing country this week, losing 8 basis points. The central bank cut the economic growth estimate for this year to 3.2 percent from 3.9 percent, while also raising the average inflation projection to 2.1 percent, above the 2 percent target. Officials raised the benchmark rate by 25 basis points to 1.25 percent, as economists forecast, after increasing borrowing costs at their previous meeting in June.
- The Turkish lira was the worst performing currency this week, losing 4.41 percent against the U.S. dollar. Turkey’s currency, bonds and stocks extended their slide after the U.S. imposed sanctions on two government ministers over the detention of an evangelical pastor.
- Information technology was the worst performing sector among eastern European markets this week.
Opportunities
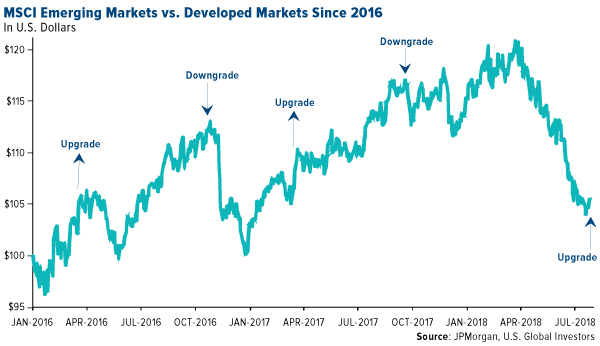
- JPMorgan recommended an overweight of emerging markets in 2016 and 2017, and downgraded the region in the fourth quarter of last year. After weak year-to-date performance, this week JPMorgan upgraded emerging markets. It views now as a good entry point relative to developed markets for a few reasons. First, the Federal Reserve rate hikes are largely priced in. Second, the dollar will most likely weaken, and emerging market equites tend to have a very strong inverse correlation to the dollar. Finally, the relative emerging markets earning-per-share has corrected year-to-date, presenting a much better starting point for emerging market earnings to deliver versus developed markets.
- Deutsche Bank data this week noted that with about 40 percent of Europe’s market value having reported second quarter figures, the region’s profit growth has accelerated to 6 percent for the latest quarter from no growth at all in the prior three-month period. As reported by Bloomberg, the bank added that it’s nothing like the double-digit growth seen in early 2017 or in the U.S., but the dip in economic data earlier this year hasn’t translated into a huge hit to profits, which are now expected to pick up pace in the second half of the year.
- BMW is planning to build a factory in Hungary investing 1 billion euros ($1.17 billion) in a new production facility that will produce 150,000 vehicles annually. This will be BMW’s first new car-making plant in the region since 2000, when it built a site in Germany.
Threats
- In Poland, loans taken by companies for investment purposes saw a decline, on an annual basis, for the first time since 2013. Poland has mostly surprised investors on the upside, but with a worsening shortage of workers, surging wages and an uncertain regulatory environment for businesses, this consumer-led boom could be disrupted, according to Dorata Bartyzel and Adrian Krajweski on Bloomberg.
- Norway’s $1 trillion top wealth fund pulled most of its equity investments run by external managers in Russia under in-house management, aiming to cut exposure to oil and gas prices. The move is part of a plan announced in November 2017 to protect the value of its fund against a drop in oil prices. It is unclear whether Russian holdings were cut since bringing investments in-house.
- Euro-area inflation accelerated to 2.1 percent year-over-year in July, from 2 percent in June, and slightly above the forecast of 2 percent. However, economic growth in the region slowed to 2.1 percent year-over-year in the second quarter from 2.5 percent.

Leaders and Laggards
| Index | Close | Weekly Change($) |
Weekly Change(%) |
|---|---|---|---|
| Nasdaq | 7,812.02 | +74.60 | +0.96% |
| Natural Gas Futures | 2.85 | +0.02 | +0.85% |
| S&P 500 | 2,840.35 | +21.53 | +0.76% |
| Russell 2000 | 1,673.37 | +10.03 | +0.60% |
| DJIA | 25,462.58 | +11.52 | +0.05% |
| Oil Futures | 68.58 | -0.11 | -0.16% |
| 10-Yr Treasury Bond | 2.95 | -0.00 | -0.17% |
| S&P Basic Materials | 371.26 | -0.63 | -0.17% |
| Korean KOSPI Index | 2,287.68 | -7.31 | -0.32% |
| S&P/TSX VENTURE COMP IDX | 702.05 | -5.32 | -0.75% |
| Gold Futures | 1,222.00 | -10.70 | -0.87% |
| XAU | 76.09 | -0.70 | -0.91% |
| S&P/TSX Global Gold Index | 179.80 | -2.28 | -1.25% |
| S&P Energy | 556.06 | -10.16 | -1.79% |
| Hang Seng Composite Index | 3,780.26 | -178.51 | -4.51% |
| Index | Close | Monthly Change($) |
Monthly Change(%) |
|---|---|---|---|
| DJIA | 25,462.58 | +1,287.76 | +5.33% |
| S&P 500 | 2,840.35 | +127.13 | +4.69% |
| 10-Yr Treasury Bond | 2.95 | +0.12 | +4.17% |
| Nasdaq | 7,812.02 | +309.34 | +4.12% |
| S&P Basic Materials | 371.26 | +10.46 | +2.90% |
| Korean KOSPI Index | 2,287.68 | +22.22 | +0.98% |
| Russell 2000 | 1,673.37 | +12.95 | +0.78% |
| S&P Energy | 556.06 | -0.78 | -0.14% |
| Natural Gas Futures | 2.85 | -0.02 | -0.84% |
| Hang Seng Composite Index | 3,780.26 | -77.56 | -2.01% |
| Gold Futures | 1,222.00 | -42.80 | -3.38% |
| S&P/TSX VENTURE COMP IDX | 702.05 | -36.70 | -4.97% |
| Oil Futures | 68.58 | -5.56 | -7.50% |
| S&P/TSX Global Gold Index | 179.80 | -15.62 | -7.99% |
| XAU | 76.09 | -6.78 | -8.18% |
| Index | Close | Quarterly Change($) |
Quarterly Change(%) |
|---|---|---|---|
| Nasdaq | 7,812.02 | +723.86 | +10.21% |
| Russell 2000 | 1,673.37 | +126.81 | +8.20% |
| S&P 500 | 2,840.35 | +210.62 | +8.01% |
| DJIA | 25,462.58 | +1,532.43 | +6.40% |
| Natural Gas Futures | 2.85 | +0.12 | +4.40% |
| S&P Basic Materials | 371.26 | +14.22 | +3.98% |
| S&P Energy | 556.06 | +13.65 | +2.52% |
| Oil Futures | 68.58 | +0.15 | +0.22% |
| 10-Yr Treasury Bond | 2.95 | +0.00 | +0.10% |
| S&P/TSX Global Gold Index | 179.80 | -11.70 | -6.11% |
| XAU | 76.09 | -6.29 | -7.64% |
| Korean KOSPI Index | 2,287.68 | -199.57 | -8.02% |
| Gold Futures | 1,222.00 | -109.60 | -8.23% |
| S&P/TSX VENTURE COMP IDX | 702.05 | -69.20 | -8.97% |
| Hang Seng Composite Index | 3,780.26 | -397.18 | -9.51% |
U.S. Global Investors, Inc. is an investment adviser registered with the Securities and Exchange Commission ("SEC"). This does not mean that we are sponsored, recommended, or approved by the SEC, or that our abilities or qualifications in any respect have been passed upon by the SEC or any officer of the SEC.
This commentary should not be considered a solicitation or offering of any investment product.
Certain materials in this commentary may contain dated information. The information provided was current at the time of publication.
Some links above may be directed to third-party websites. U.S. Global Investors does not endorse all information supplied by these websites and is not responsible for their content.
Holdings may change daily. Holdings are reported as of the most recent quarter-end. The following securities mentioned in the article were held by one or more accounts managed by U.S. Global Investors as of (06/30/2018):
Oracle Corp.
Sinopec Corp.
Northern Empire Resources Corp.
Coeur Mining Inc.
Golden Star Resources Ltd.
Gold Fields Ltd.
MOL Hungarian Oil and Gas PLC
American Airlines Group Inc.
*The above-mentioned indices are not total returns. These returns reflect simple appreciation only and do not reflect dividend reinvestment.
The Dow Jones Industrial Average is a price-weighted average of 30 blue chip stocks that are generally leaders in their industry.
The S&P 500 Stock Index is a widely recognized capitalization-weighted index of 500 common stock prices in U.S. companies.
The Nasdaq Composite Index is a capitalization-weighted index of all Nasdaq National Market and SmallCap stocks.
The Russell 2000 Index is a U.S. equity index measuring the performance of the 2,000 smallest companies in the Russell 3000, a widely recognized small-cap index.
The Hang Seng Composite Index is a market capitalization-weighted index that comprises the top 200 companies listed on Stock Exchange of Hong Kong, based on average market cap for the 12 months.
The Taiwan Stock Exchange Index is a capitalization-weighted index of all listed common shares traded on the Taiwan Stock Exchange.
The Korea Stock Price Index is a capitalization-weighted index of all common shares and preferred shares on the Korean Stock Exchanges.
The Philadelphia Stock Exchange Gold and Silver Index (XAU) is a capitalization-weighted index that includes the leading companies involved in the mining of gold and silver.
The U.S. Trade Weighted Dollar Index provides a general indication of the international value of the U.S. dollar.
The S&P/TSX Canadian Gold Capped Sector Index is a modified capitalization-weighted index, whose equity weights are capped 25 percent and index constituents are derived from a subset stock pool of S&P/TSX Composite Index stocks.
The S&P 500 Energy Index is a capitalization-weighted index that tracks the companies in the energy sector as a subset of the S&P 500.
The S&P 500 Materials Index is a capitalization-weighted index that tracks the companies in the material sector as a subset of the S&P 500.
The S&P 500 Financials Index is a capitalization-weighted index. The index was developed with a base level of 10 for the 1941-43 base period.
The S&P 500 Industrials Index is a Materials Index is a capitalization-weighted index that tracks the companies in the industrial sector as a subset of the S&P 500.
The S&P 500 Consumer Discretionary Index is a capitalization-weighted index that tracks the companies in the consumer discretionary sector as a subset of the S&P 500.
The S&P 500 Information Technology Index is a capitalization-weighted index that tracks the companies in the information technology sector as a subset of the S&P 500.
The S&P 500 Consumer Staples Index is a Materials Index is a capitalization-weighted index that tracks the companies in the consumer staples sector as a subset of the S&P 500.
The S&P 500 Utilities Index is a capitalization-weighted index that tracks the companies in the utilities sector as a subset of the S&P 500.
The S&P 500 Healthcare Index is a capitalization-weighted index that tracks the companies in the healthcare sector as a subset of the S&P 500.
The S&P 500 Telecom Index is a Materials Index is a capitalization-weighted index that tracks the companies in the telecom sector as a subset of the S&P 500.
The NYSE Arca Gold Miners Index is a modified market capitalization weighted index comprised of publicly traded companies involved primarily in the mining for gold and silver.
The Consumer Price Index (CPI) is one of the most widely recognized price measures for tracking the price of a market basket of goods and services purchased by individuals. The weights of components are based on consumer spending patterns.
The Purchasing Manager’s Index is an indicator of the economic health of the manufacturing sector. The PMI index is based on five major indicators: new orders, inventory levels, production, supplier deliveries and the employment environment.
The S&P/TSX Venture Composite Index is a broad market indicator for the Canadian venture capital market. The index is market capitalization weighted and, at its inception, included 531 companies. A quarterly revision process is used to remove companies that comprise less than 0.05% of the weight of the index, and add companies whose weight, when included, will be greater than 0.05% of the index.
Diversification does not protect an investor from market risks and does not assure a profit.
The producer price index (PPI) is a family of indexes that measures the average change in selling prices received by domestic producers of goods and services


