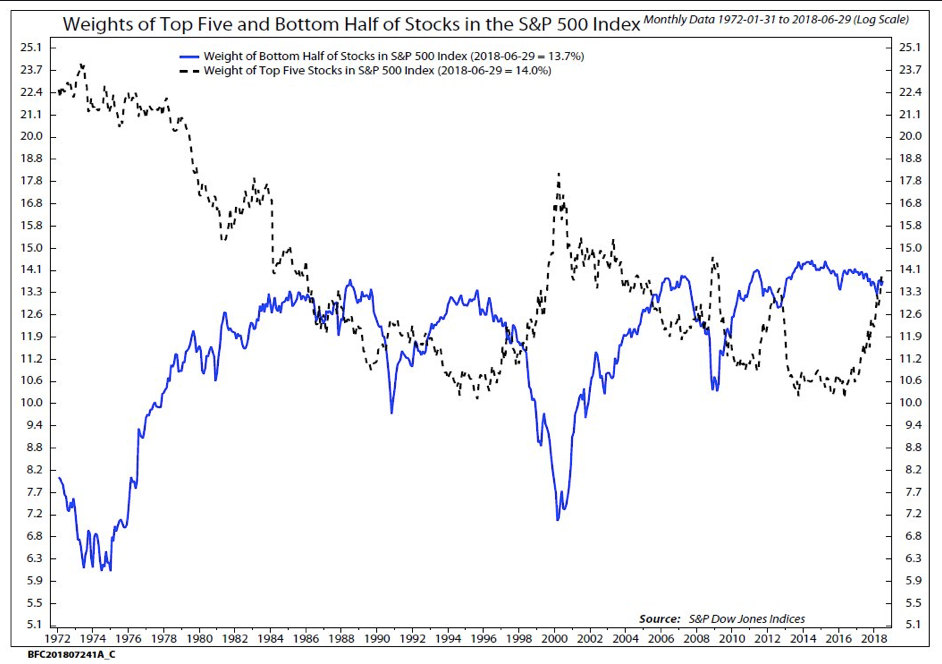
Summary: The 5 largest stocks comprise about 16% of the S&P 500. That's normal. In fact, the importance of the top 5 stocks was far greater in the 1970s than anytime in the past 5 years.
It's true that today's top 5 stocks - known by the acronym FAAMG - have largely outperformed most other stocks. That's how they became today's top 5. Over time, stock indices have typically been driven higher by a small number of stocks. And over time, those leaders have continually changed. This is the story of the stock market. Only one of today's top 5 was also in the top 5 in 2013. At the height of the tech bubble in 2000, the top 5 were companies like GE, Exxon, Pfizer, Citigroup and Cisco.
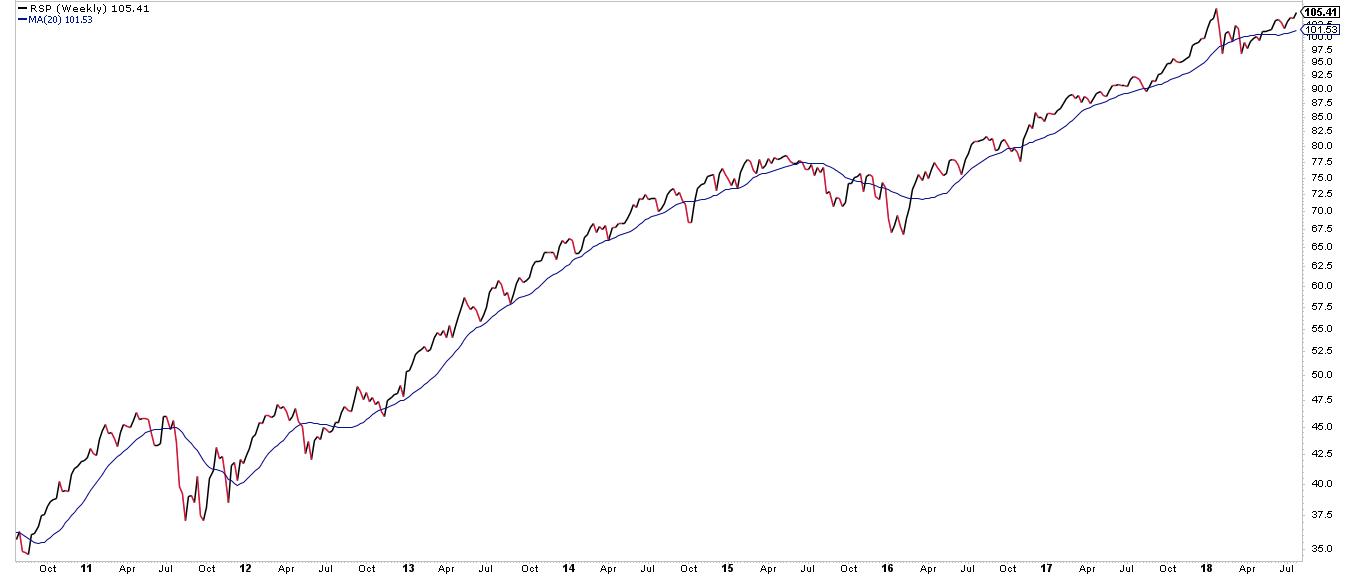
Right now, most stocks are doing fine: an index in which non-FAAMG stocks have a 99% weighting closed at the second highest level in its history today. It's on pace for a 10% gain in 2018.

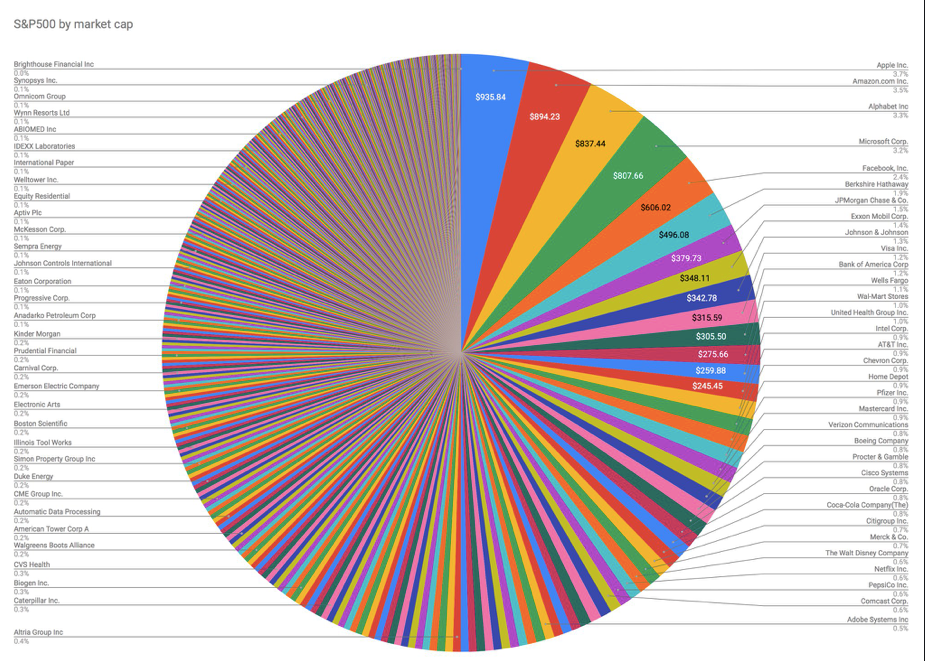
Note that this does not mean that the these 5 stocks are equal to half the index. Instead, they equal about 16% of the S&P (from Jack Gavigan).
But that is not the same as saying the top 5 stocks have doubled their weighting. As NDR's research shows, the top 5 have increased their weighting by about 1/3. What accounts for the difference? Survivorship bias. Today's top 5 have, by definition, largely outperformed most stocks. That's how they became today's top 5.
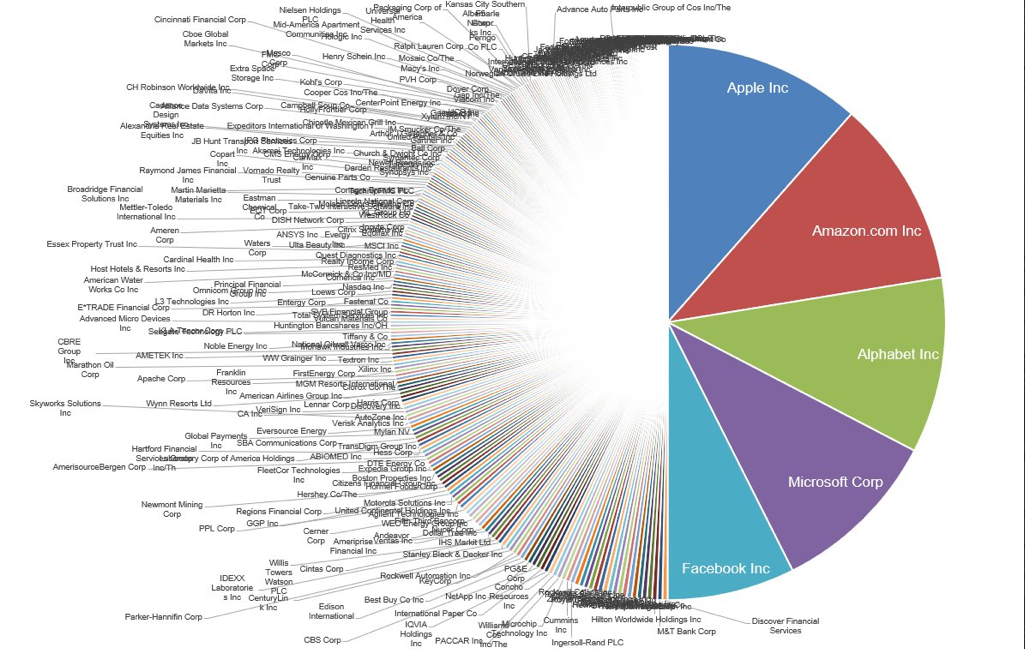
Only 1 of today's top 5 was in the top 5 in 2013: Apple. The other top 5 companies in the US were Exxon, Berkshire, Walmart and GE. Google, Amazon and Facebook were not even the Global top 10 in 2013. And previous heavy weights, like Wells Fargo, IBM, Walmart and Chevron have completely fallen off the list. Today's behemoths are obvious only in hindsight (from @tableaupublic).
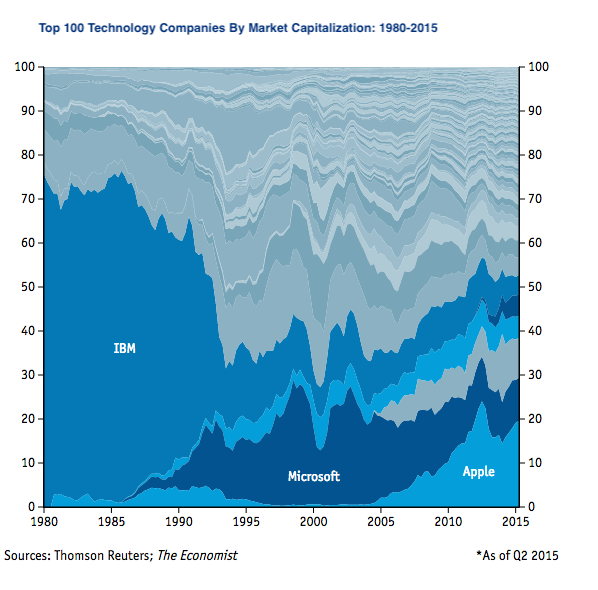
This is the story of the stock market. Over time, the leaders change. In 1980, 7 of the top 10 in the US were in the oil and gas industry. At the height of the tech bubble in 2000, the top 5 were companies like GE, Exxon, Pfizer, Citigroup and Cisco (from Ben Carlson).
One constant in the stock market is the worry about concentration. It's hard to believe now but the dominance of IBM used to be a concern. Alone, it was more than 6% of the S&P in 1985 and it dominated the computer and software business in ways that seemed insurmountable to competitors and investors at the time. But new leaders emerged, the previous behemoth was put aside and the stock market was largely unaffected (from the Economist).
While it might seem unnatural, it's normal for a few companies to account for the majority of the stock market's annual gains. From 1994 to 2014, the top 6 stocks in the SPX (which is only 1% of the total) accounted for an average of 33% of the index's gain in any year; the top 20 stocks (only 4% of the total) accounted for an astounding 68% of the index's gain.
In other words, it is common for a relatively few number of stocks to disproportionately carry the indices higher. Collectively, 96% of stocks will often lag. More on this here (from Cliff Asness of AQR Capital Management).
In summary, the 5 largest stocks are big (but not unusually so) and outperforming most other stocks (which is how they came to be in the top 5). All of this is normal. Over time, stock indices have typically been driven higher by a small number of stocks. And over time, those leaders have continually change. This is the story of the stock market. Right now, most stocks are doing fine: an index in which non-FAAMG stocks have a 99% weighting closed at the second highest level in its history today.
© The Fat Pitch
Read more commentaries by The Fat Pitch