Weekly Market Summary
Membership required
Membership is now required to use this feature. To learn more:
View Membership BenefitsSummary: US equities have gained every month since April, and are up over 3% so far in July. Our long term view remains that SPX will make a new all-time high in the months ahead. That is now just 2.5% away.
The short term is less clear. SPX has gained 3 weeks in a row; most often, these streaks are followed by a higher high without too much interim give back. Sentiment and volatility data mostly supports further gains.
But, while July is typically a strong month, that strength has often been realized by the end of last week. The rest of the month is usually flat, at best, and seasonality is typically a headwind in August and September. Right now, that tendency is further supported by weakening breadth momentum.
Earning data pushes to the forefront this week: 35% of the companies in the S&P will report their 2Q earnings in the next 5 days. The advanced estimate of 2Q GDP will be released Friday.
US equities rose for a third week in a row this week, although the gains were minor (from alphatrends.net) Enlarge any chart by clicking on it.
The set up at the end of June was for higher prices: "July is a seasonal tailwind, and several sentiment indicators suggest a bias higher (to the top of the range) is warranted." In the event, SPX has gained 3.1% and NDX 4.3% so far in July.
A three consecutive week gain in SPX is a good sign of momentum. Most often (more than 85% of the time), 3 week gains are followed by a higher high without too much interim give back. That doesn't necessarily mean a higher close this week, but a small loss would likely be followed by a higher close in the next 1-2 weeks (blue lines).
The overall trend remains higher. SPX is trading above all of its moving averages, which are trending higher. This is the definition of an uptrend. NDX made a new all-time high (ATH) on Tuesday and small caps made a new inter-day ATH on July 10.
SPX made its most recent ATH on Friday January 26. It has now traded up to levels from January 30-February 1 (yellow shading), which was resistance on the first attempt to surpass. Through targets the open gap from January 30 at 2839-53. On weakness, WS1 is 2788, which was also the mid-June high (top blue line). A good rule of thumb is that early weakness should be reversed by Wednesday morning, with SPX back above its WPP (2801). If that doesn't happen, a down week becomes more probable.
Daily momentum has been strong the past 2 weeks, but weakened on Thursday and Friday (top panel). There has been an unfortunate pattern the past 6 months for momentum to weaken from "overbought" to "oversold" (blue arrows). That's in contrast to the persistent uptrend in 2017 (circles). With SPX breaking out of its 6-month range in July, it could be that this pattern has now ended. On weakness this week, watch for price to bottom on "oversold" momentum once again.
Fighting against the positive trend in equities this month is upcoming seasonality. July is typically a strong month, but that strength has often been realized by the end of last week. The rest of the month is usually flat, at best (from Almanac Trader).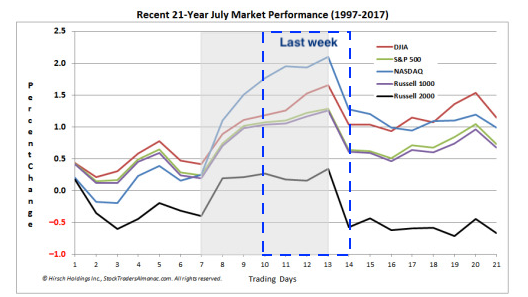
Moreover, the following 10 weeks are typically choppy with a bias lower (from Movement Capital).
Seasonal patterns can change. Not all Decembers see gains just like not all Augusts and Septembers see losses. What else supports weakness ahead?
Right now, mostly breadth momentum, which weakened in the past few days (bottom panel). This needs to be reversed early this week or there will be more reason to suspect lower prices short term (circles; SPX in top panel).
Sentiment data is mixed. Put/call data is mostly neutral, as is the volatility term structure. Fund flows indicate excessive bearishness. Fund managers have dropped their global equity allocations and have relatively high levels of cash - also signs of relative bearishness.
The Advisor and Investor Model (AIM) from Sentimentrader, which combines sentiment survey data from several sources, is also indicating relatively bearish sentiment. It can become more extreme, but low readings like now have come near at least short term lows in equities.
This week, 35% of the SPX companies will report their 2Q earnings (just 17% have reported so far). Macro data includes new home sales on Wednesday, durable goods on Thursday and the advance estimate of 2Q GDP on Friday. The consensus expects GDP growth of (a very strong) 4% (from the Atlanta Fed). The month of July ends the following Tuesday.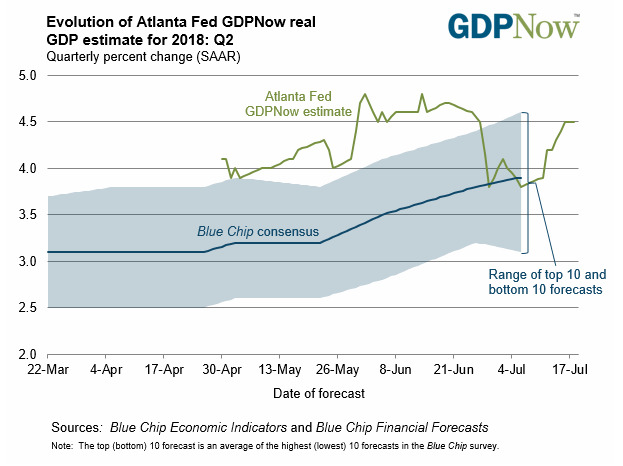
It might be time for emerging markets to outperform. 
© The Fat Pitch
Membership required
Membership is now required to use this feature. To learn more:
View Membership BenefitsSponsored Content
Upcoming Virtual Events View All


