Modern finance has discovered that stocks that share certain fundamental characteristics called “factors” exhibit different return and risk characteristics than the overall market. These factors or “dimensions of the market” can be classified as: dividend yield, volatility, momentum, quality, size and value.
Baskets of stocks selected using these factors have earned excess returns to the overall market over long periods of time. Stocks of companies that pay higher dividends have as a group earned superior returns to lower and non-dividend paying stocks while stocks that have exhibited low volatility have outperformed stocks that display high volatility. Stocks that have exhibited positive momentum – i.e., performed relatively well over the past three to twelve months – have outperformed stocks that display negative momentum. Stocks of higher quality companies selected on such measures as return of equity and earnings stability have outperformed low quality companies. Small capitalization stocks have earned on average higher returns than stocks of large companies. Value stocks that are low-priced in relation to earnings, dividends, cash flow or book value on average have outperformed growth stocks.
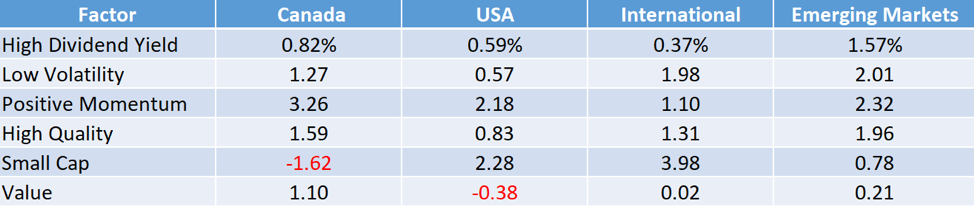
The long-run outperformance of stocks selected on factor metrics has been shown to be generally pervasive around the globe[i]. Our analysis affirms this finding. As demonstrated in the following chart, excess annual returns were generated for most factors in nearly every region of the globe over the fifteen-year period from 2003 through 2017 (see Appendix I for Sources). Of the 24 regional factor groups, 22 or 92% had positive returns. Only small cap in Canada and value in the USA delivered negative returns.
Annualized Factor Excess Return – by Region
2003 to 2017

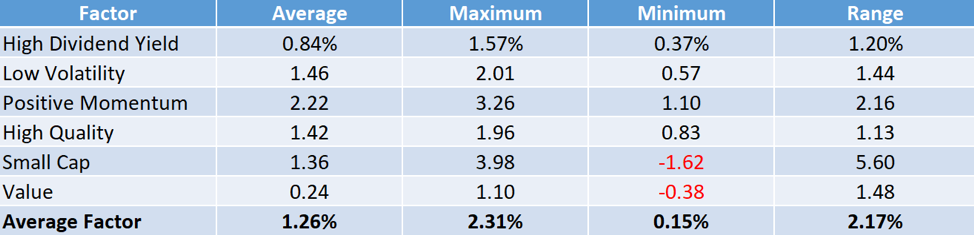
Despite an overall positive picture, there was a tremendous difference in the excess returns delivered by regional factors. As per the following chart, the average regional return by factor ranged from a high of 2.22% for momentum to a low of 0.24% for value. Low volatility, high quality and low size all clustered in the 1.4% range while high dividend yield was next to last with a 0.84% return. The average excess return delivered by factors over all regions from 2003 through 2017 was 1.26% per annum.
Annualized Factor Excess Return – Ranges
2003 to 2017
Regionally, the maximum annual returns by factor ranged from 3.98% for small cap to 1.1% for value with an average maximum excess return of 2.31%. The minimum regional returns by factor ranged from 1.1% for positive momentum to -1.62% for small cap with an average minimum return of 0.15%.
The range of regional factor returns was significant. Small cap varied from a stellar 3.98% excess return internationally to a dismal -1.62% return in Canada. This variation reflects the streakiness of small company stock performance in general, the domestic focus of small company stocks as well as the dominance of the poorly performing resource and energy sectors in Canadian small company stocks. High quality which is characterized by more uniform fundamental characteristics had the lowest return range of 1.13%.
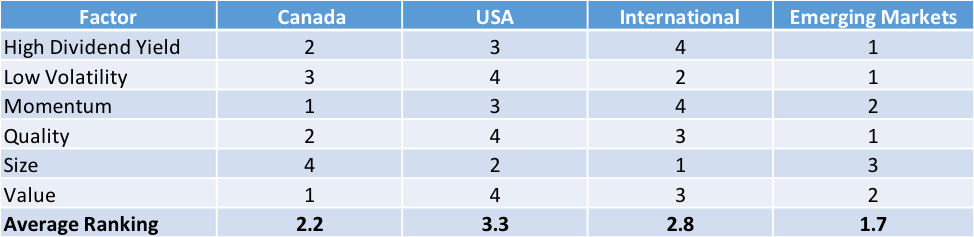
Which regions have offered the highest opportunity for pursuing factor returns? Based on a comparative ranking where 1 equals the highest excess return and 4 equals the lowest, emerging markets followed closely by Canada have been the best overall regions to pursue excess returns through factor exposure. International markets came in third while the USA was last.
Annualized Factor Excess Return – Ranking
2003 to 2017
Canada led all the regions in the excess returns generated by positive momentum and value stocks while emerging markets led in high dividend yield, low volatility and quality stocks. International markets was the stand out leader in small cap stocks. The US stock market did not lead in any factor returns.
These rankings mirror the risk related to the markets. Emerging markets followed by Canada, a single developed country market, are the highest risk. International markets, a diversified mix of developed country stock markets, was third. The US, the deepest, most liquid and lowest risk of the markets came in last.Canada led all the regions in the excess returns generated by positive momentum and value stocks while emerging markets led in high dividend yield, low volatility and quality stocks. International markets was the stand out leader in small cap stocks. The US stock market did not lead in any factor returns.
These findings inform sound portfolio construction. Advisors and investors who use factor exposure in pursuit of excess returns can improve their potential for outperformance by constructing their portfolios using a diversified multi-factor approach. This avoids the problem of factor concentration in a lagging factor - such as value in recent years. Factor diversification by region is also critical. This is particularly important for small company stocks where variations have been most significant.
Finally, low cost access to factor exposures is critical. Fortunately, a growing array of exchange traded funds where competition is driving management expense ratios to ever lower levels provides economic access to factor exposure on a global basis.
29th June 2018
© Tacita Capital
Appendix I
|
Factor Excess Return
|
Annualized Factor Excess Return Calculated as Follows - Gross Return Indices in CDN by Region
|
|
High Dividend Yield
|
MSCI High Dividend Yield Less MSCI Broad Market Standard Index
|
|
Low Volatility
|
MSCI Minimum Volatility Less MSCI Broad Market Standard Index
|
|
Positive Momentum
|
MSCI Momentum Less MSCI Broad Market Standard Index
|
|
High Quality
|
MSCI Quality Less MSCI Broad Market Standard Index
|
|
Low Size
|
MSCI Small Cap Less MSCI Broad Market Standard Index
|
|
Value
|
MSCI Value Less MSCI Broad Market Standard Index
|
Source: Morningstar Direct
[i] Asness, C.S., T. Moskowitz, and L. Pedersen. “Value and Momentum Everywhere.” The Journal of Finance, Vol. 68, No. 3 (2013), pp. 929-985. See also Fama, E.F. and French, K.R. (2017) International Tests of a Five-Factor Asset Pricing Model. Journal of Financial Economics, 123, 441-463
Disclaimer
Read more commentaries by Tacita Capital