Summary: During their lifetime, most investors will likely endure another decade-long bear market like the ones in the 1970's and 2000's. Younger investors will probably suffer through at least two.
When thinking about the last 20 years, investors easily recall the tech bubble, the financial crisis and the flash crash in 2010 that together form the most recent lost decade for equities. These negative events dominate our decision making. The (more important) 300% return from equities during this time does not.
For all the time spent worrying about bear market risks, the overwhelming majority of short term traders and professional fund managers haven't found a way to avoid it. And if they have, it has been at the expense of also missing out on the gains during bull markets.
If you are going to do better than most, it won't be by continually anticipating a market crash. That has invariably been an exit ramp onto a dead end street. Tuning out noise and consistently following investment rules and hard data is far more challenging than it sounds, but the performance of those that who do it can be in the top 5%, maybe the top 1%.
If you are in your 40's or 50's, you will probably endure another lost decade like the 2000's, where stocks did not appreciate on a net basis. If you are in your 20's or 30's, there's a good chance you will endure at least two such periods in your lifetime.
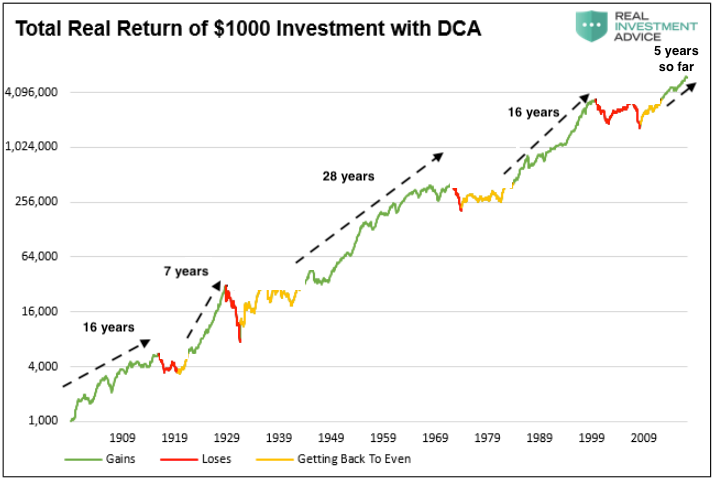
The future could turn out different than the past, but the pattern over the past 120 years is that expansions alternate with long periods where equity markets churn sideways. That's true even if you include dividends and assume dollar-cost averaging (DCA). The chart below shows the length of time US equities have spent getting back to breakeven from a peak (from Lance Roberts; read his recommended article here). Enlarge any chart by clicking on it.

The next chart highlights the length of time between these breakeven periods (annotations are mine).
Even with 120 years of data, the sample size is too small to draw any firm conclusions, but let's try. Lost decades (secular bear markets) are typically longer than 10 years; the intervening expansions (secular bull markets) are typically 16 years or more. The longest secular bear markets (1930's and 1970's) were followed by the longest secular bull markets (1950's-60's and 1980's-90's). That suggests the current secular bull market could still be in its first half, although that doesn't preclude an intervening cyclical bear market.
Buying and holding equities eventually pays off: stocks are biased higher over time, as the charts above show. The return on equities, including all the periods when they lost value, is more than 7% per annum after inflation. In real terms, $4000 in 1920 became $250,000 by 1960.
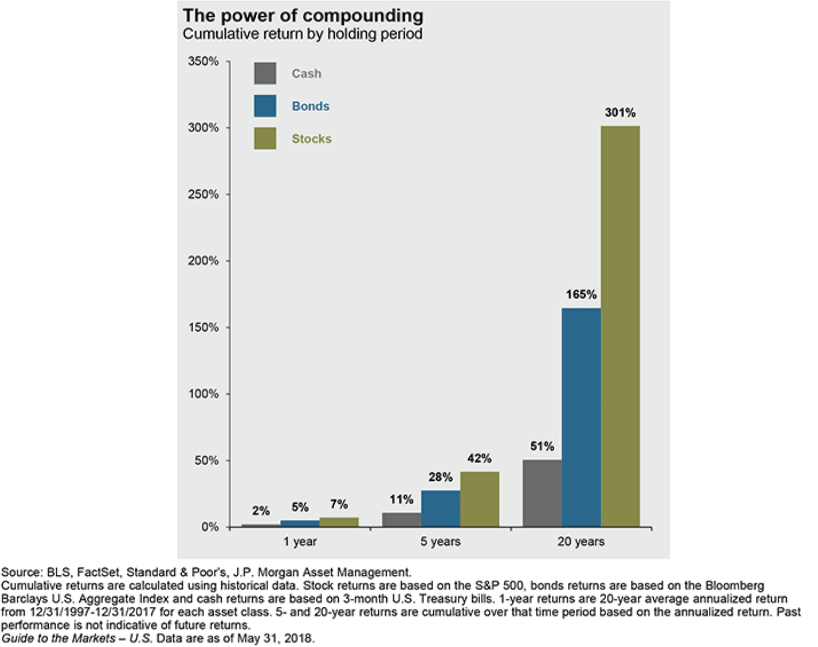
If you bought the S&P in 1997 and held it for the next 20 years - a period which included two recessions and stock market crashes of 50% and 60%, the largest of the past 80 years - your return would still have been 300% (nominal terms; from JPM).
Nonetheless, equities have undeniably endured long periods where few make any net gains. As Mr. Roberts correctly points out, surviving these periods will try the patience of any long term investor. For older investors, a badly timed lost decade can be devastating to their retirement.
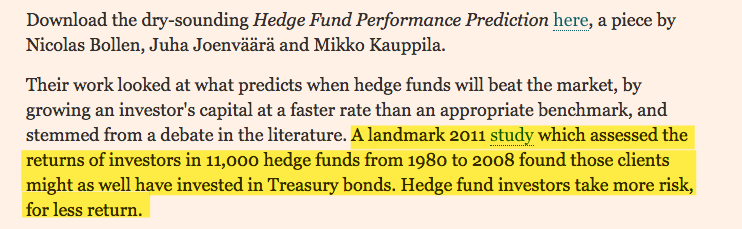
While it is objectively and demonstrably in investors best interest to play the long game, when faced with the psychological pain of a loss, most opt to protect their downside. This tradeoff is the devil's bargain for equity investors, and it explains why the average investor has earned just a 2% return over the past 20 years (from Blackrock).
Why does this happen?
Morgan Housel calls it the "cost avoidance syndrome" (his excellent article, quoted several times in this post, is here). The cost for earning the nice long term return on equities is enduring not-so-nice volatility and uncertainty. Many seek the reward without paying the price; that's not an outcome permitted by a fairly efficient market.
That doesn't mean it's impossible. Innovative investors have found ways of combining macro and price movement data to mostly capture upside and mostly avoid downside. More on this later. But tuning out noise and slavishly following investment rules and hard data is more challenging than it sounds. So, a few outperform over time but the vast majority do not.
You will find this to be true whether you look at hedge funds, famous investors, mutual fund managers or day traders.
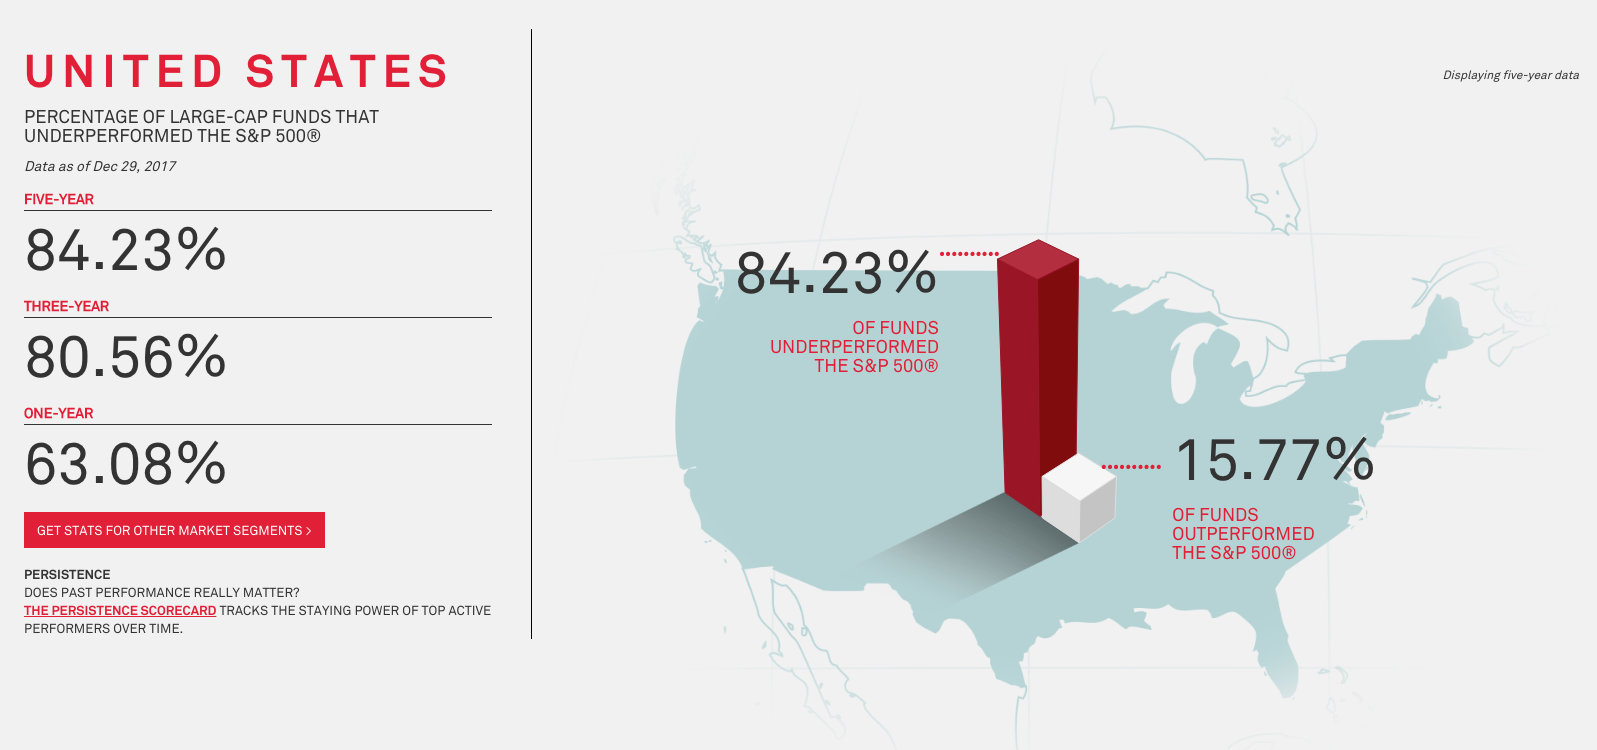
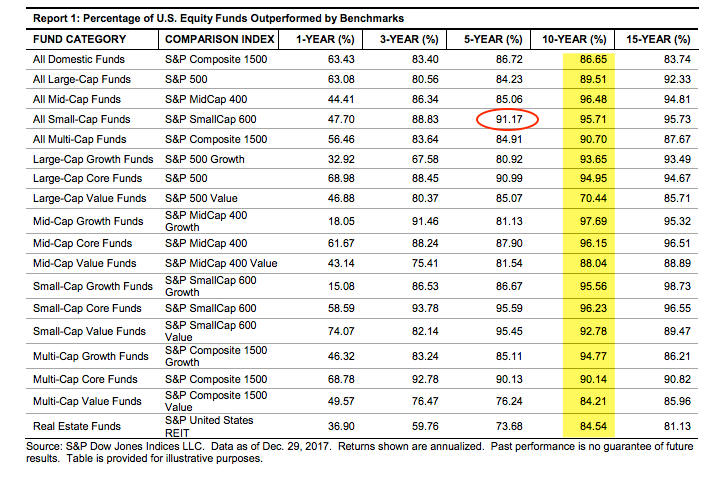
Over the past 5 years, less than 2 out of 10 US equity funds have matched the performance of their benchmark index (the next several charts are from SPIVA).
This is not just a US-based problem. The chart above is not much different for funds focused on less heavily researched emerging markets (Mexico, Chile, Brazil, South Africa) or for developed markets in Europe and Canada.
This is also not just a feature of bull markets. Over the past 10 years, which includes the 2008 bear market, 90% of US large cap funds underperformed their benchmark.
Likewise, in the 5 years that spanned 2008 to 2012 - when the S&P dramatically fell, rose and barely broke even overall, i.e., the kind of environment where skill and experience should matter most - 75% of large cap funds underperformed.
The performance of small cap managers is worse: more than 8 in 10 underperformed during that 2008-12 period and more than 90% underperformed in the past 5 years. This is surprising: small cap stocks are more numerous, less researched and more speculative, exactly the kind of environment where experience and superior fund management should matter most. It doesn't.
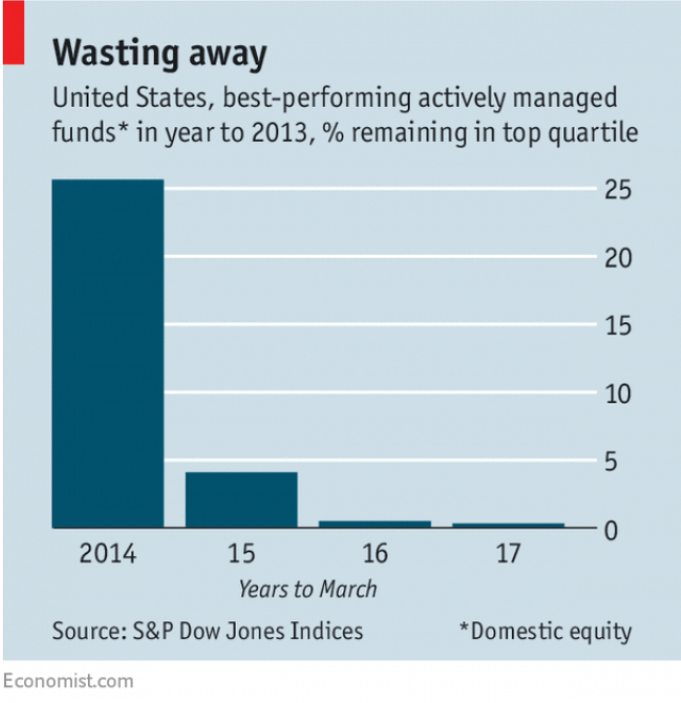
Top performing funds are typically unable to sustain their performance. If you picked a top quartile fund in 2013, only a quarter were still top performing the next year. After another three years, just 0.3% were still top performing (from The Economist).
That same study showed that almost a third of the best performing funds during the 2008-12 period became among the worst quartile funds in the 2013-2017 period. Either luck explains outperformance, or what worked in a rocky investment environment did not translate well to a continuing bull market environment (style).
Obviously, investors are looking to make money, not just beat indices. But if the equity market is rising by 10% and your return is 8%, you're paying someone (or putting in a lot of work yourself) to do worse than if you did nothing. The benchmark matters, especially as investment options increase and investment costs drop to fractions of a percent.
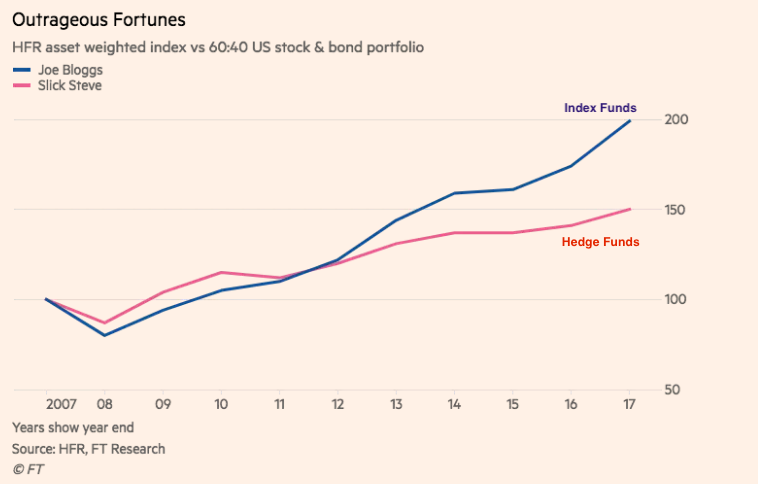
Many traditional funds focus on stock picking and investment styles but have limited market timing flexibility (they have to remain mostly invested). That's less true of hedge funds. Nonetheless, hedge funds have been serial underperformers for more than a decade (from The Financial Times).
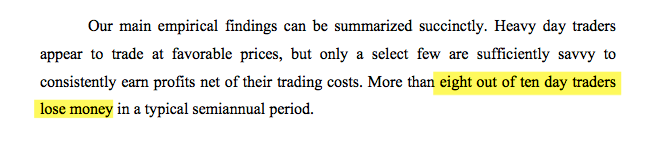
It's true that larger funds have a harder time sustaining their success as their best ideas are diluted by their need to deploy more and more capital. But nimble small investors are not notable for their superior returns. Day traders don't just underperform a benchmark; they mostly lose money (from Haas School).
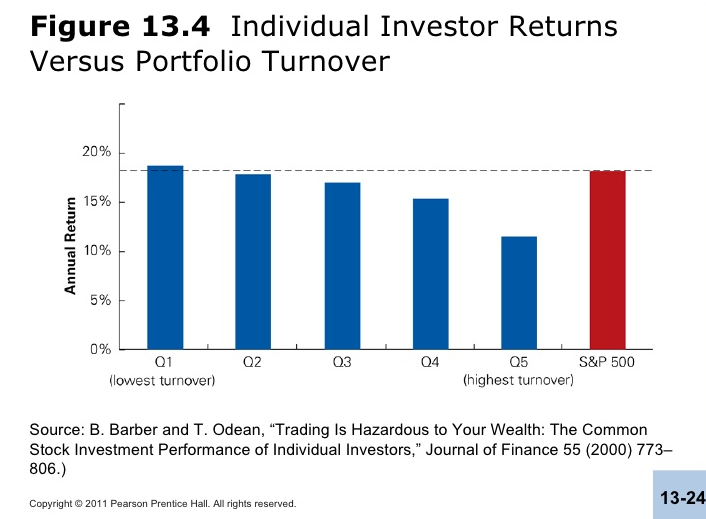
Mr. Housel's "cost avoidance syndrome" is probably a key determinant to performance. Individual investors who mostly ignore the gyrations of the market do well; but the more they get involved in their portfolio, the lower their returns (here).
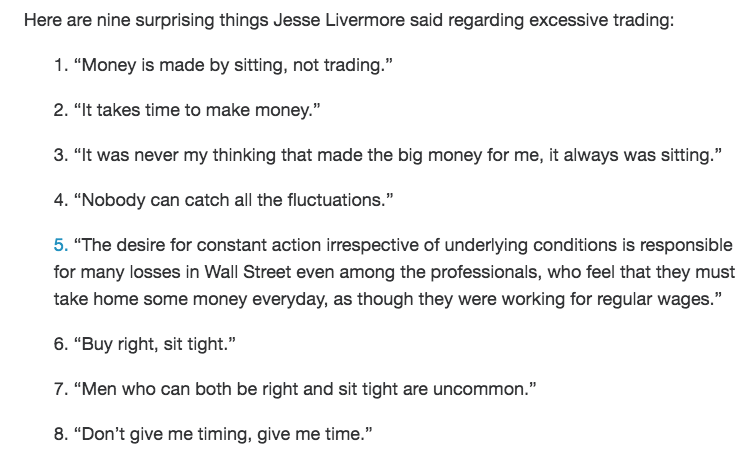
That famous speculator, Jesse Livermore, uncovered this phenomenon a century ago (from Josh Brown).
A short term focus is most often the result of perceived risks in excess of longer term gains. The human mind automatically assigns a high probability to prominent (but rare) events. Thinking about the last 20 years, investors easily recall the tech bubble, the financial crisis and the flash crash in 2010 that together form the most recent lost decade for equities. These negative events dominate our decision making. The (more important) 300% return from equities during this time does not.
We detailed this behavioral bias in Following The Stock Market Is Bad For Your Returns. Risk-avoidance is a basic human trait: the nature of evolution has been to favor individuals who avoid risk long enough to propagate the next generation. As Warren Buffet said, "in order to succeed, you must first survive."
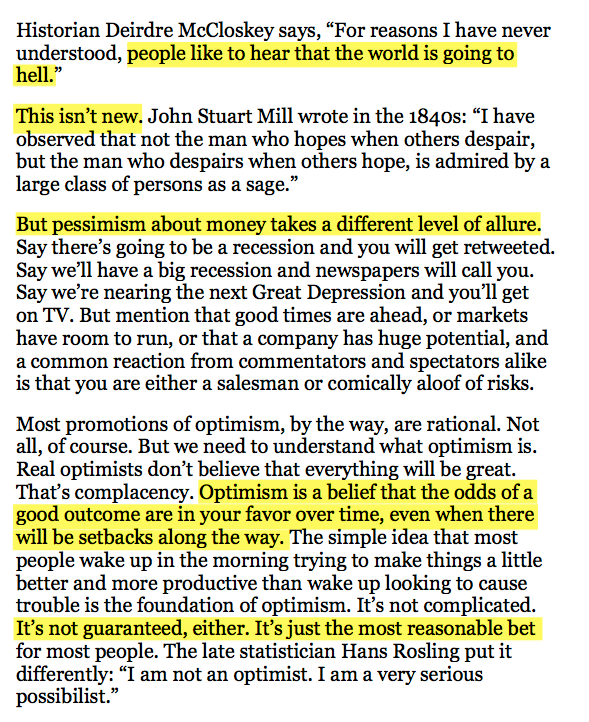
Mr. Housel calls this "the seduction of pessimism in a world where optimism is the most reasonable stance." People are naturally attracted to stories about doom. This is not new, and it's especially true when it comes to money. The irony is that optimism is regarded as naive although it has consistently been the better bet.
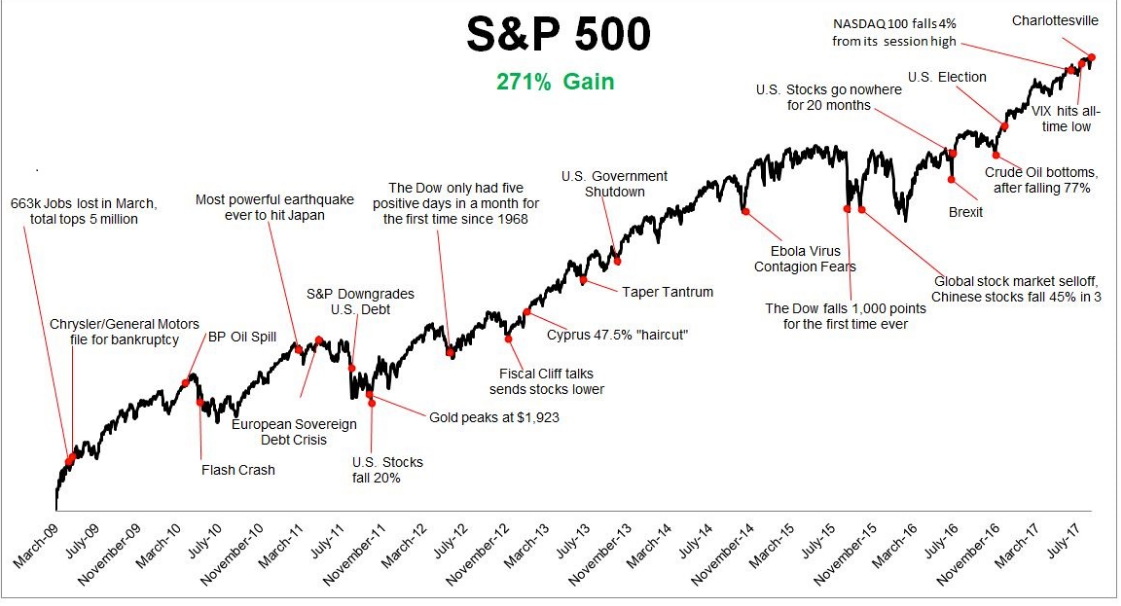
The current bull market has been no different. The economic data has been consistently supportive for equities, but there has been a steady and seemingly endless counter narrative focused on risk (from MarketWatch).
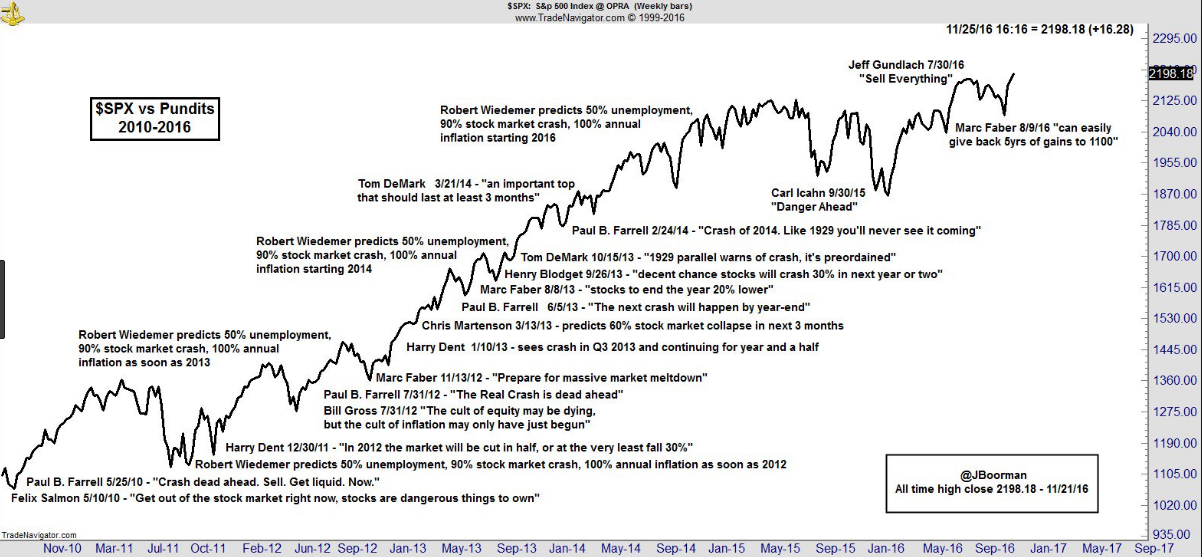
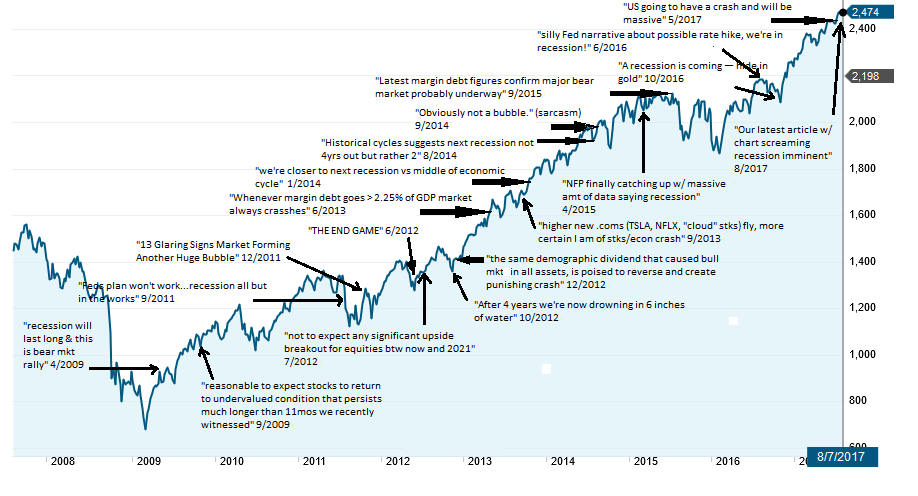
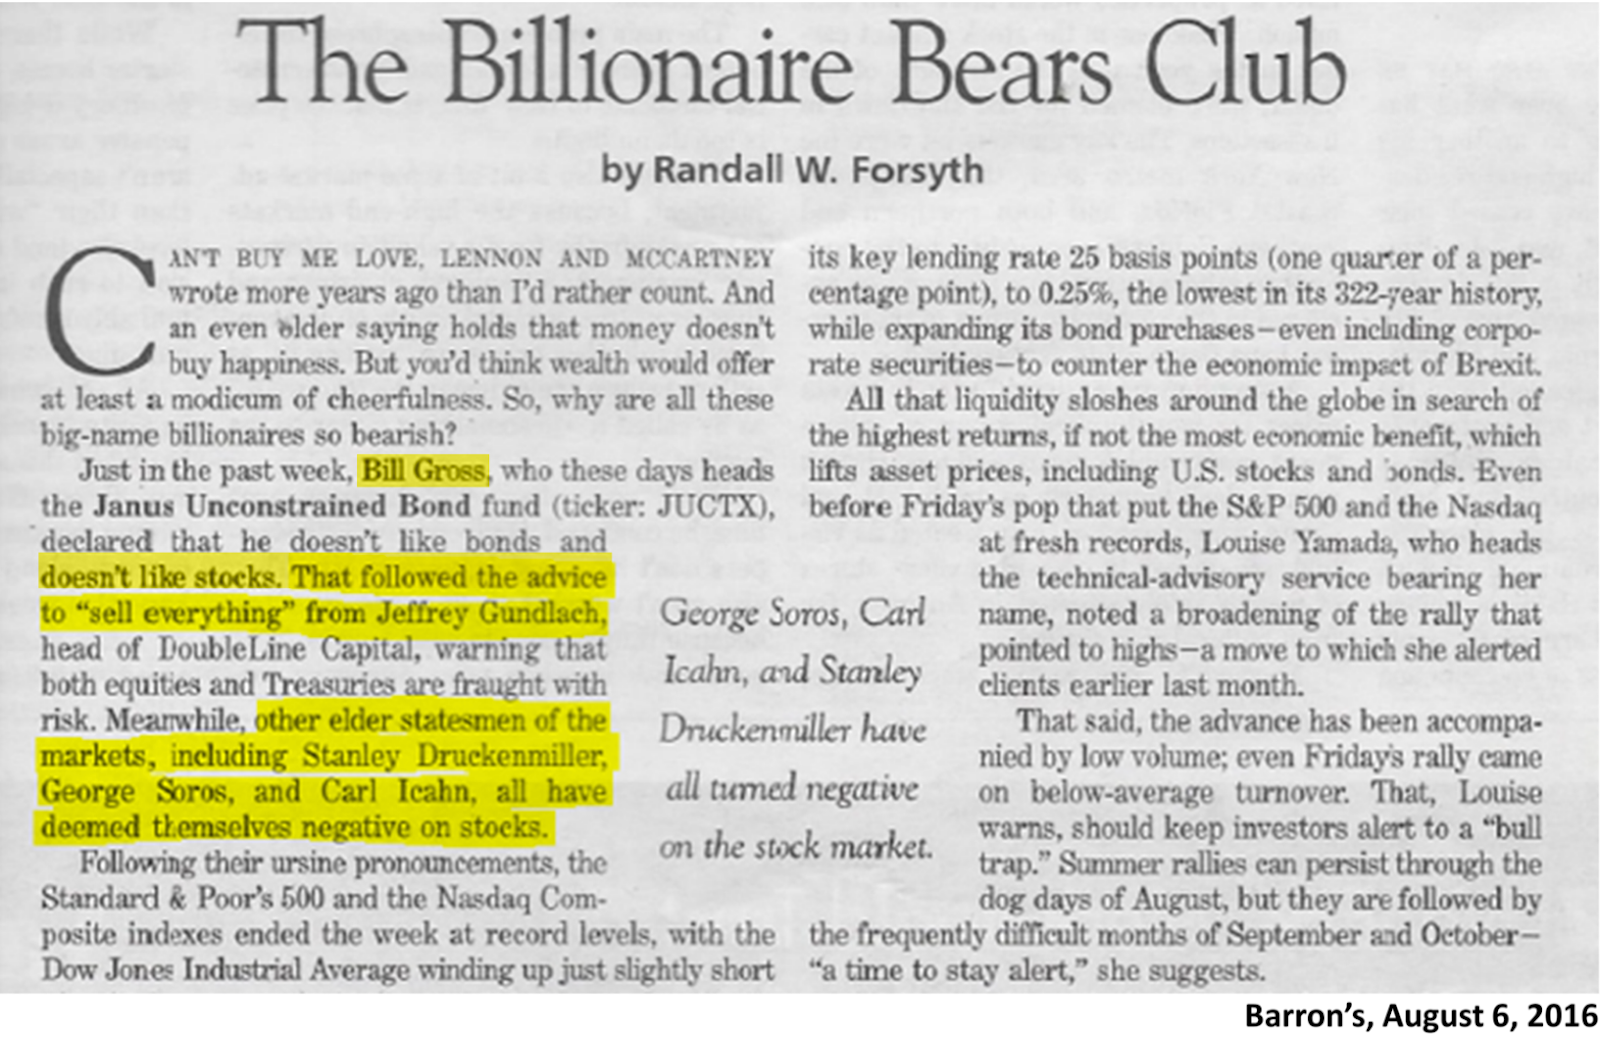
These are the narratives that are amplified in the press and that many prominent and active investors follow to their detriment (from Jon Boorman, Daniel Miller and Barron's, respectively).
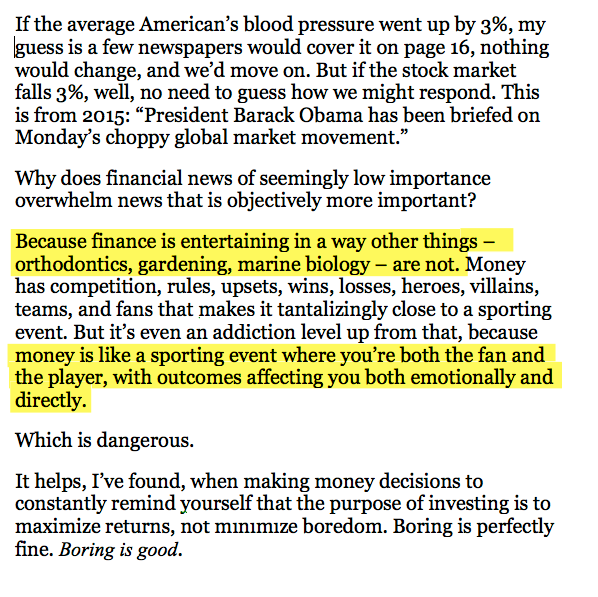
A majority of investors follow every bend and turn in the market like they are following professional sports, in part because it's like a game where they are both player and spectator. Mr. Housel:
The overwhelming majority of investors are best served by focusing on their careers and their savings and not on meddling with their investment portfolio. Professional investors almost all underperform. Individual investors massively underperform. The most famous long term investor, Warren Buffet, started with a net worth of $6000 when he was 15; he's now worth $73b. His basic philosophy is simple:
"Long term, the stock market is going to be higher, and I've written that many times. In terms of what it's going to do next year or tomorrow, I have no idea. Never have, never will. Our favorite holding period is forever."
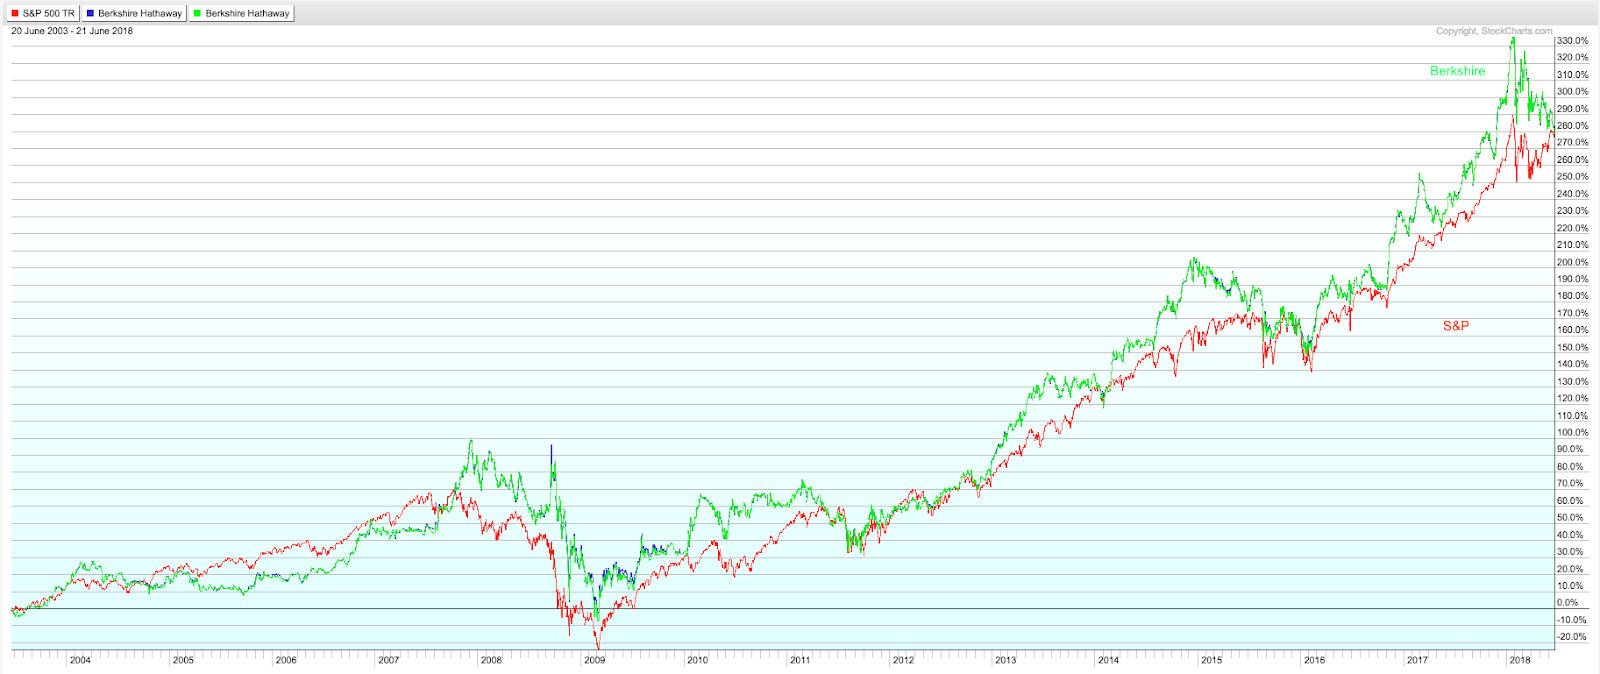
His company, Berkshire Hathaway, has outperformed and underperformed at various points in time. In the past 15 years, it's return has closely matched the S&P.
If you are going to do better than most investors, it won't be by continually anticipating a market crash because of the Fed/QE (here), debt (here), indexing (here), demographics (here), buybacks (here), 1987 (here), what happened in Japan (here) or any of the other memes that regularly excite investors. These have all been an exit ramp onto a dead end street.
Innovative investors have found ways of combining macro and price movement data to mostly capture upside and mostly avoid downside. One example using macro data from Philosophical Economics is described here.
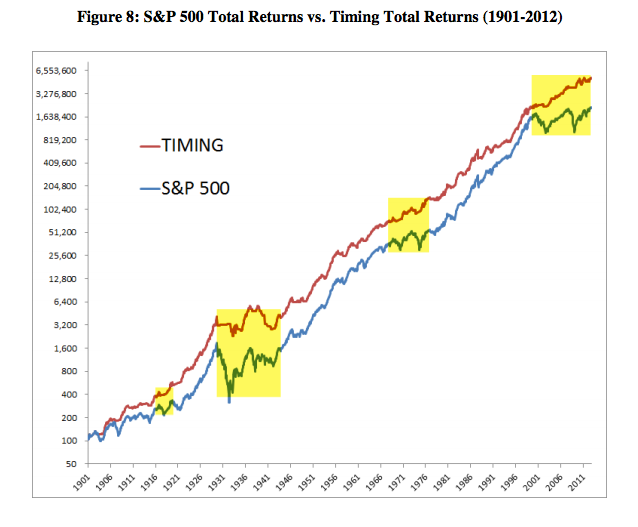
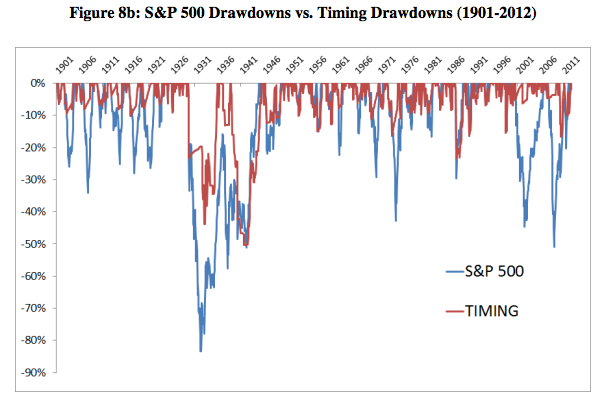
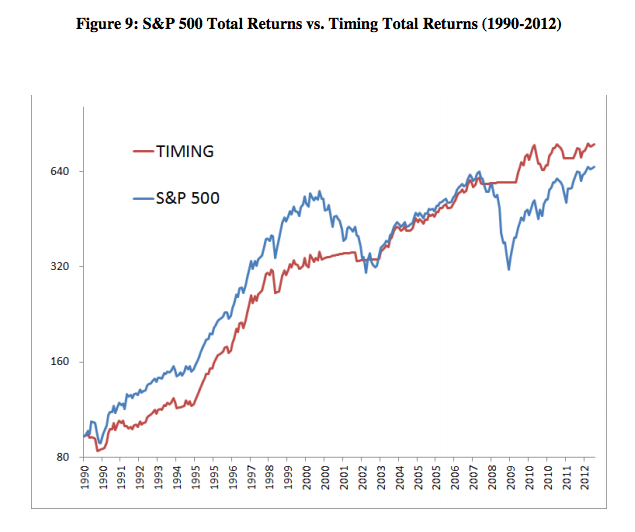
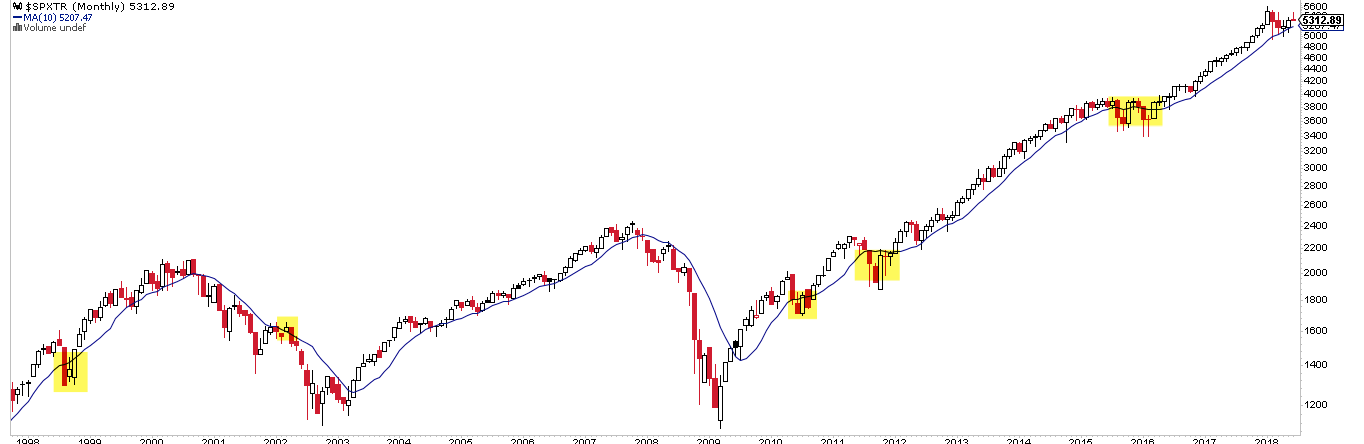
A much simpler trend following strategy using the 10-month moving average from Meb Faber is described here. Briefly, stay long when SPX is above the 10-mma at month end, move to cash when below. There are still drawdowns of more than 15-20% (e.g., 1987, 1990, 1998) and the strategy can underperform in a grinding bull market, but the long term track record is excellent.
Tuning out noise and slavishly following investment rules and hard data through whipsaws up and down is more challenging than it sounds. The disciplined investor would have had to switch sides quickly during high volatility periods in the midst of an uptrend (highlights). This is the "cost" of avoiding drawdowns while trying to ride a trend. But for those that can do it, performance can be in the top 5%, maybe the top 1%.
Another long bear market like those in the 1970's and 2000's is coming, we just don't know when. For all the time spent worrying about this risk, the overwhelming majority of short term traders and professional fund managers haven't found a way to avoid it. And if they have, it has been at the expense of also missing out on the gains during bull markets. If you are going to do better than most, it won't be by continually anticipating a market crash. It will be by tuning out noise and consistently following investment rules and hard data.
© The Fat Pitch
Read more commentaries by The Fat Pitch