Summary: US equities are up three months in a row and positive for the year. Historically, equities have a very strong propensity to end the year higher under these circumstances. That remains our long term view.
Shorter-term, the S&P remains in a 5 month consolidation/trading range. These periods can last 6-12 months. July is a seasonal tailwind, and several sentiment indicators suggest a bias higher (to the top of the range) is warranted. On strength this month, beware; it is followed by the two worst months of the year.
US equities rose for a third month in a row in June. SPX and small caps gained 0.5% and NDX gained 1.1%. The laggard in the US is the Dow, which lost 0.5% in June.
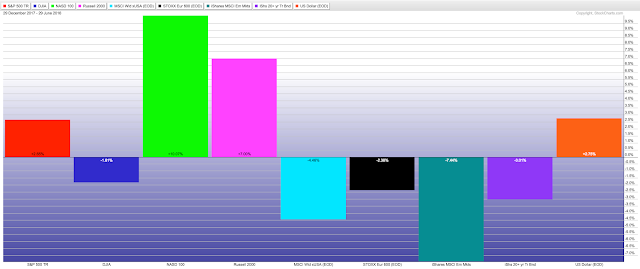
The picture is not much different on YTD basis. At the year's mid-point, SPX is up 2.5%, NDX is up 10% and small caps are up 7%. The Dow is down almost 2%. Part of these results are explained by the upward bias in the dollar, which favors domestic-focused small caps relative to internationally-weighted large caps. Enlarge any chart by clicking on it.

Note how the US is easily outperforming the rest of the world. Europe and Japan are down 2.4% and emerging markets are down 7.4%. This is despite the fact that the US Fed has been engaged in Quantitive Tightening (QT) while the central banks in Europe and Japan are still easing. This is not a surprising outcome (a post on this is here).
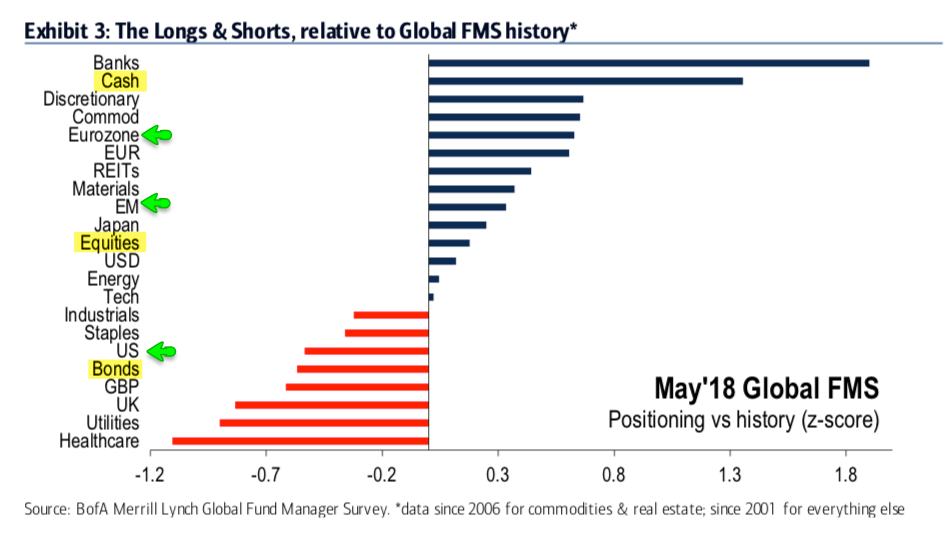
The outperformance of US shares relative to the rest of the world is also notable because fund managers have been consistently underweight the US and overweight Europe, Japan and emerging markets over most of the past year. Under these conditions, US shares have reliably outperformed and the other regions have underperformed. Read why this was predictable (and expected) here.
Our longer term view remains that US equities are in a bull market and that new highs (ATH) lie ahead in 2018. In fact, the Nasdaq and the small cap indices were at new ATHs just two weeks ago (June 20th).
Shorter term, US large caps remain in a consolidation phase following the persistent grind higher in 2017. We discussed this several months ago. Extremes in momentum, volatility and sentiment from January are probably resetting before equities continue higher. This has been a repeating pattern during this (and every) bull market, with the time between new highs ranging from 30-50 weeks. The current consolidation feels interminable, but has been "just" 22 weeks. This could continue through the summer but should ultimately resolve higher.
The closest parallel to 2017 is 1995; in both cases, markets ground higher with the maximum intra-year correction being a scant 3%. 1996 started with a 9% gain in January (versus 7% in 2018); between February and September 1996 (30 weeks), equities chopped in a range and consolidated gains before resuming the trend in the 4th quarter. That same pattern could well repeat this year.
Nominally, equities are being held back by continuing trade ware rhetoric. Equities have looked poised to continue higher, only to be jammed by escalating trade demands and retaliation. It's hard to see large caps moving higher until this war of words ends. If this is a pre-election strategy, then stocks will likely remain rangebound for several months.
The FOMC also raised rates in mid-June. We expected this to negatively impact stocks, and it did. Aside from the rate hike in December (which came as the "tax reform" bill was passed), stocks have sold off following every rate hike since the tightening process started in 2015. The long term trend higher in equities (and yields) likely prevails.
Recall that since 1980, the high in equities (NYSE) has come after the last rate hike. Why? Because rising rates indicate an economy that is strong, with expanding growth, incomes, consumption and profits. Under these circumstances, equities should rise.
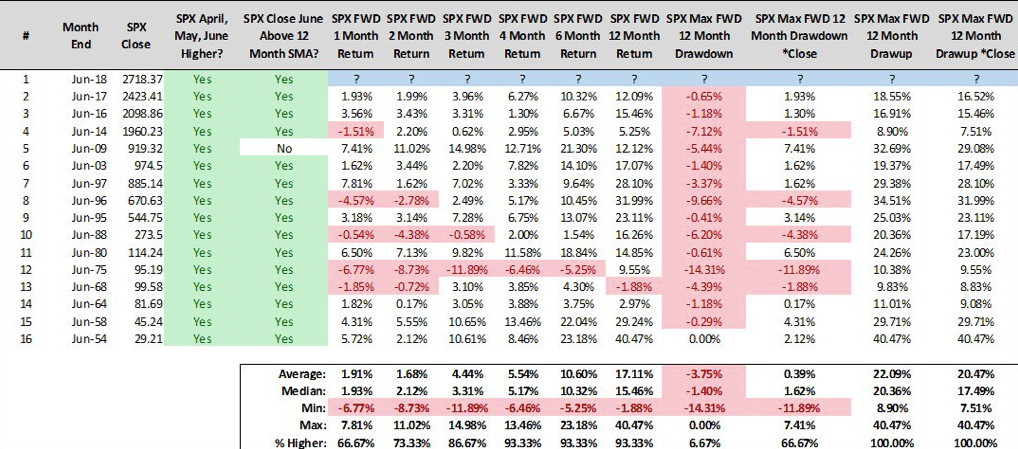
Despite all of this, SPX has risen 3 months in a row, every month of 2Q. Historically, when stocks rise during this period, they have risen the next 4, 6 and 12 months in 14 of 15 instances (93%). Risk/reward over the next 12 months has been highly favorable (from Steve Deppe, here).
It's true that the Dow has lagged the other indices. This week, it even suffered a "Death Cross", where its 50-d crossed under its 200-d. This means that trading over the past two months is weaker than over the prior 9 months. Is this as bearish as the name implies? No; forward performance is mostly inline with anytime returns for the Dow, and 6-month returns are even a bit better than normal. In other words, the Death Cross tends to mark a shakeout (from Mark Hulbert).
Sentiment indicators had been showing excessive bulls in early June, one reason we expected stocks to retreat (here). But trade tensions (and the ongoing choppy consolidation) has recently delivered a hit to sentiment.
Last week, equity mutual fund and ETF fund outflows were a massive $20b, one the largest of this bull market. These have typically come near at least short term lows in SPX (arrows indicate outflows greater than $15b). The last large outflow occurred the first week in February, which marked the low for SPX so far in 2018 (from Lipper).
(The chart above excludes outflows in December as there is a predictable rebalance at the end of every year. No such bias exists during other month- or quarter-ends).
Fund flows peaked with the indices in January. This looked like a bullish peak in sentiment. Since then, fund flows have been consistently negative. Extended trading ranges have the effect of wearing out market participants (from ICI).
The Advisor and Investor Model (AIM) from Sentimentrader, which combines sentiment survey data from several sources, is likewise indicating bearish sentiment. It can become more extreme, but low readings like now have come near at least short term lows in equities (from Sentimentrader; to become a subscriber (and support the Fat Pitch), click here).
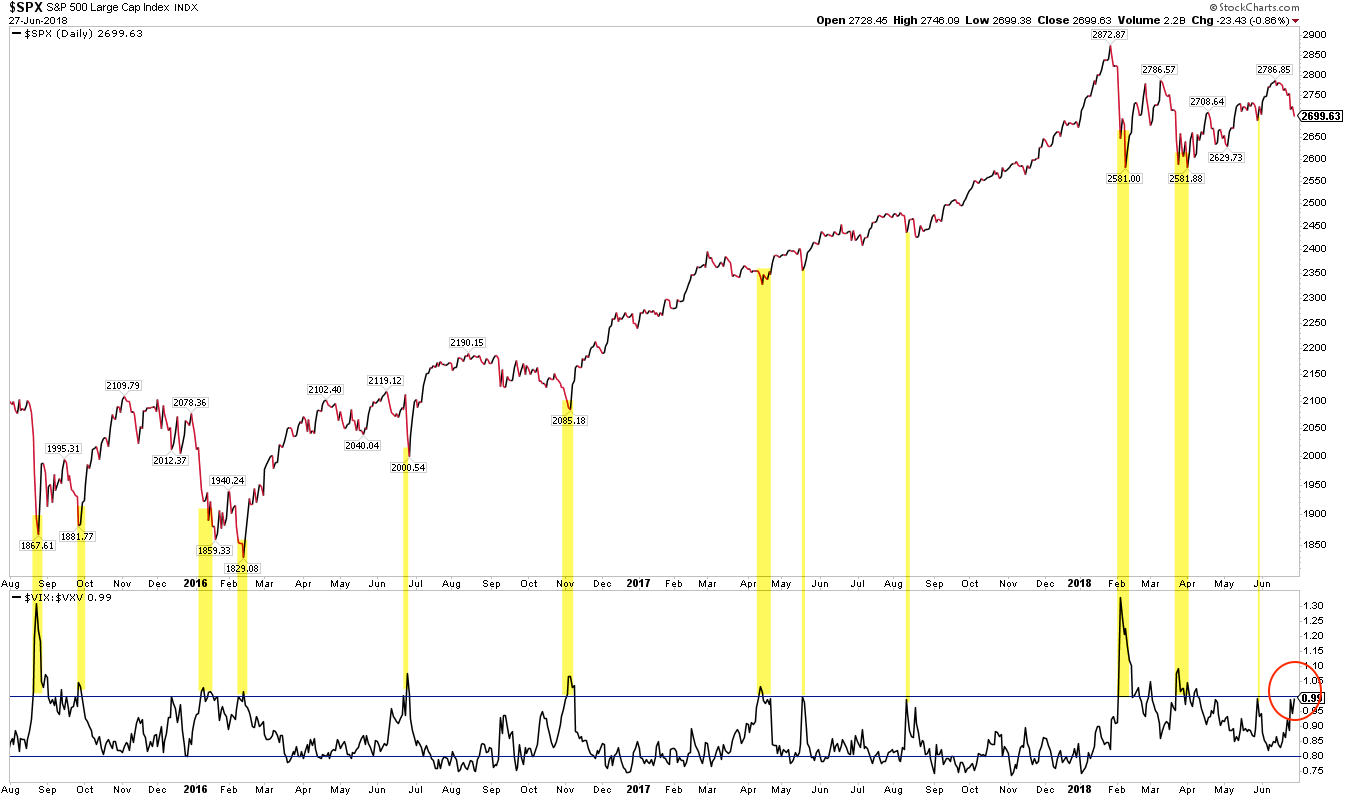
Moreover, the term structure of volatility also spiked higher in the past week. Volatility did not cross into backwardation, but it came very close. That too has mostly come near short term equity lows.
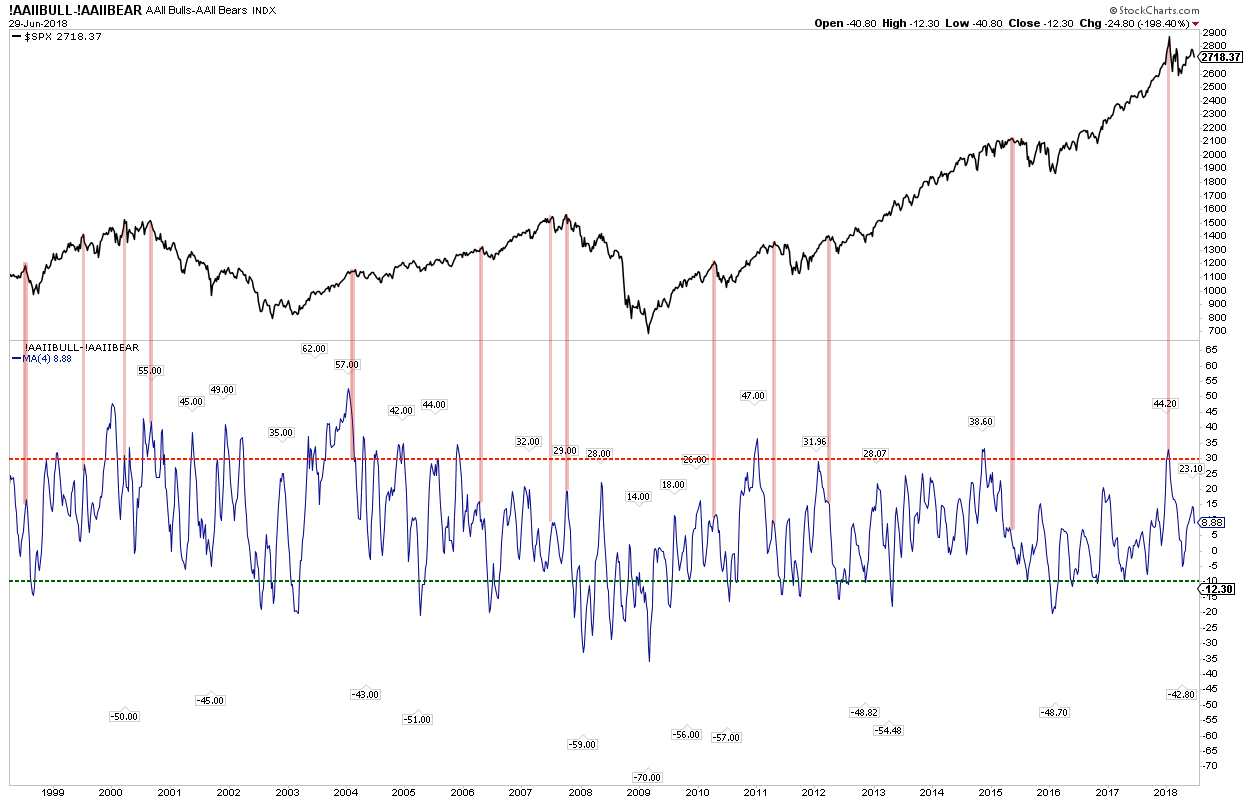
To be fair, not all indicators support a short term low in equities. Put/call ratios show that investors are mostly positioned for gains. The 4-week AAII survey of individual investors is also, at best, neutral.
July trading starts this week. July tends to be the bright spot of the summer. On strength this month, beware; it is followed by the two worst months of the year. A September low is also typical during mid-term election years (from Bianco).
The first week of July is biased higher. In particular, the 7 days before and after the Independence holiday (on Wednesday) tend to be strong (Monday is Day -2; from Sentimentrader).
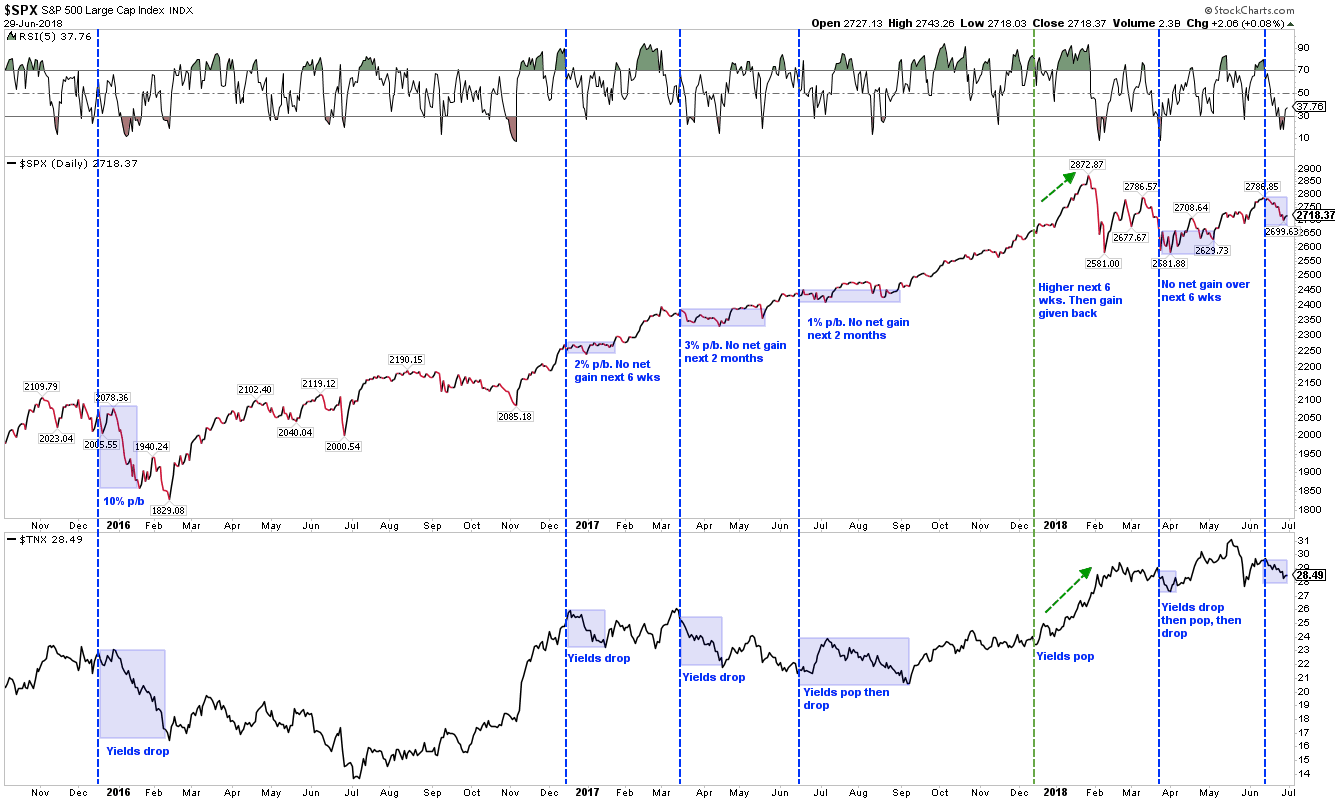
For SPX, 2800 (top blue line) remains the high end of the 5-month range, a level it has twice tried and failed to breach since February. On strength, that level is near this week's WR2. Holding support in the 2680-2700 area is key short term (yellow line); that is now the 2-month support level and is near this week's WS1. If it fails, a full retest of the February and April lows is odds on.
In the chart above, note that the index was "oversold" this past week (top panel); the bias has been higher following these periods over the past year.
Also note that SPX has fallen two weeks in a row to end the month of June. SPX has not fallen three weeks in a row since June 2016. The 20-wma at 2700 (blue line and arrows) has been successfully defended since April. SPX has a strong tendency to trend higher above this moving average but to be choppy and corrective below it, another reason to beware a fall below that level.
This week: Independence Day on Wednesday and monthly NFP on Friday.
In summary, US equities are up three months in a row and positive for the year. Historically, equities have a very strong propensity to end the year higher under these circumstances. That remains our long term view. Shorter-term, the S&P remains in a 5 month consolidation/trading range. These periods can last 6-12 months. July is a seasonal tailwind, and several sentiment indicators suggest a bias higher (to the top of the range) is warranted. On strength this month, beware; it is followed by the two worst months of the year.
© The Fat Pitch
Read more commentaries by The Fat Pitch