Market signals have been decidedly mixed thus far into the year. By this time a year ago, the S&P 500 had already returned 5%. Today, in early May, the S&P 500 is down fractionally, while volatility and bond yields are up. We’ve been telling our clients for some time to expect a return to normalcy (i.e. higher market volatility), so we hope this year’s 10% correction in February, subsequent recovery, and then 7% correction in March hasn’t unnerved anyone too much.
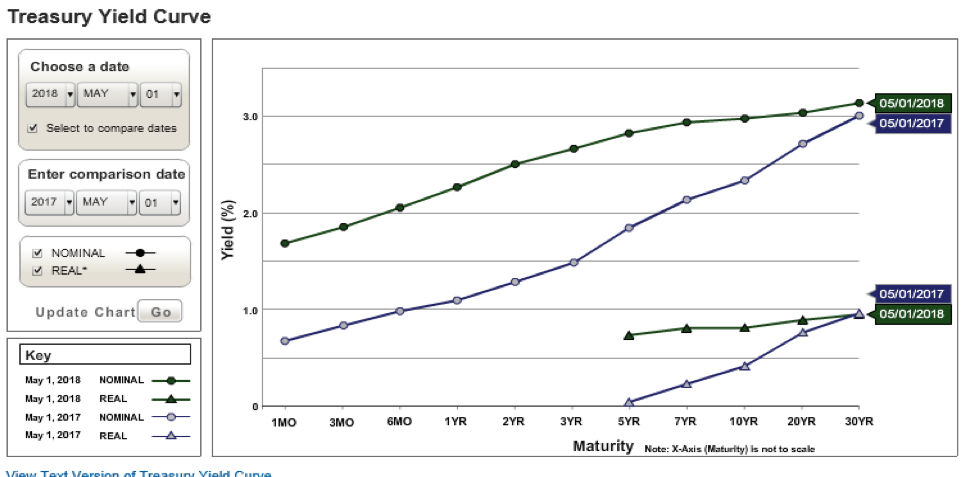
Cross-currents of concern have been in the air and on the airwaves much of the last few months. On the one hand, given the recent fiscal stimulus of tax-cuts and the resulting significant earnings upgrades, many feel puzzled as to why the markets haven’t advanced steadily this year. On the other hand, the Fed has hiked short-term interest rates 4 times in the last year, and yet the longer-term bond yields have seemed largely immune for most of this period. This has produced a flattened term structure of interest rates, also known as the yield curve. Below is a depiction of the curve a year ago (blue) and today (green) from the Treasury’s interactive website.

A “flat” yield curve is a theoretical concern because longer term bond yields are typically thought of as good predictors of future financial conditions. Logically, one would expect significantly more compensation for the risk of making a thirty-year loan versus making a ten-year loan. Yet today, the ten-year Treasury yield stands at 2.97%, while the thirty-year yield is only 3.13%. The spread between the 2-year and 10-year Treasury rates is the narrowest it has been in over a decade. Short term rates have risen far faster than long-term yields, leading some to worry about an eventually “inverted” yield curve, whereby longer-term rates are lower than nearer term rates. John Williams, the new President of the Federal Reserve Bank of New York recently called inverted yield curves a “powerful signal of recessions”. There is an additional complicating fact for the market: the yield on the two-year Treasury is now higher than the yield on the S&P 500 for the first time in eleven years. This provides a choice for a segment of investors seeking yield without stock market volatility, which could imply an incrementally lower demand for stocks.
We recently sat down with Dan Ivascyn, Managing Director and Chief Investment Officer of PIMCO and posed the yield curve question to him. While he agreed that an inversion of the curve would be a bad portent, his view on the stubborn long-end rate was that it was at least in part due to the scarcity of high quality long-term assets. “Asset Liability” managers (primarily pension, bank, and life insurance investment portfolios) have high demand for long-dated, high quality bonds. We know the Fed’s balance sheet has tied up trillions of these bonds. This supply/demand imbalance has kept long-term yields low, even as the Fed has pushed the short-end up. Ultimately, Mr. Ivascyn insisted a flat year curve could last a long time—though he doesn’t rule out a parallel shift upward in rates across all maturities.
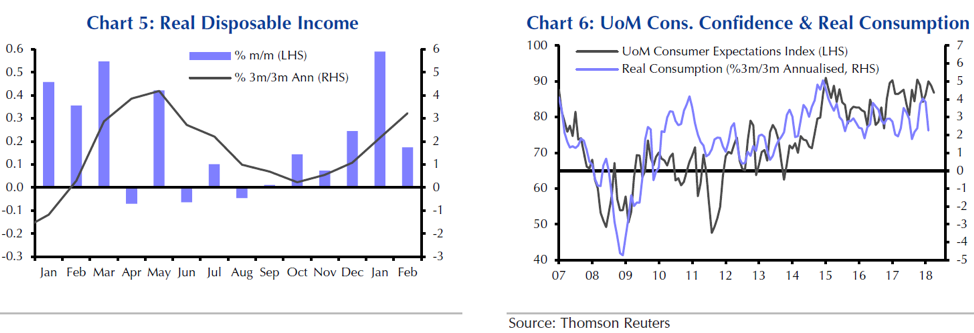
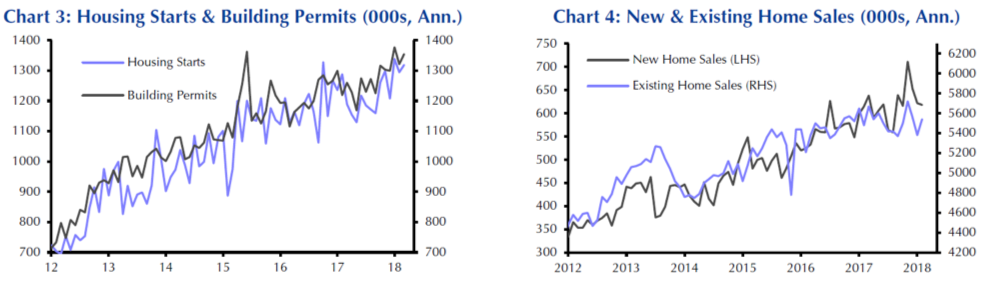
Back to the bright side. Disposable income has been rising, as has consumer confidence. Consumer confidence is closely correlated with consumption, which is responsible for roughly two-thirds of GDP. Housing starts, building permits and oil prices have all been firm—all indicators of a healthy, growing economy.
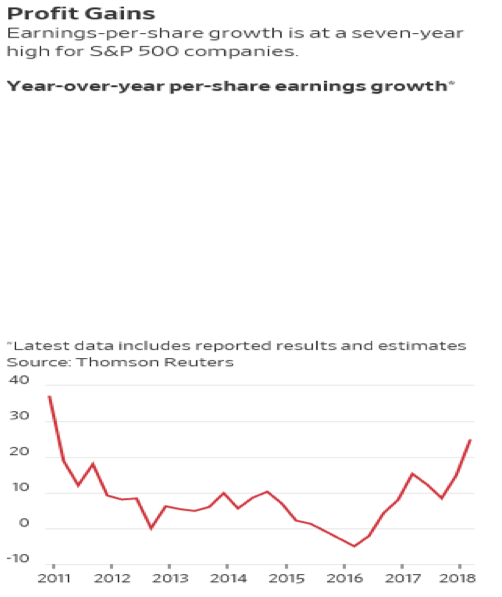
Today we are reminded of the glum outlooks we wrote about last year which seemed to permeate the start of 2017, whether it is pessimism surrounding stock valuations, the term “peak earnings” which has recently been added to the narrative, inverted yield curves and “late market cycle” references. Add a dose of long-absent market volatility, and it’s enough to slip into despair!
To pick your spirits up, do this: download and read the 1Q 2018 Earnings Release from Caterpillar Inc. (CAT). Caterpillar is one of America’s most stalwart industrial companies. Positioned globally as a major player in the infrastructure space, they stand to directly benefit from growth—but could also be seen as the “canary in the coal mine” when global growth falters. Please find an excerpt below (emphasis added).
In January, Caterpillar provided a 2018 outlook range of $7.75 to $8.75 per share. The company is increasing its 2018 profit outlook by $2.00 per share to a range of $9.75 to $10.75 per share, primarily due to growing demand for products and services….”Based on our strong first-quarter results and higher demand across all regions and most end markets, we are raising our outlook for 2018…” said [CEO Jim] Umpleby.
…The company expects broad-based growth in all regions in 2018, with the biggest drivers being continued strength for construction activity in North America and infrastructure development in China.
That’s a 24% increase in profit projections for the year! As we monitor the earnings releases and calls after Q1, comments like these from actual practitioners of business growth are where the focus should be, rather than hand-wringing over theoretical end-of-cycle scenarios.
Of course, Caterpillar is not the only highlight of this earnings season. Boeing, Amazon, and yes—even Facebook have all reported and affirmed forecasts of remarkable earnings growth. According a recent Wall Street Journal Analysis, this has been the best earnings quarter since 2011, largely due to the decline in corporate tax rates. Most of these companies, however, have not been rewarded in the market for their upside earnings surprises. Our impression is that as investors, we were served the sizzle long before the steak arrived. However, we must remain focused on the steak. As we pointed out in our last Outlook, tax cuts represent just a one-time stimulus.
Putting Volatility into Context:
Some complained when stock prices were higher, the market was too expensive. We have discussed the P/E ratio frequently in recent Outlooks, so we won’t do it again, except to point out that not only has the P dropped with the market correction, but the E has risen because of tax-cuts and the improved outlook just highlighted by Caterpillar, above. According to Goldman Sachs research, while US and major developed market valuations were at or near the 100th percentile at the end of 2017, as of the end of March 31st these percentiles have dropped to 40%-60%, depending on the market (the US is in the 70th percentile).
Clearly the equity markets around the world look much more attractive on a valuation basis today than they did just four months ago. We think the valuation concern as it pertains to equities should be taken off the table.
Fixed Income:
Unfortunately, we remain more cautious on bond valuations than on equity valuations (no doubt a familiar refrain to readers). Our long-held forecast for the Bloomberg Barclay’s Aggregate Bond Index has been 0%-2%. Year to date this index is down 2.42%. With at least two, and possibly three more interest rate hikes by the Fed this year to come, it looks like it will be quite a challenge to even achieve the lower end of our target range. The Fed will be challenged this year by the twin forces of full employment and rising inflation.
CCR Wealth Management was active early in Q1 management of our bond portfolios. Our strategy has included further diversification into municipal bonds (where tax-appropriate for clients), which tend to exhibit less interest rate-associated volatility. In addition, we have shortened the duration of portfolios by adding short, and even ultra-short duration bond funds.
We continue to cite Capital Economics forecast for four rate hikes this year (3 more to go), with the next increase likely in June. At some point, interest rates will have “normalized” enough to play offense. We think this occurrence could happen in the second half of 2019.
Inflation:
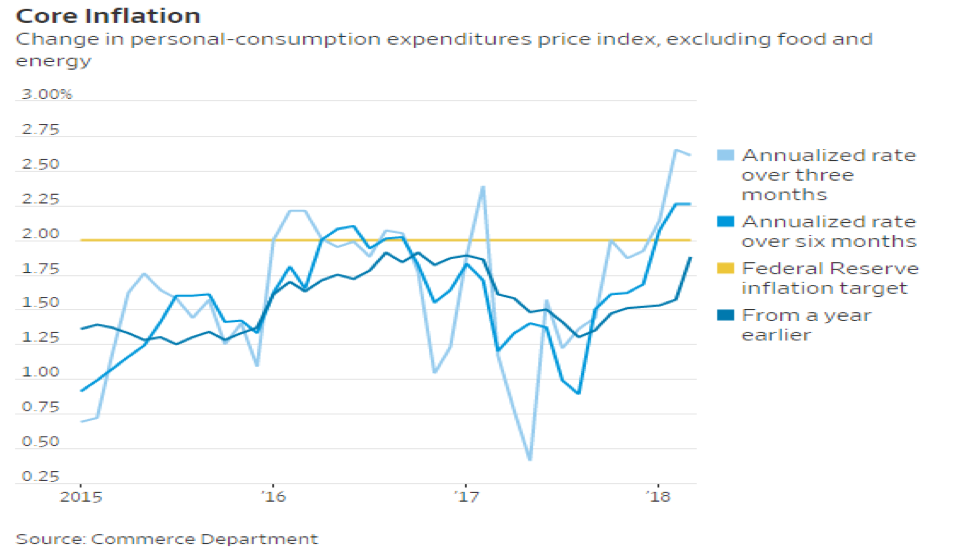
Last quarter we referenced a research paper from Capital Economics titled “Rebound in Inflation Could be the Big Story in 2018”. Well, so far into the year there appear to be two big stories, one of them being inflation. In January, we covered the topics of the Labor Participation Rate, Wage Growth, and the overall tight labor markets. As we write today, the Labor Department just released April’s employment data and the unemployment rate has fallen to 3.9%--the lowest reading since 2000.
It seems likely that the Core inflation rate tracked by the Fed will exceed the Fed’s own target of 2.00%. While a slight overshoot does not strike us as a big economic problem, we think the steady advance of inflation guarantees a steady advance of Fed monetary tightening—which ensures market volatility will persist. In our February webcast, we discussed volatility largely being caused by the market’s outlook for future interest rate levels converging with the Fed’s higher expectations, and that this adjustment, occurring after the January employment data was released, was directly linked to the appearance of long-absent wage growth. In fact, core inflation has advanced as well, snapping back above 2% in March for the first time in a year as a 7% plunge in wireless phone service prices from last March has dropped out of the data set.
The “other” big story of 2018 has been the rise of aggressive tariff rhetoric concerning trade deficits by the administration. We are convinced the rhetorical jousting is a negotiating tactic rather than policy pronouncement, but tariffs are in fact inflationary, as is the $1.3 trillion budget signed by the President in March. Geopolitical tensions, particularly with Russia in and out of the Gulf area are also inflationary.
In our last outlook we declared that while we expected rising inflation on the margin, our concerns were largely confined to their effect on the bond markets, and that we had no plans to add “hard assets” like commodities to our models. Well, these developments have changed our thinking and in fact CCR Wealth management has added a 5% allocation to a broad-based commodity strategy to our portfolios.
It should be noted that we are still not expecting run-away commodity prices. Most broad commodity indexes are trade-weighted in US dollars, meaning that they are generally energy-heavy. US technological advancement in energy extraction over the last fifteen years actually has a deflationary effect on the price of oil and natural gas. The US can now quickly adjust rig-counts to react to supply/demand changes. Nevertheless, with OPEC holding fast on production, we think prices will remain firm. The ultimate benefit of adding commodities to our models at this stage is their low correlation to both stocks and bonds, furthering the cause of maximum diversification.
The views are those of CCR Wealth Management LLC and should not be construed as specific investment advice. Investments in securities do not offer a fixed rate of return. Principal, yield and/or share price will fluctuate with changes in market conditions and, when sold or redeemed, you may receive more or less than originally invested. All information is believed to be from reliable sources; however, we make no representation as to its completeness or accuracy. Investors cannot directly invest in indices. Past performance does not guarantee future results. Securities offered through Cetera Advisors LLC. Registered Broker/Dealer, Member FINRA/SIPC. Investment Advisor Representative, CCR Wealth Management, LLC. Registered Investment Advisor. Cetera Advisors LLC and CCR Wealth Management, LLC are not affiliated companies. Cetera Advisors LLC does not offer tax or legal advice. CCR Wealth Management 1800 W. Park Drive, Ste 150, Westborough, MA 01581. PH 508-475-3880
© CCR Wealth Management, LLC
Read more commentaries by CCR Wealth Management