Stocks Settle In As Interest Rate Questions Loom
by Joe Becker of Milliman FRM,
Learn more about this firm
Stocks Settle In As Interest Rate Questions Loom
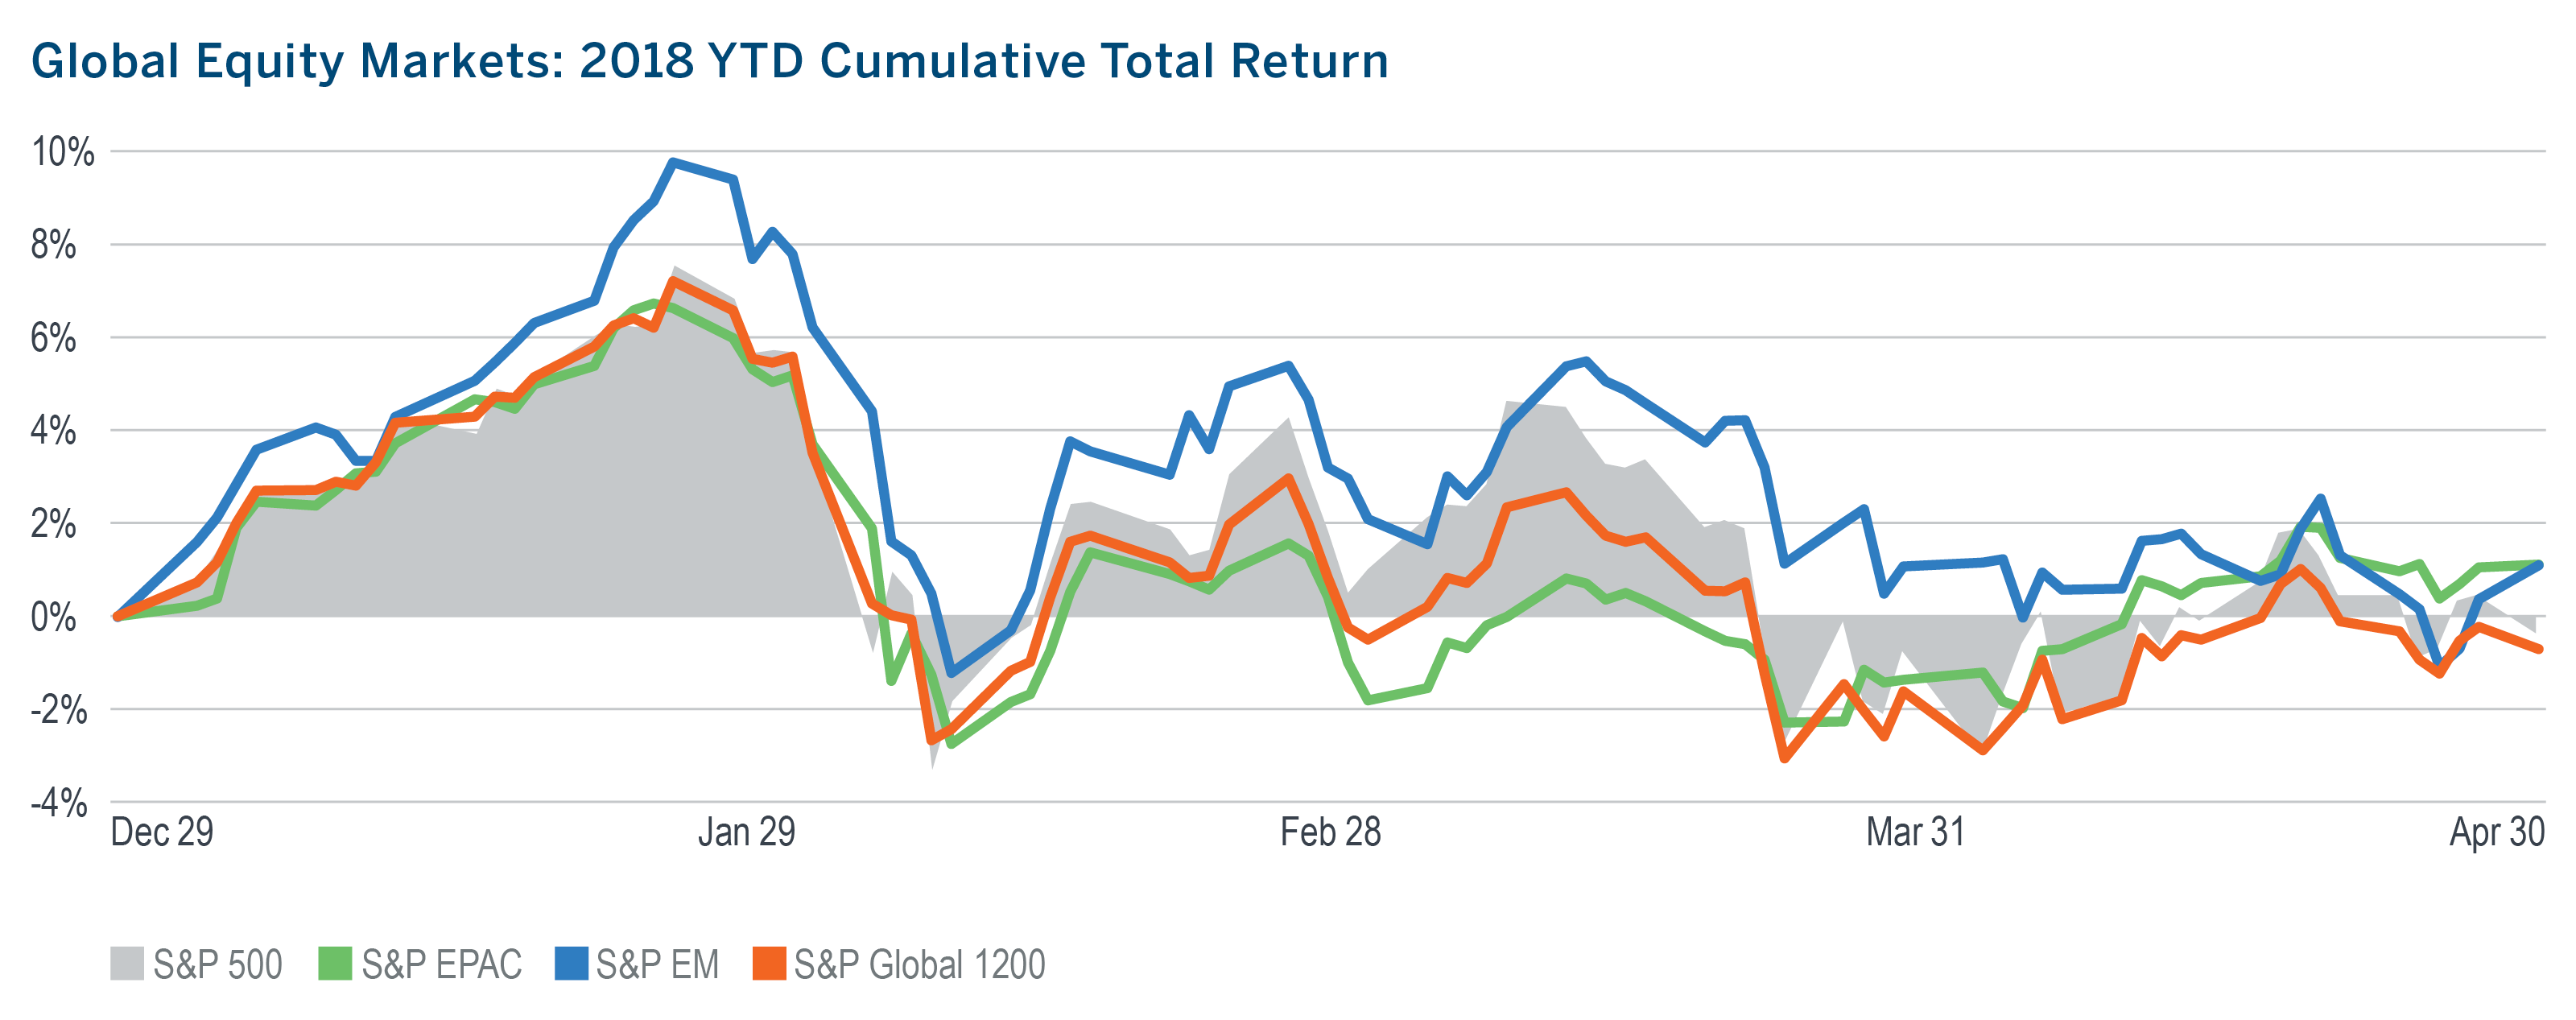
- After two consecutive months of market tumult (comparatively speaking) and negative returns, the S&P 500 in April exhibited greater calm and eked out a positive return.
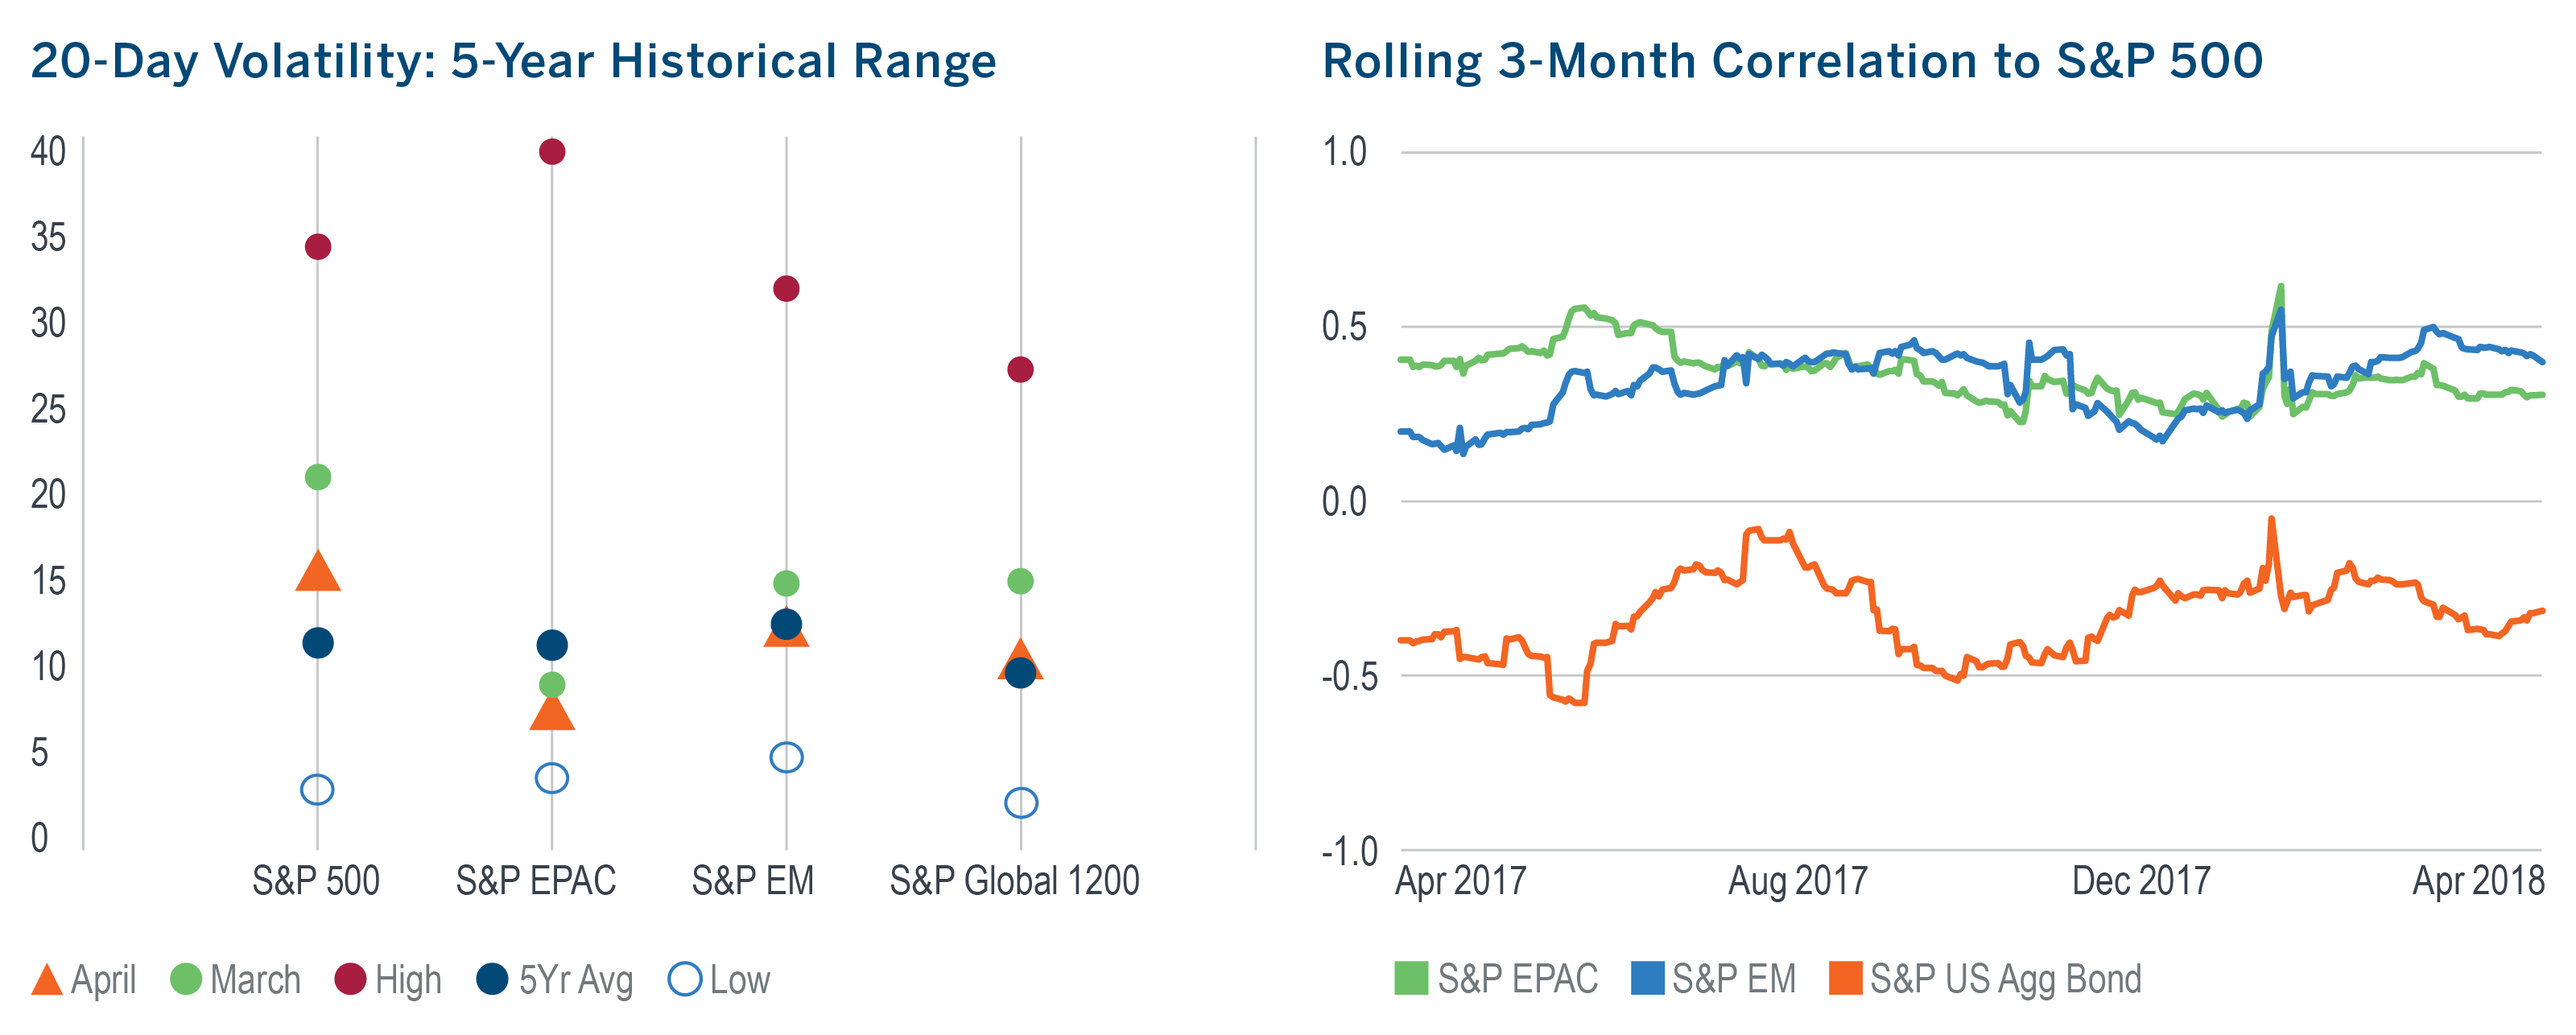
- Volatility was lower in April than it was in March and closer to its five year average across each of the major segments of the global equity market.
- Unlike 2017, markets in post-January 2018 have been much less decisive. On the one hand, strong global economic growth and pro-growth tax cuts are reasons for optimism. On the other, trade-tariff wars and rising interest rates are undermining investor confidence about potential future earnings growth.
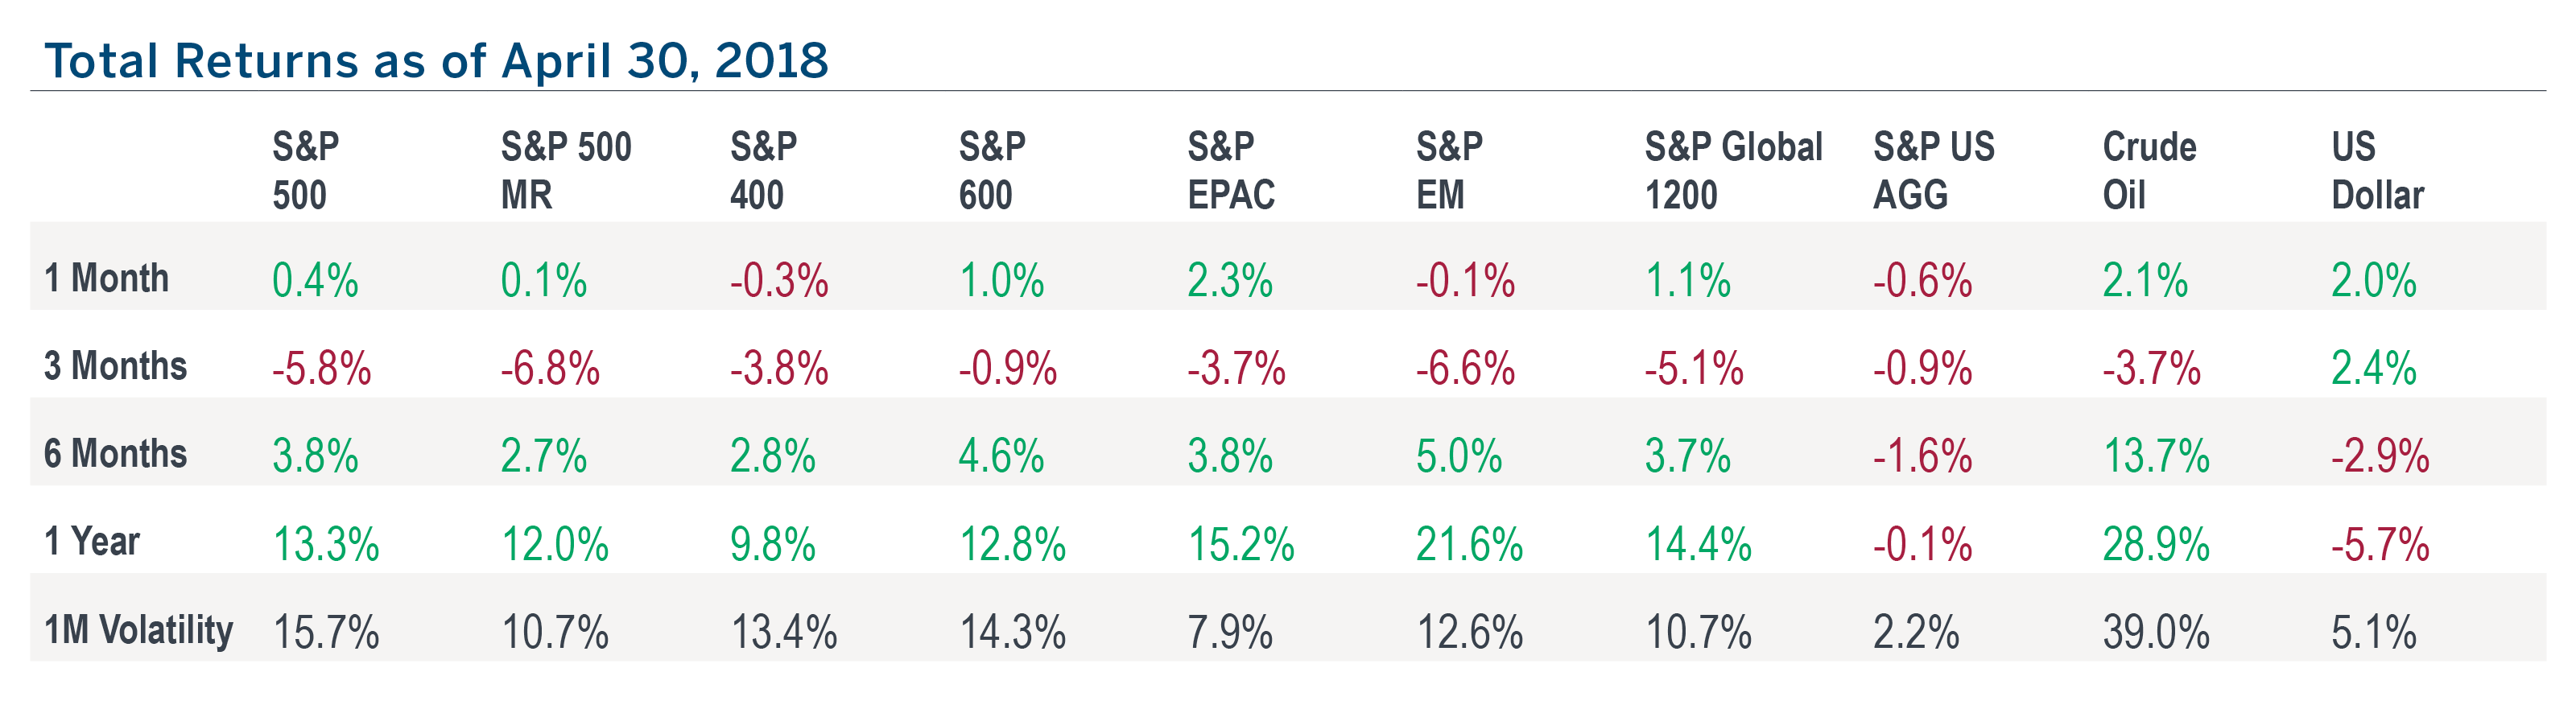
- The US dollar broke upward out of its three-month range, creating a headwind and potentially higher volatility for non-US equities.
- Correlations between major equity market segments were little changed in April. The correlation between US stocks and bonds, however, edged higher as rising interest rates and widening credit spreads weighed on bond market returns.
Managed Risk Investing
- In spite of markets growing calmer from March to April, the S&P 500 Managed Risk Index, which has an 18% volatility threshold and no fixed allocation to bonds, maintained a hedge position throughout the month.
- Having begun April at a 67% equity allocation, the index gradually increased its equity exposure to 81% by month end.
- Its hedge position helped it be less volatile than a 70/30 blend* with a marginally higher return.
- Over the last 10 years, the Managed Risk Index has exhibited virtually the same average monthly volatility as a 70/30 blend*, while generating an average excess monthly return of 20 bps.
- YoY CPI and PCE both edged higher for the second consecutive month while the unemployment rate dropped, giving the Fed more ammo to raise rates.
- Notwithstanding a rising US dollar, developed international equities led the global equity market higher, bringing them back into positive year-to-date territory.
- Up 9.3% for the month, energy led all sectors by a wide margin, as the outlook for strong global growth pushes oil demand projections higher.
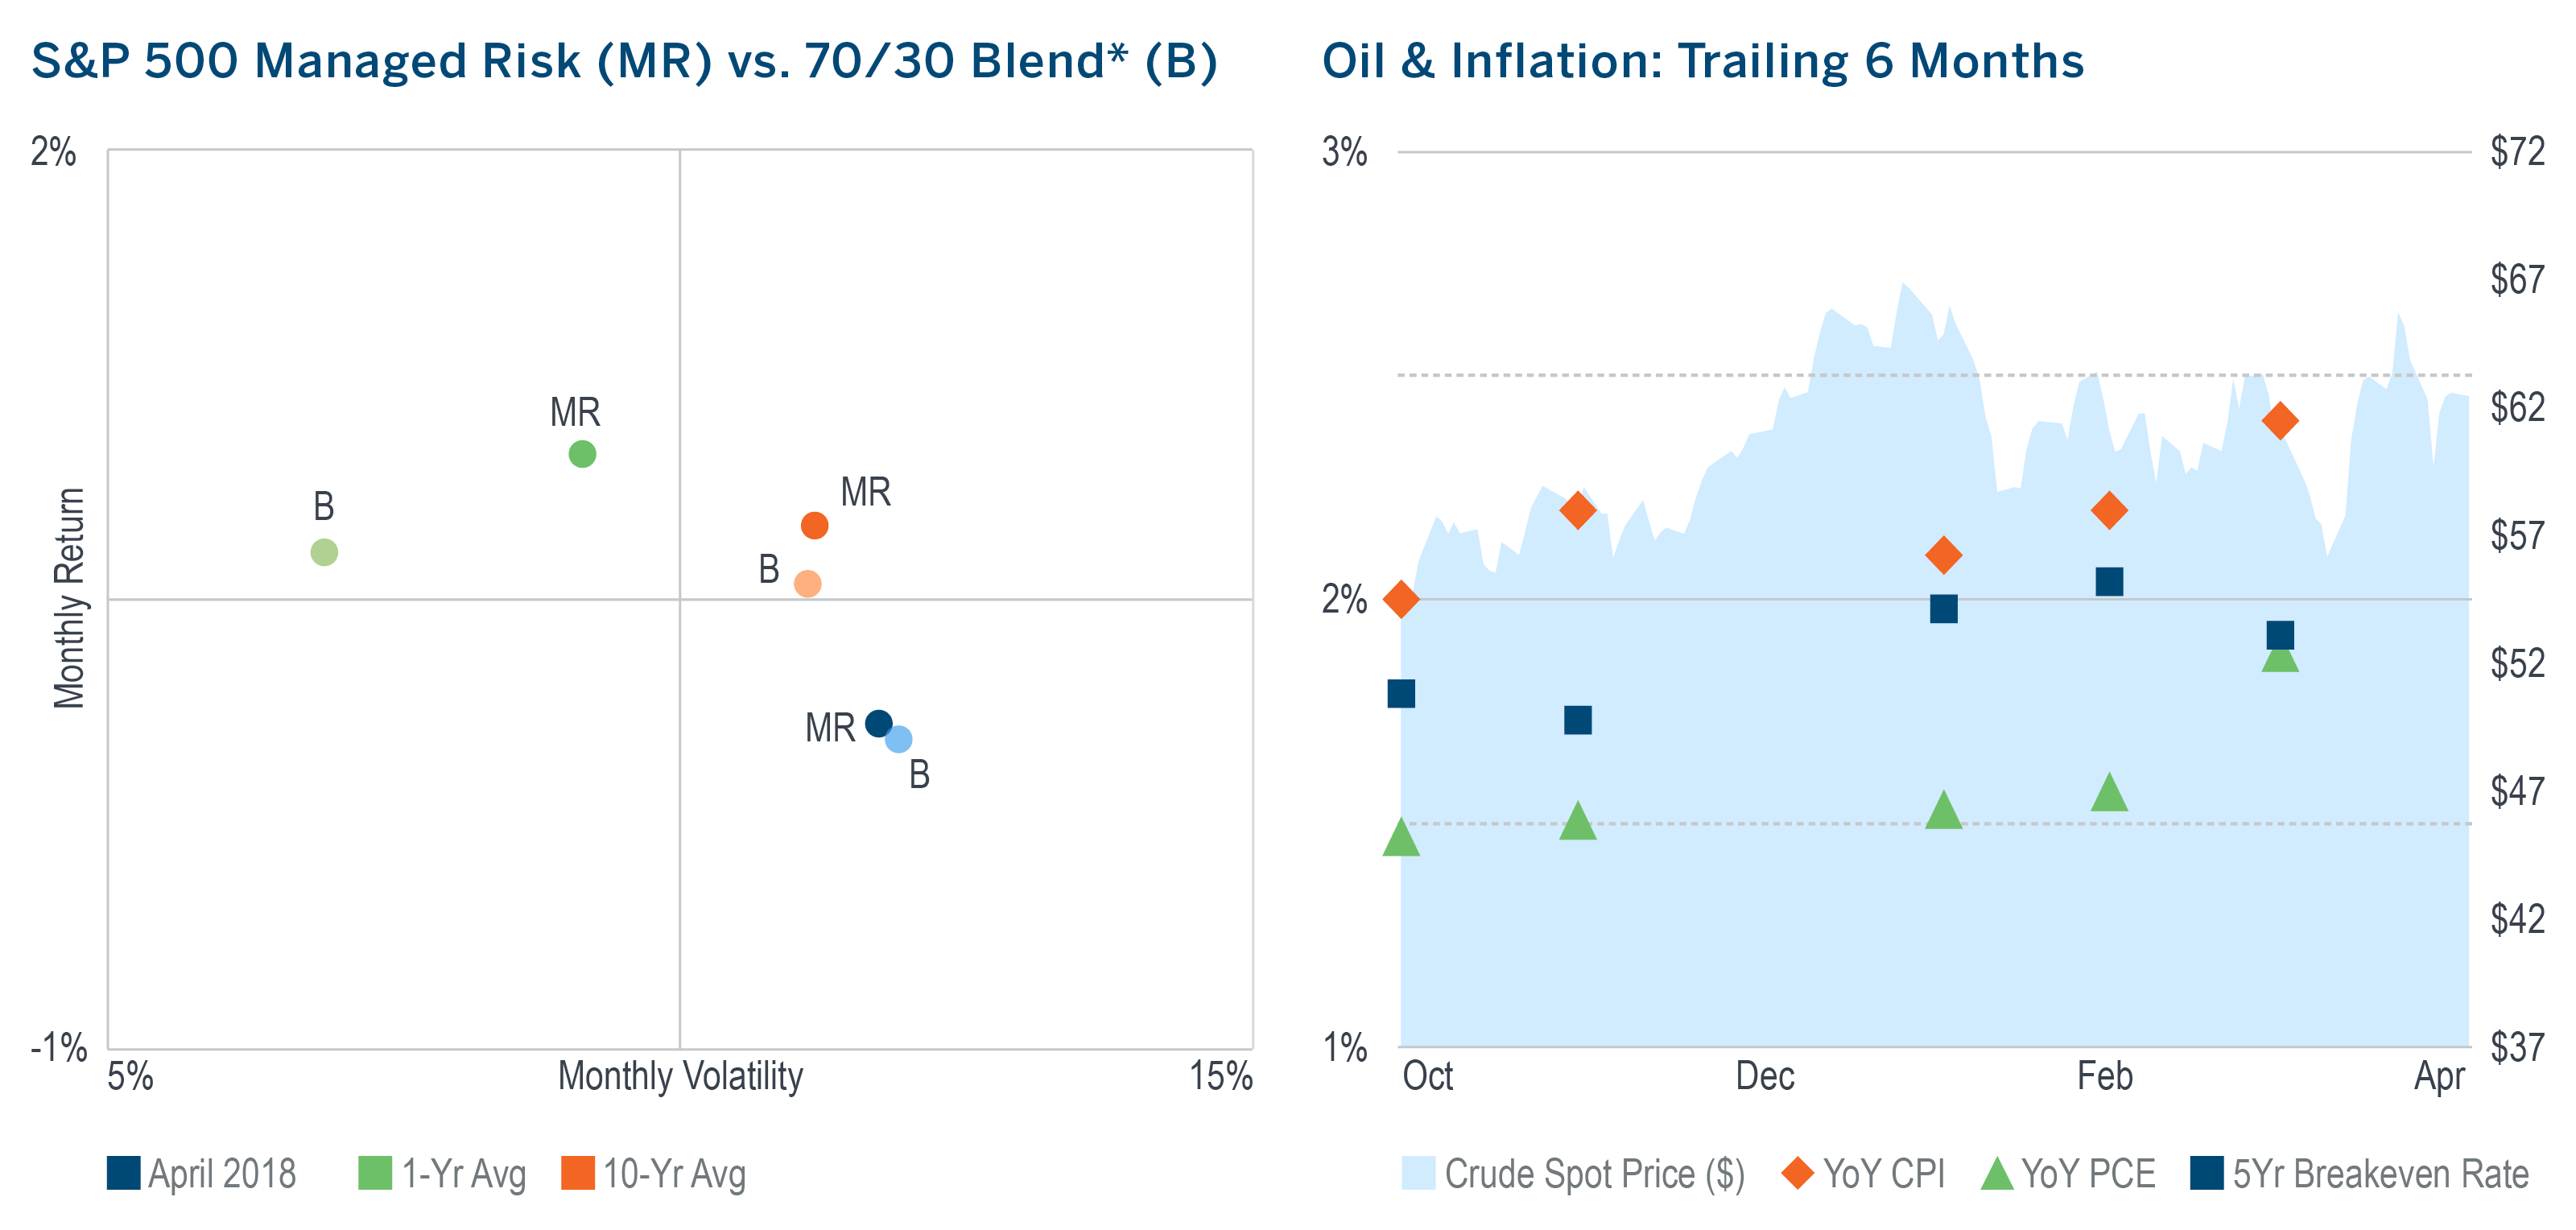
*As measured by the S&P 500 Index and the S&P US Aggregate Bond Index.
Upward Pressure On Rates Is Mounting
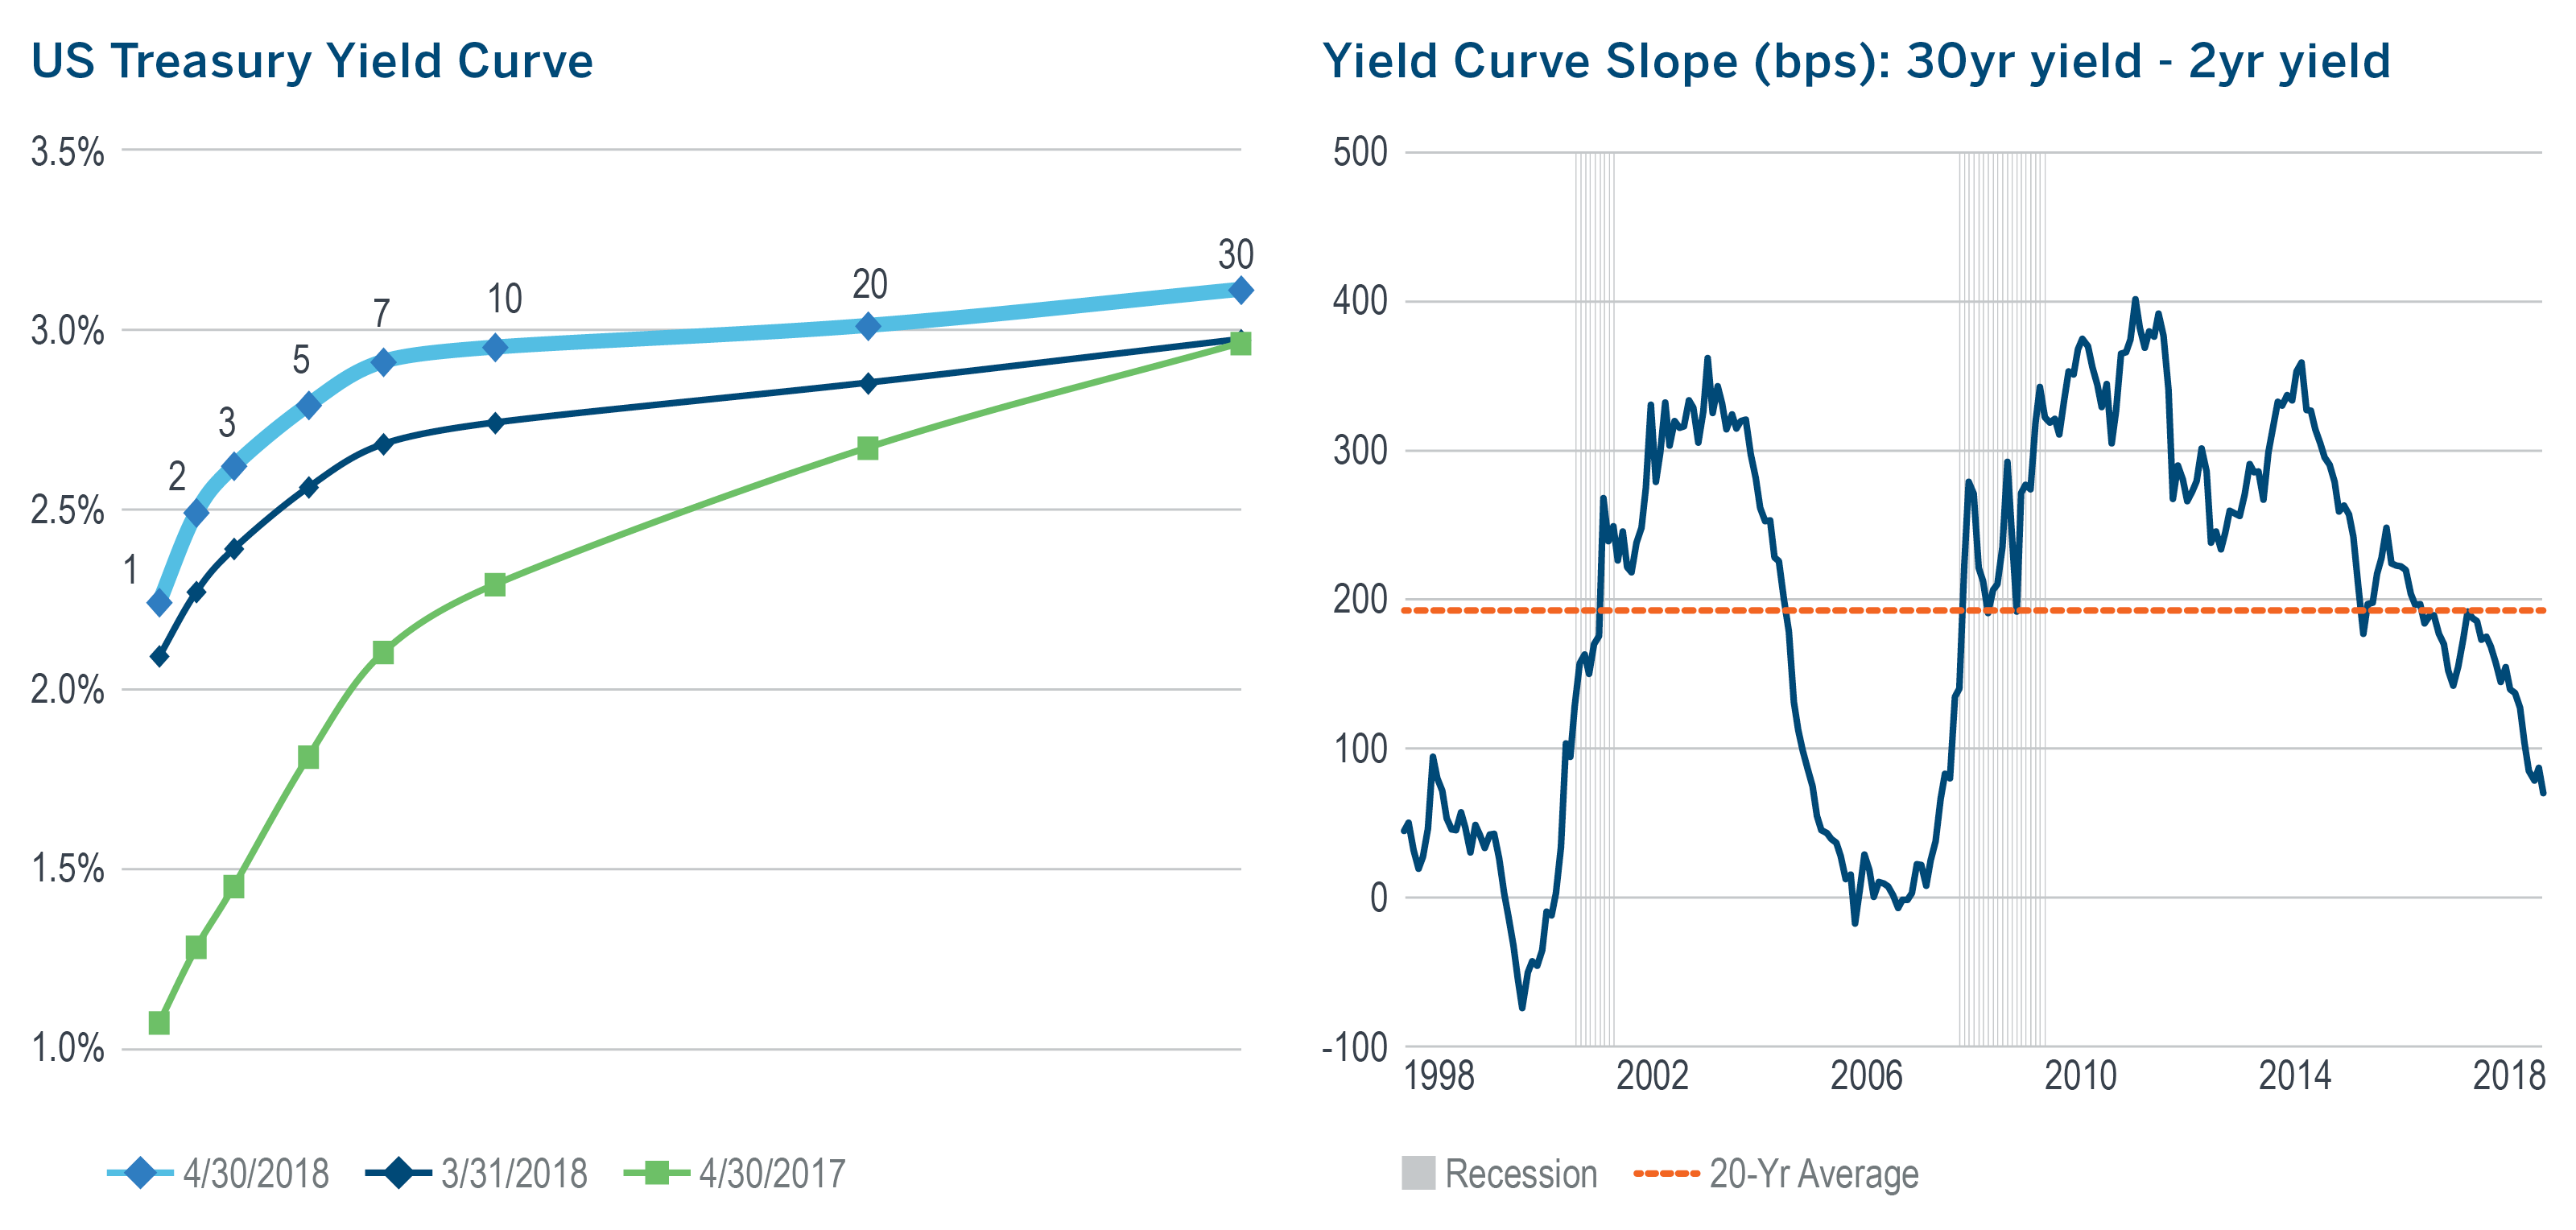
- Rates across the yield curve moved higher in April, with the 10-year yield breaking above 3% and touching its highest level since the end of 2013.
- The rise in the curve was accompanied by more flattening, pushing it to its lowest month-end slope in nearly 11 years and further confounding investors’ outlook for strong growth.
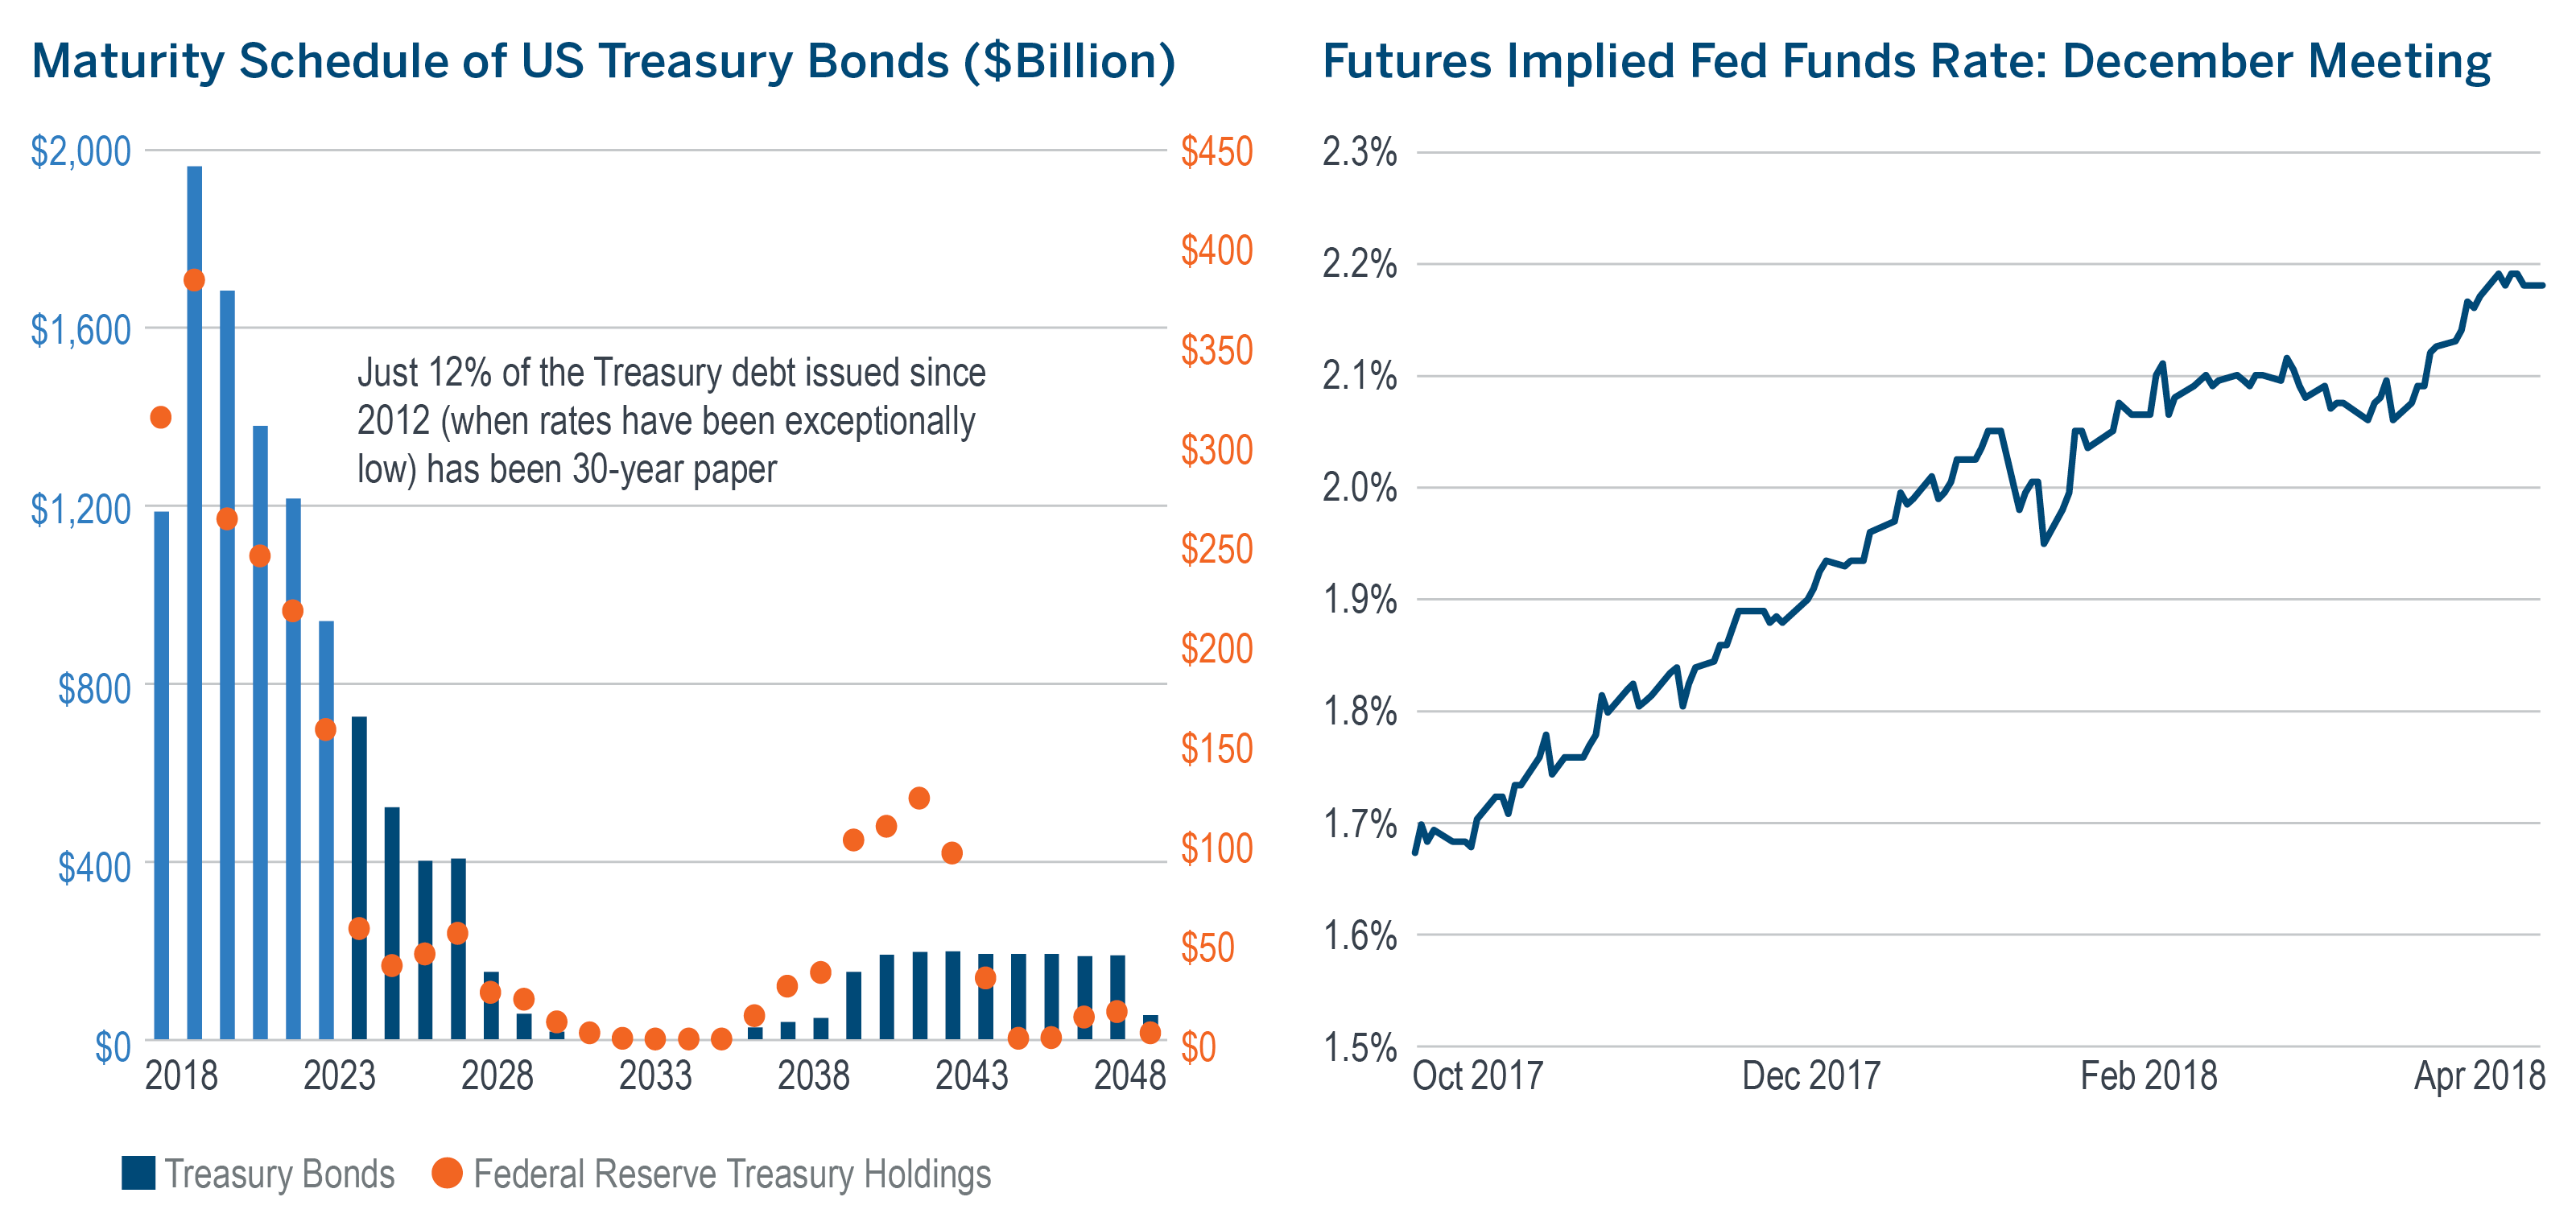
- For US taxpayers, the rise in interest rates is coming at a less-than-ideal time. A look at the maturity schedule of the $12.8 trillion in publicly-held outstanding Treasury bonds reveals that fully two-thirds is set to mature by the end of 2023.
- This group of bonds was issued with a weighted average maturity of 6.6 years and coupon of 1.86%. As of the end of April, the yield on a six-year Treasury bond was 2.9%, 100 bps higher.
- The Congressional Budget Office is projecting higher budget deficits in the years ahead, meaning additional debt will likely need to be issued on top of the large amounts already being refinanced.
- This is happening just as the Fed is raising its overnight rate and becoming a smaller source of Treasury bond demand by reinvesting increasingly less of its maturing Treasury holdings.
- Rising rates effectively raise the bar for required equity returns, which may well be expected to result in higher equity market volatility.
Download pdf here
Recipients must make their own independent decisions regarding any strategies or securities or financial instruments mentioned herein.
The products or services described or referenced herein may not be suitable or appropriate for the recipient. Many of the products and services described or referenced herein involve significant risks, and the recipient should not make any decision or enter into any transaction unless the recipient has fully understood all such risks and has independently determined that such decisions or transactions are appropriate for the recipient.
Past performance is not indicative of future results. Index performance information is for illustrative purposes only, does not represent the performance of any actual investment or portfolio, and should not be viewed as a recommendation to buy/sell. It is not possible to invest directly in an index. Any hypothetical, backtested data illustrated herein is for illustrative purposes only, and is not representative of any investment or product.
Any discussion of risks contained herein with respect to any product or service should not be considered a disclosure of all risks or a complete discussion of the risks involved.
The recipient should not construe any of the material contained herein as investment, hedging, trading, legal, regulatory, tax, accounting or other advice. The recipient should not act on any information in this document without consulting its investment, hedging, trading, legal, regulatory, tax, accounting and other advisors.
The materials in this document represent the opinion of the authors and are not representative of the views of Milliman, Inc. Milliman does not certify the information, nor does it guarantee the accuracy and completeness of such information. Use of such information is voluntary and should not be relied upon unless an independent review of its accuracy and completeness has been performed. Materials may not be reproduced without the express consent of Milliman.
MIL_COM_1 3/18_3/19 © 2018 Milliman Financial Risk Management LLC
For financial professional use only. Not intended for public distribution. Unless otherwise noted, data is sourced from Bloomberg.


