Summary: There are two seasonal patterns currently in play for investors: the weak "mid-term election cycle" and the weak "summer months." Is the next half year a landmine for investors? The short answer is no.
Since 1982, the average mid-term year has gained 9%. In fact, mid-term years have been better than the supposedly awesome Year 3 of the presidential cycle more than half the time in the past 36 years.
The same point can be made about summer seasonality. While it's true that returns and the odds of gains are typically lower over the next six months than in winter, seasonality still favors longs. If you sell in May, you should expect to buy back higher in November. For most investors, that's all that matters.
For swing traders, seasonal patterns suggest a general strategy to keep in mind. A swoon in May-June often sets up a bounce higher in July. Likewise, a swoon in August-September often sets up a bounce into October and the end of the year. That also corresponds with the mid-term cycle, which typically has a seasonal low point in September before a ramp into 4Q and into Year 3.
There are two seasonal patterns currently in play for investors: the "mid-term election cycle" and the "summer months." Neither points to negative returns but both point to lower than average returns. There is also some nuance to the patterns that suggest a potential strategy for swing traders to keep in mind.
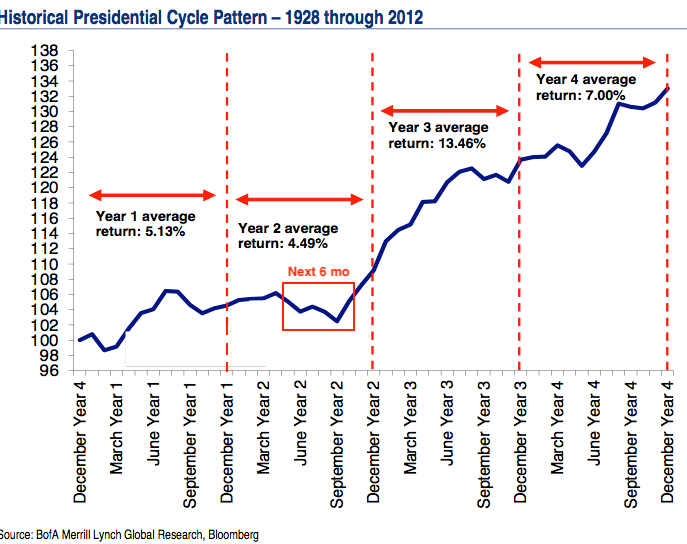
First, the mid-term election cycle: The second year of a president's term is generally considered the weakest of the four year cycle for stocks. To make matters worse, that seasonal weakness is most pronounced from now until October (red box; from BAML).

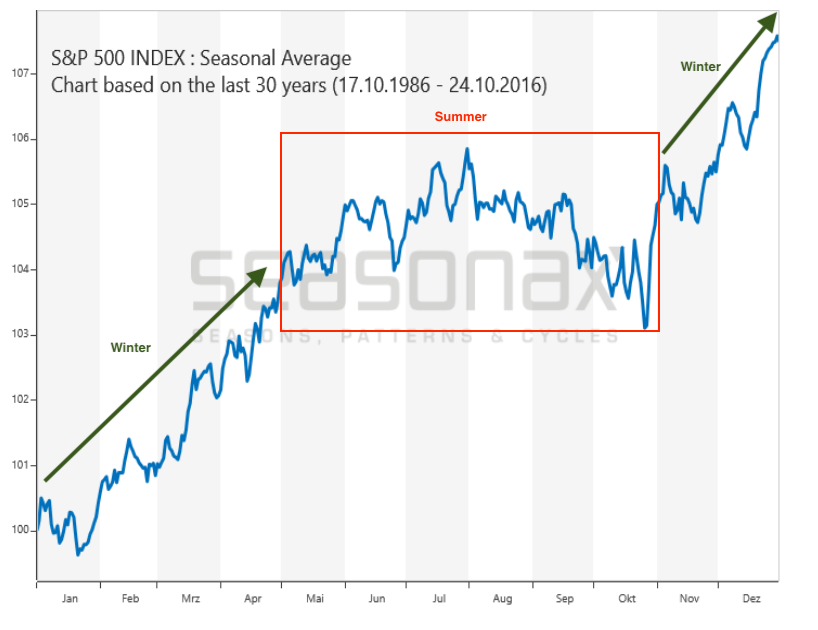
Second, the seasonally weak summer: 'Sell in May and buy after Halloween' is one the oldest axioms on Wall Street. Returns from May through October ("summer") are generally weak compared to those from November through April ("winter"; from Seasonax.com).
Taking these two patterns together, it would seem that the next half year is a landmine for investors. Is it?
The short answer is no.
Starting with the presidential cycle, while it's generally true that stocks are weaker in mid-term years than in other years, stocks have still risen an average of 4.5% during this period (since 1928). That may be less than other years, but it is still a decent gain.
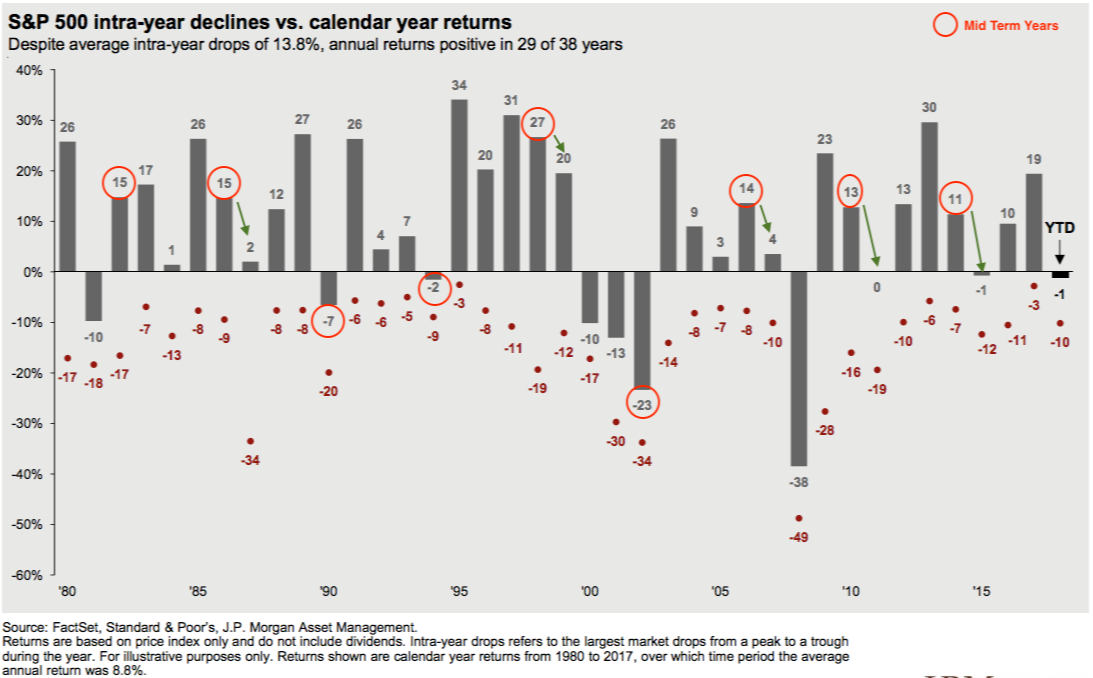
Moreover, the presidential cycle can be way off. In the last three mid-term years (2006, 2010, 2014), SPX rose 14%, 13% and 11%, respectively. Since 1982, the average mid-term year has gained 9%. Mid-term years have been better than Year 3 of the presidential cycle more than half the time in the past 36 years. Year 3's are reputed to be the best year of the presidential cycle but have gained a paltry 4%, 0% and -1% in the past three cycles (from JPM).
The same point can be made about summer seasonality. While it's true that returns are typically lower over the next six months (+2%) than in winter (+7%), and that the odds of gains are better in winter (76%) than in summer (65%), seasonality still favors longs over the next six months.
Net, if you sell in May, you should expect to buy back higher in November. For most investors, that's all that matters.
Why is there consternation over the summer season every year? There are two reasons.
First, some of the biggest falls in recent memory have occurred during the summer months. Stocks fell 30% in the summer of 2008, by 18% in 1974, 12% in 1987, and by similar amounts in both 2001 and 2002. Since 1970, the five worst summers (green bars) have averaged a fall of 19%; the five worst winters have averaged a fall of just 13% (blue bars).
Second, great returns in the summer are less frequent. 37% of winters have produced a return of 10% or more. In comparison, only 16% of summers have produced such a great return. A good stretch in the market is less than half as likely during the summer as the winter.
All of this makes it sound like risk/reward is unfavorable for traders over the next half year. But there are several big caveats to note.
First, all of those really bad summers - 1974, 1987, 2001-02 and 2008 - were during a bear market, and all except 1987 were during a recession. But US equities are not in a bear market and the US economy is not in a recession. SPX fell 11% at its February low, which is the exact amount equities typically fall every year, including in the middle of bull markets. 2018 might seem bearish, but it has been statistically normal.
To that end, stocks have traded higher from the start of May through October in the past 5 years (orange line). Risk/reward has been excellent. Even over the past 10 years, the typical summer has seen reward exceed risk from May 1 to October 31 (blue line; from Movement Capital).
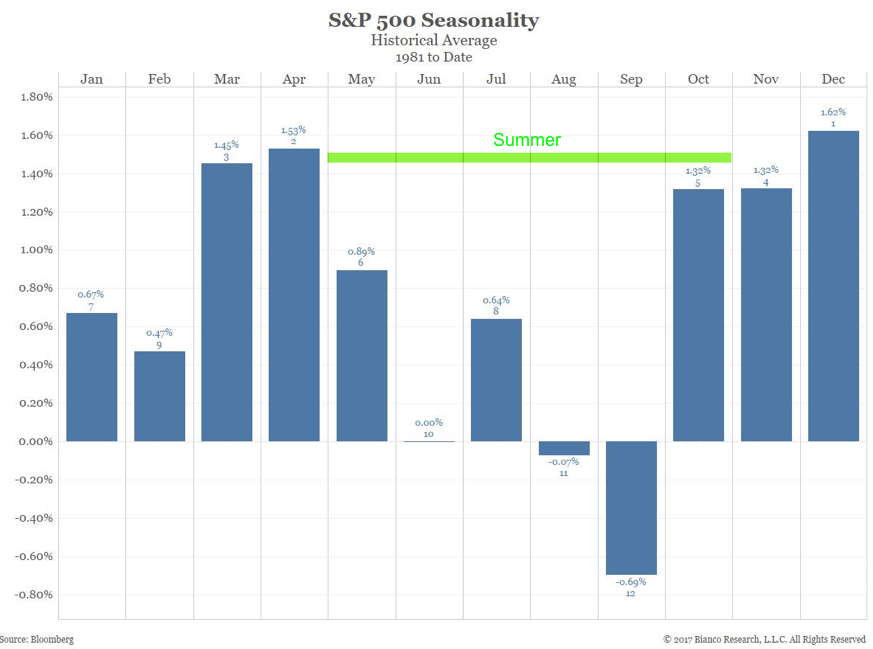
The second caveat is that there is a lot of variability in expected returns over the next six months. May, July and (especially) October have been pretty good months for stocks since 1981. The weakness in summer has mostly been confined to just three months: June and August-September (the next two charts are from Bianco Research).
For swing traders, this suggests a general strategy to keep in mind. A swoon in May-June often sets up a bounce higher in July. Likewise, a swoon in August-September usually sets up a bounce into October and the end of the year.
That also corresponds with the presidential cycle (first chart in this post): the seasonal low point has typically come in September before a ramp into the 4th quarter and Year 3.
Traders should also take note that volatility tends to be muted in May, June and July, the season where many imagine that Wall Street has retired to the Hamptons. Then come the three most volatile months of the year - August through October - when the seasonal low and subsequent rebound tend to take place.
In summary, there are two seasonal patterns currently in play for investors: the weak "mid-term election cycle" and the weak "summer months." In truth, neither cycle is bearish. If you sell in May, you should expect to buy back higher in November. Swing traders should keep in mind that a summer swoon often sets up a bounce into October and the end of the year. That also corresponds with the presidential cycle, which typically has a seasonal low point in September before a ramp into 4Q and Year 3.
© The Fat Pitch
Read more commentaries by The Fat Pitch