Summary: The Nasdaq closed at a new all-time high (ATH) on Friday. It has risen 6 days in a row. A number of studies suggest that it should continue to rise further, and that SPX should follow it, probably also to a new ATH. That is the near term set up as equities enter March options expiration week.
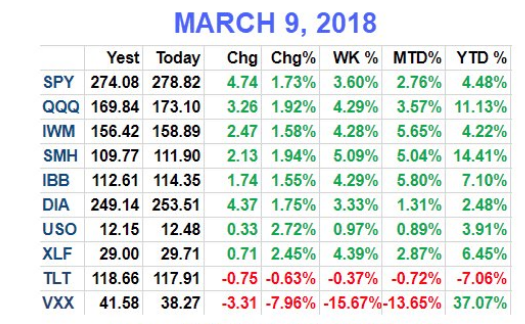
Last Friday's 2% intraday turnaround continued this past week. US equities gained 4% (from Alphatrends). Enlarge any chart by clicking on it.

The equity rally this week was global. Europe and emerging markets each gained more than 3% and Japan gained 1.5%. The reason? The threat of a trade war the previous week (leading to a 5% intra-week plunge) was walked all the way back by both US political parties and the administration.
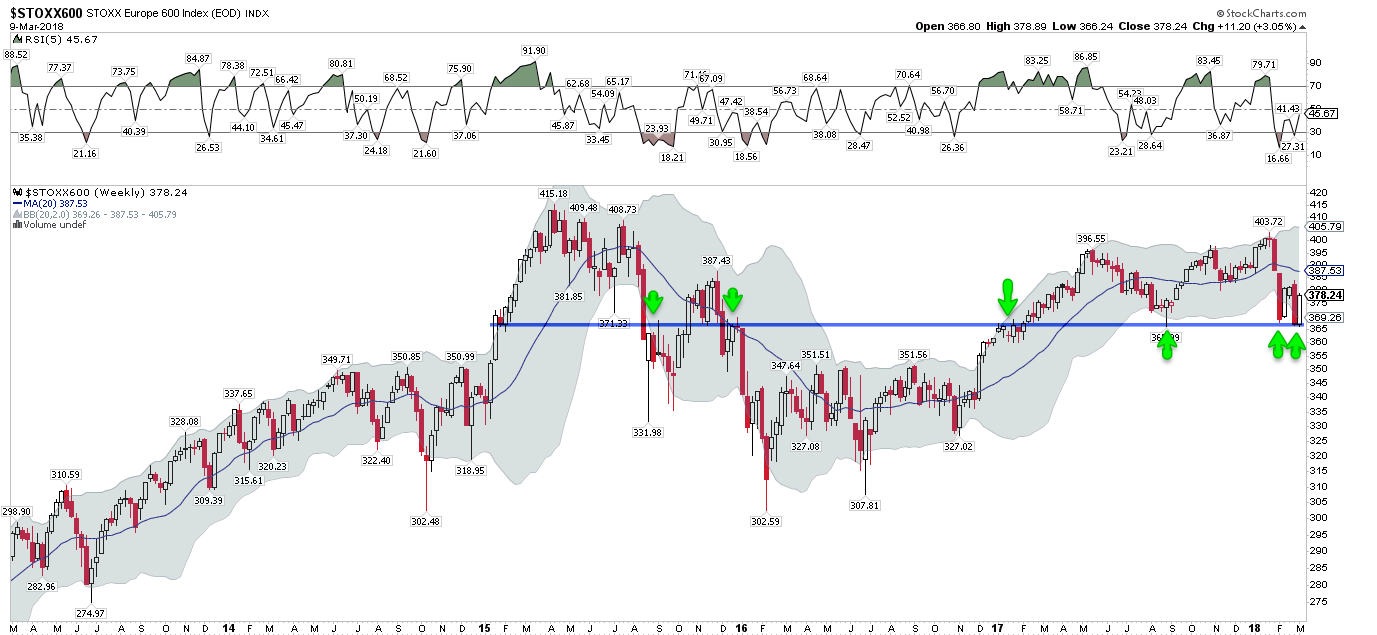
So long as a trade war remains a remote risk, equities should continue to rally higher. The broadest US index, the NYSE, came within 1% of its February 8 closing low a week ago. Europe and Japan both fully retested that low in the past week, which is now a critical line in the sand.
Similarly in the US, weakness in the SPX over the past 5 weeks has been held in check by the rising 20-week MA (blue line). That has been a good gauge of the primary trend in SPX (arrows). When it breaks, SPX has then gone on to its lower Bollinger Band (yellow shading), currently near 2500. It's a reasonable guess that the next time the 20-wma is tested, it will break and SPX will complete a full test of the February low.
US equities are being led higher by technology stocks, the only sector to break to new highs this week (green shading). The other sectors are, at best, back to their late February high (yellow shading), and well off their 2018 high made in January. Exceeding those February high pivots will be key for the week ahead.
Technology leadership is a strong positive. The Nasdaq Composite and 100 indices both made new all-time highs (ATHs) on Friday. 83% of the time, SPX follows to a new ATH within the next 10 days (from @OddStats).
The week ended with the release of a very strong employment report on Friday. When the Nasdaq gains more than 1% to a 50-d high on the day of the NFP release, it has added to those gains in the next week in 16 of 17 instances (94%; from Quantifiable Edges).
Likewise, NDX has gained 6 days in a row. This has occurred 17 times in the past 5 years, with NDX adding to those gains in the next week 88% of the time with risk/reward heavily skewed more than 4:1 positive (from Index Indicators).
Into last week's low, "smart money" put buying in the VIX spiked to an extreme (red line). That has a good record of coinciding with a high in volatility and near term low in SPX (black line; from Schaeffer's).
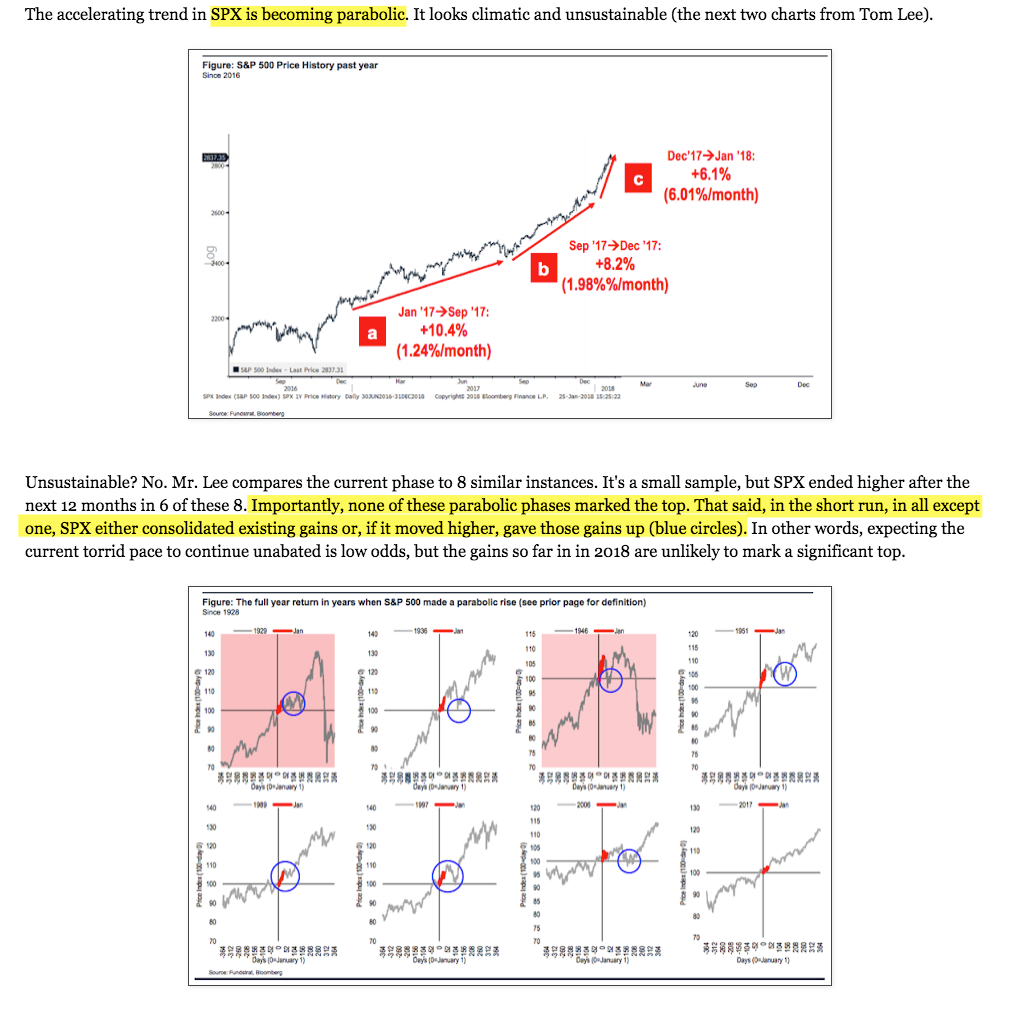
That equities continue to rise after their parabolic move might seem surprising. It shouldn't be. The rise into the January top was comparable to 8 other instances; in each of these, SPX went on to higher highs, usually after a multi-week period where recent gains were given up or consolidated, much like what the indices have done over the past month and a half. The chart below was from a post in January (read here) using an analysis from Tom Lee (read here).
The drama in 2018 is probably not over. Years that have a greater than 5% decline in the first few months tend to also have rough "summer" months. And as mentioned last week, a trip to the lower weekly Bollinger Band, which hasn't happened in over 14 months, is a normal annual bull market occurrence (read here).
SPY ended Friday highly "overbought", with an hourly RSI(5) of 96. That level of short term momentum is hard to sustain - most often, SPY consolidates or retraces recent gains in the next day(s) - but it rarely marks a top, with the index subsequently rising further. SPY (and many sectors) also closed Friday right at its late February pivot high, which is likely to represent some resistance. On weakness, look for initial support at the rising 5-d (green line) and the weekly pivot (gray line). WR1 and WR2 are well placed targets to the upside (red lines).
In summary, the Nasdaq closed at a new all-time high (ATH) on Friday. It has risen 6 days in a row. A number of studies suggest that it should continue to rise further, and that SPX should follow it, probably also to a new ATH. That is the near term set up as equities enter March options expiration week which is historically bullish (read here).
© The Fat Pitch
http://fat-pitch.blogspot.com
Read more commentaries by The Fat Pitch