Summary: The long term trend in US equities remains firmly higher. Expectations should be for equities to rise in the months ahead. The near term directional edge is more muted. Worldwide, equities are in the process of retesting their February lows. The US is being held up mostly by technology and financial stocks. Whether the US follows the rest of the world lower is largely dependent on politics: specifically, whether trade war rhetoric evolves from saber rattling to reality. March and the upcoming OpX week are a strong seasonal tailwind.
After falling 12% from their January high, and then bouncing 10% from their February low, equities fell 5% during the past week. A 2% turnaround on Friday eased some of the losses, with SPX closing down 2% for the week (from Alphatrends). Enlarge any chart by clicking on it.

Stating the obvious, with a VIX near 20, equities remain highly volatile. After rising 1% two days in a row, they then lost more than 1% three days in a row, capped by an intraday range on Friday of 2%.
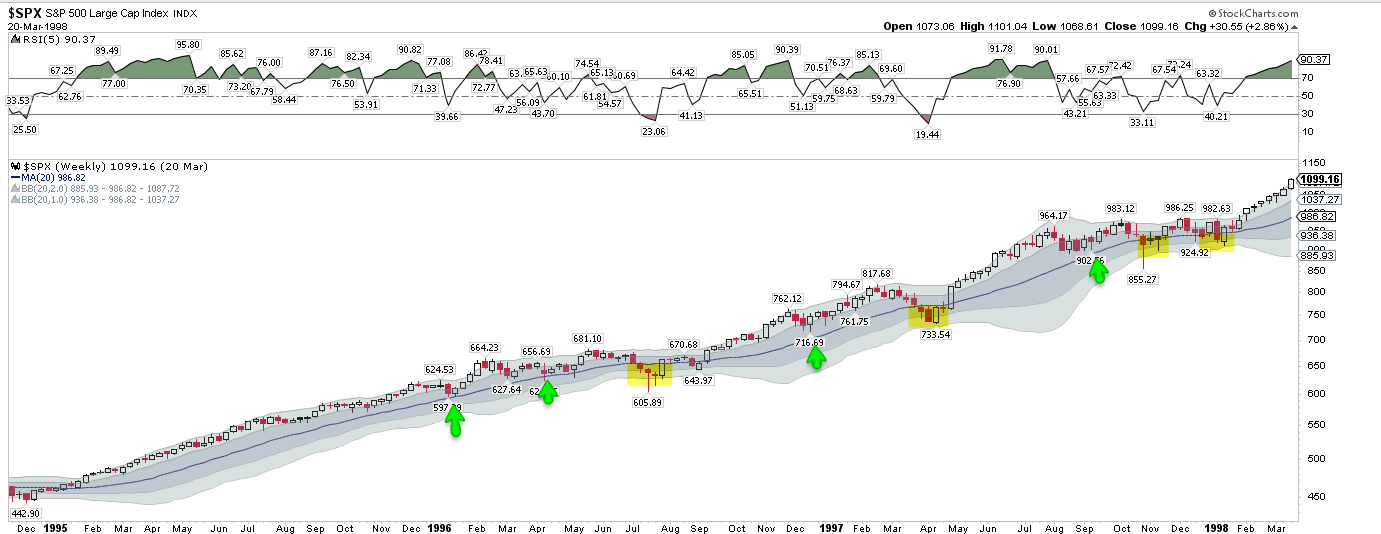
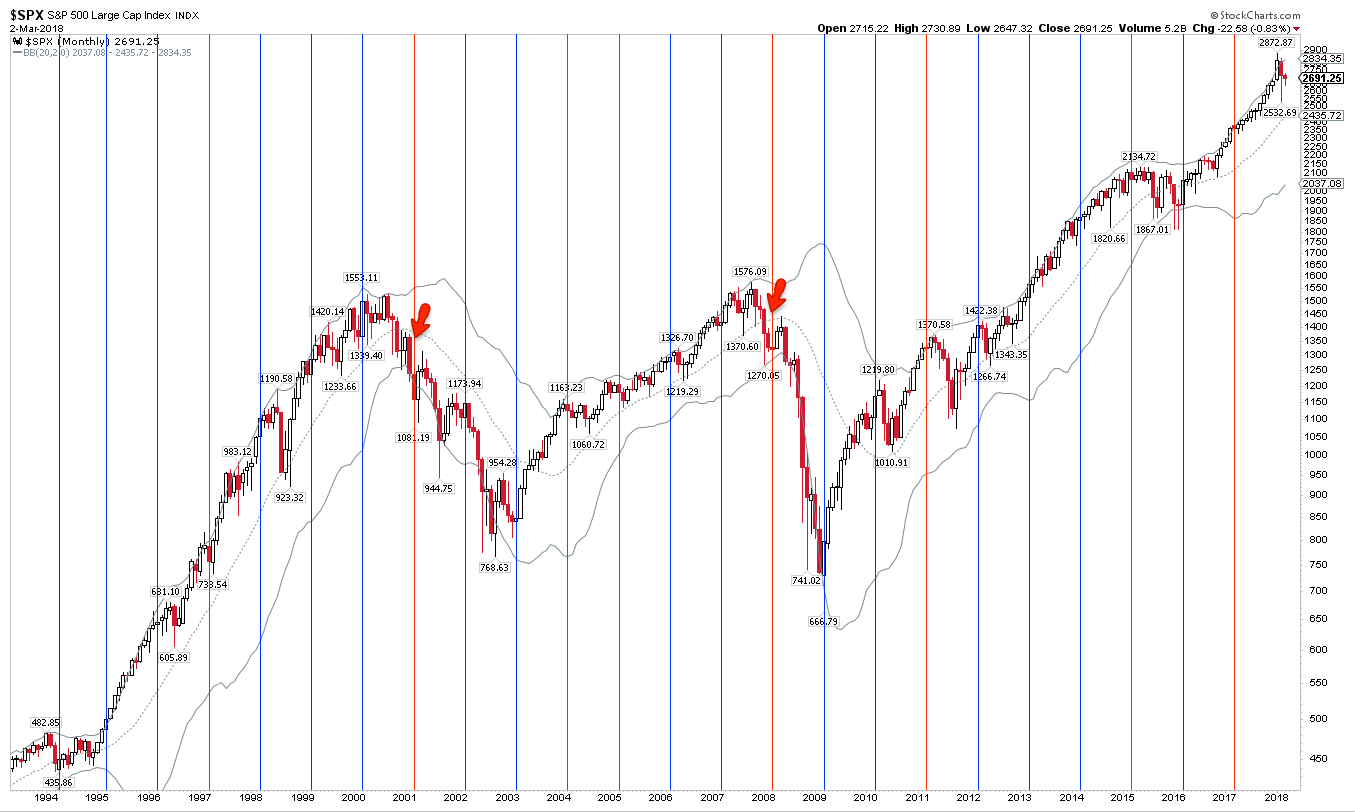
The long term trend in US equities remain higher. Weakness in the SPX over the past month has been held in check by the rising 20-week MA (blue line). That has been a good gauge of the primary trend in SPX (arrows). When it breaks, SPX has then gone on to its lower Bollinger Band (yellow shading), currently near 2500. That's about 7% lower and would represent a total correction from January of 13%, which is a typical drawdown during the course of any year.
It's a reasonable guess that the next time the 20-wma is tested, it will break and SPX will complete its full retest of the February low. It's also a good guess that a trip to the lower Bollinger is in store for 2018. The long uptrend in 2013 weakened in 2014 and ultimately broke at the end of that year (chart above).
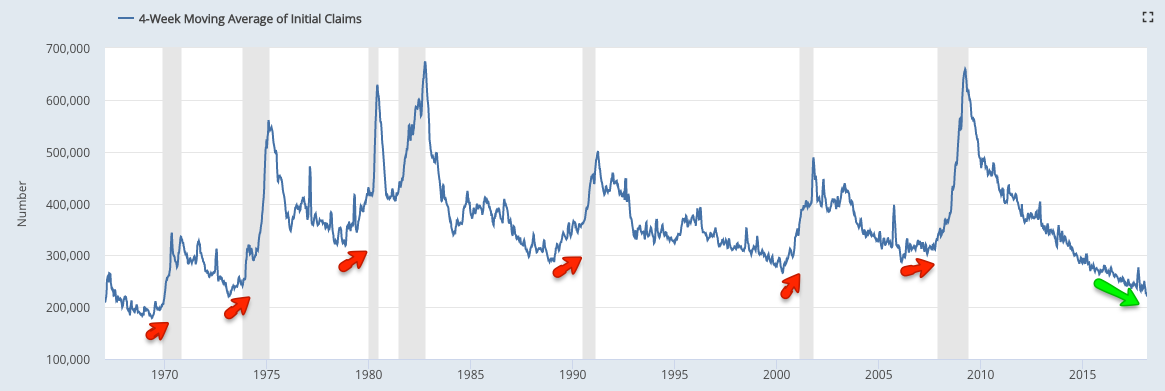
The macro data agrees with the technical data. Unemployment claims continue to fall, reaching their lowest level in 48 years this week. Claims have historically started to rise at least 6 months ahead of the next recession.
New home sales and real retail sales both reached new uptrend highs as recently as November. In the past 50 years, more than a year has lapsed between the expansion's high print in new home sales and the start of the next recession.
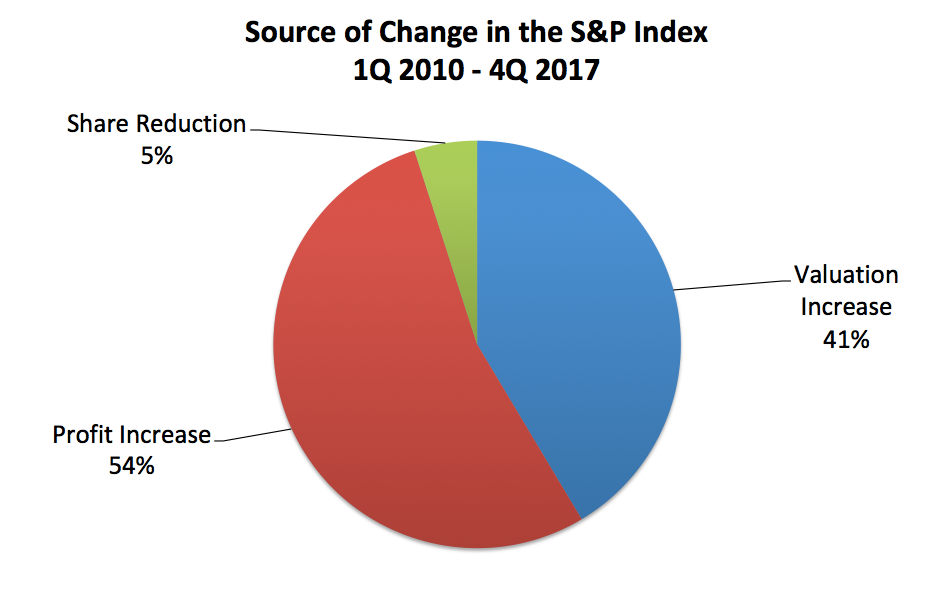
Corporate results are likewise strong and provide confirmation of equities' primary uptrend. SPX sales grew 9% over the past year, the best growth in 6 years. Earnings rose 23%, the best growth in 7 years. Profit margins expanded to a new all-time high of 10.8%. Earnings during 2017, in fact, rose as much the SPX index itself. A new post on this is here.
While long term prospects look solid, the shorter term outlook is less clear. There is most often a strong directional edge. Now is one of the rarer times when the edge is muted.
The swift and dramatic drop in February was quickly reversed. But, most often, those drops end in a retest of the low. A number of recent posts on this can be found here, here and here.
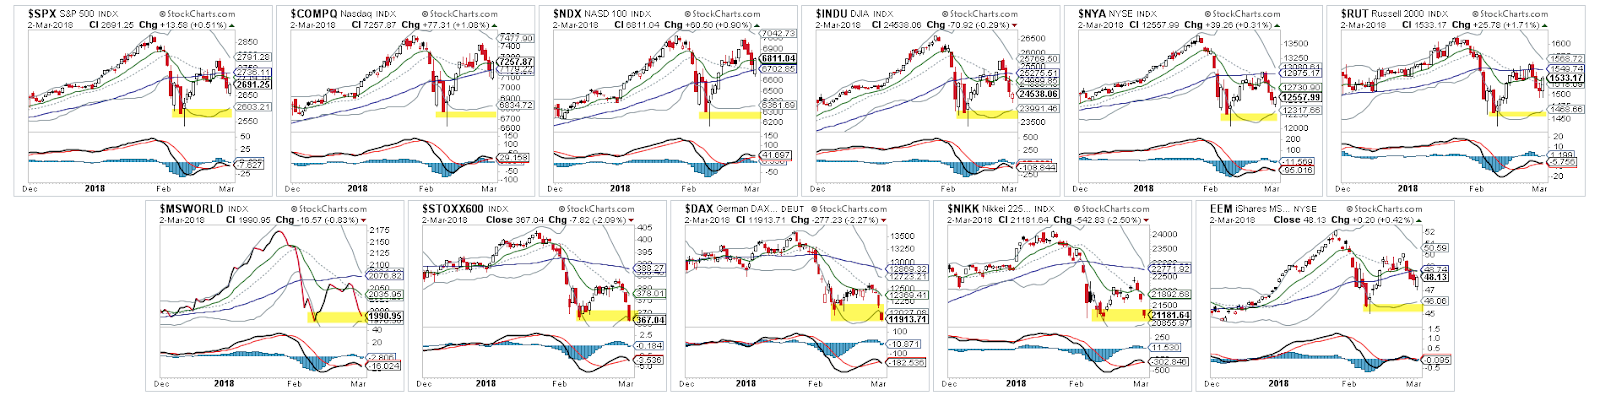
That low retest appears to be in progress now. Europe and Japan have already returned to the February lows. In the US, the very broad NYSE came within 1% of its February closing low on Friday. The technology heavy Nasdaq remains the strongest index.
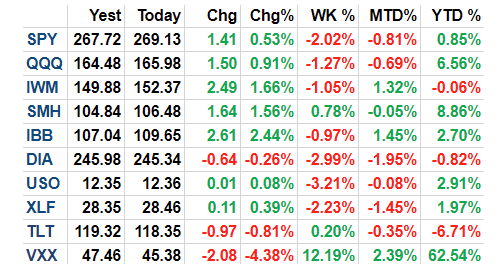
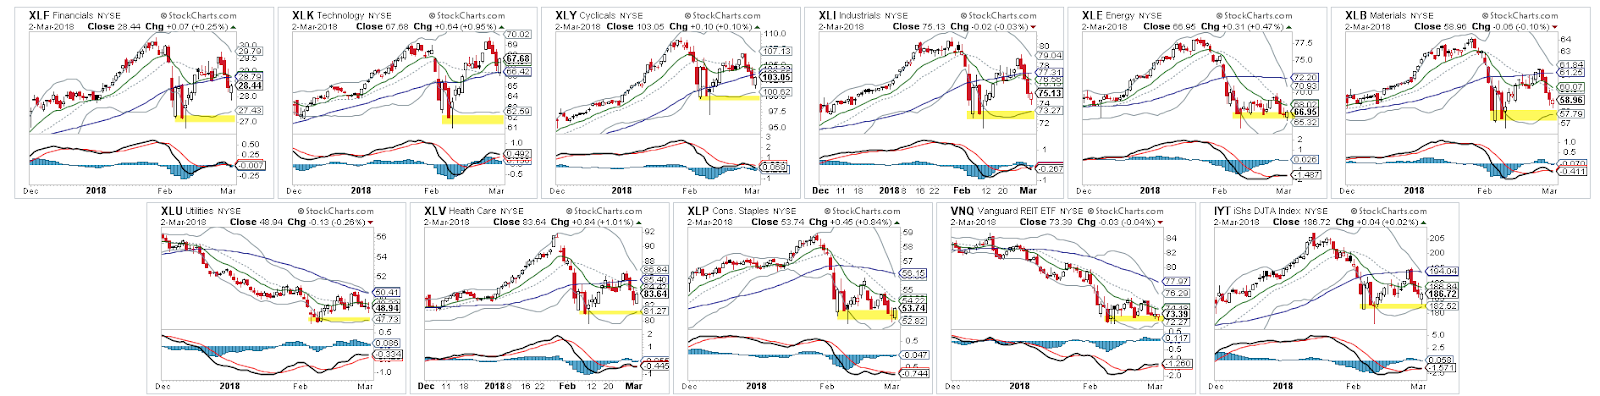
Most of the sectors in the US have either retested their February low or have come within 1% of those lows (closing basis). Financial and technology sectors are by far the strongest. Put another way, those stocks are so far responsible for keeping SPX from a full low retest.
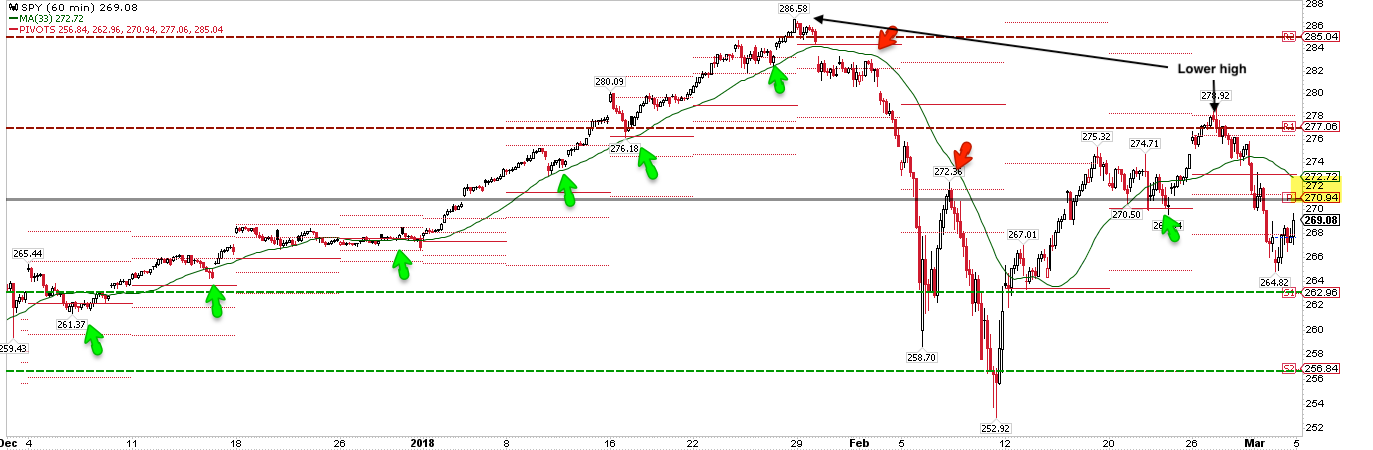
The bounce in SPY created a "lower high." The index is now below a falling 5-dma (and 13-ema and 50-dma). This is a near term downtrend. New uptrends start with the 5-dma being regained (arrows), after which the moving average starts to rise. That is a key watch out for the coming week. Regaining the weekly pivot (gray line) will be a further positive. Ultimately, the late February "lower high" needs to be exceeded to turn the near term trend higher.
The weekly S1 and S2 are also well positioned for support in the event of further weakness this week. WS2 is close to the February 8 closing low. The February 26 "lower high" is just $1 above WR1.
SPX lost more than 1% for 3 days in a row last week. That level of downward momentum does not typically end on Day 3. All except one of the most recent similar instances resulted in at least one lower close; the one exception made a lower close 2 months later (from Dave Bergstrom).
DJIA closed lower on Friday as well; a 4 day in a row losing streak. In the last 5 years, that has happened 24 times and DJIA has closed lower within the next 7 days in all but 3 instances (88%). One lower close is high (but not certain) odds (from Index Indicators).
The wild card - and the primary reason the directional edge is muted near term - is the potential for a trade war.
The US administration announced an import tariff on steel this week. While the tariff is good for steel producers (which employ 140,000 workers), it is bad for domestic consumers of steel (which employ 6.5 million workers) and because these far outnumber steel producers, the tariff is a net negative. Our trading partners are also threatening retaliatory tariffs on US exports, another negative, and in response, the US is threatening tariffs on other goods, like imported automobiles. This is a potential trade war (from Bloomberg).
Tariffs can produce a "winner" at the micro level: US steel producers win, importers lose. But tariffs are a "lose-lose" for everyone at the macro level. Consumers pay higher prices and exporters face smaller markets, lowering overall demand. Trade is not a zero sum game because trade increases the size of the global market. At the macro level, all evidence indicates that overall demand rises: producers and consumers win and incomes rise.
If this trade war escalates, a full retest of the February low is all but certain. If last week's rhetoric was nothing more than saber rattling, then Friday's reversal could mark the low.
Seasonally, while February has been weak, March has been a strong month for equities over the past 10, 20 and 67 years (from Ryan Detrick).
Moreover, March has not been down after February was down except in the bear market years of 2001 and 2008 when equities were already in a downtrend.
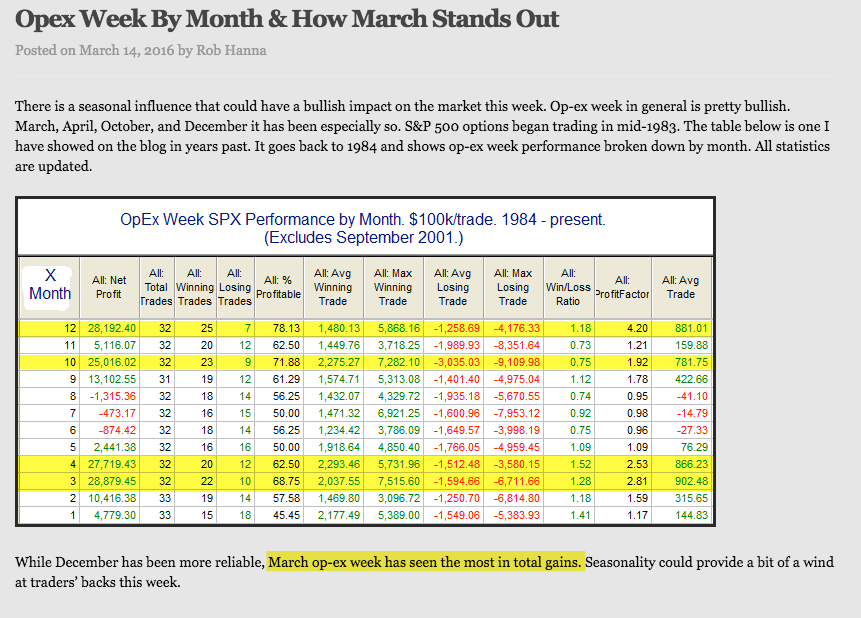
The coming week is the last full week before monthly options expiration. March OpX is one of the strongest weeks of the year (from Quantifiable Edges; here).
In summary, the long term trend in US equities remains firmly higher. Expectations should be for equities to rise in the months ahead. The near term directional edge is more muted. Worldwide, equities are in the process of retesting their February lows. The US is being held up mostly by technology and financial stocks. Whether the US follows the rest of the world lower is largely dependent on politics: specifically, whether trade war rhetoric evolves from saber rattling to reality. March and the upcoming OpX week are a strong seasonal tailwind.
The macro calendar this is dominated by the monthly employment report on Friday.
© The Fat Pitch
Read more commentaries by The Fat Pitch