Summary: After falling into their first correction in two years, US equities regained half of their loses in just 6 days. The rebound has been strong enough and persistent enough to suggest that it has further to run. Sentiment and volatility backwardation support that view. However, a low retest over the coming weeks is still a viable risk.
In just one week, US indices regained about half of their losses during the prior two weeks. SPX gained more than 4% and NDX more than 5% (from Alphatrends). Enlarge any chart by clicking on it.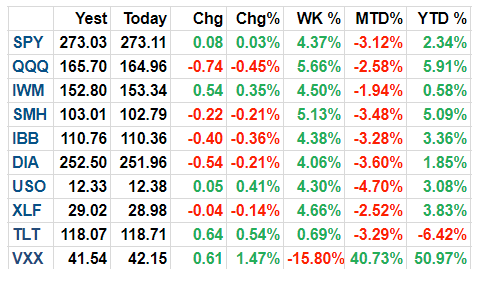
Recall from last week's article that prior falls like the one the markets just suffered has led to quick recoveries, and that likelihood was further supported by a washout in breadth, volatility and several measures of sentiment. Net: risk/reward was heavily biased towards upside in the near term. That post is here.
The bounce puts SPX back above its rising 50-dma as well as its rising 13-ema. New uptrends start when price regains the 5-dma, which then flattens and then starts to rise (green line); this occurred last Monday and Tuesday. For the week ahead, the rising 5-dma is an important marker that a new uptrend remains underway (arrows).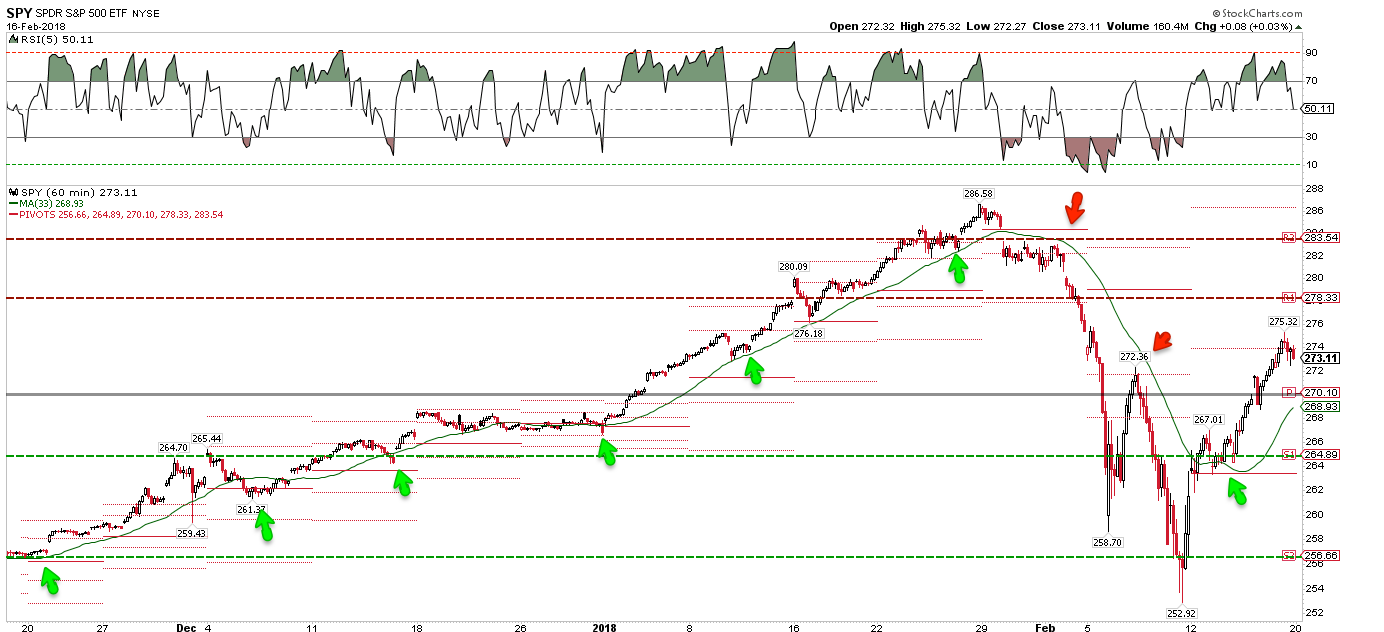
With the VIX still near 20, expect volatility to remain high. Holding the weekly pivot (gray line, above) would be very positive, but a more realistic heavy support level is weekly S1, which was also Wednesday's open (dashed green line).
Many of the studies from last week anticipated the strong rebound, and a few also expected the low to be retested over the weeks ahead. Is that still likely?
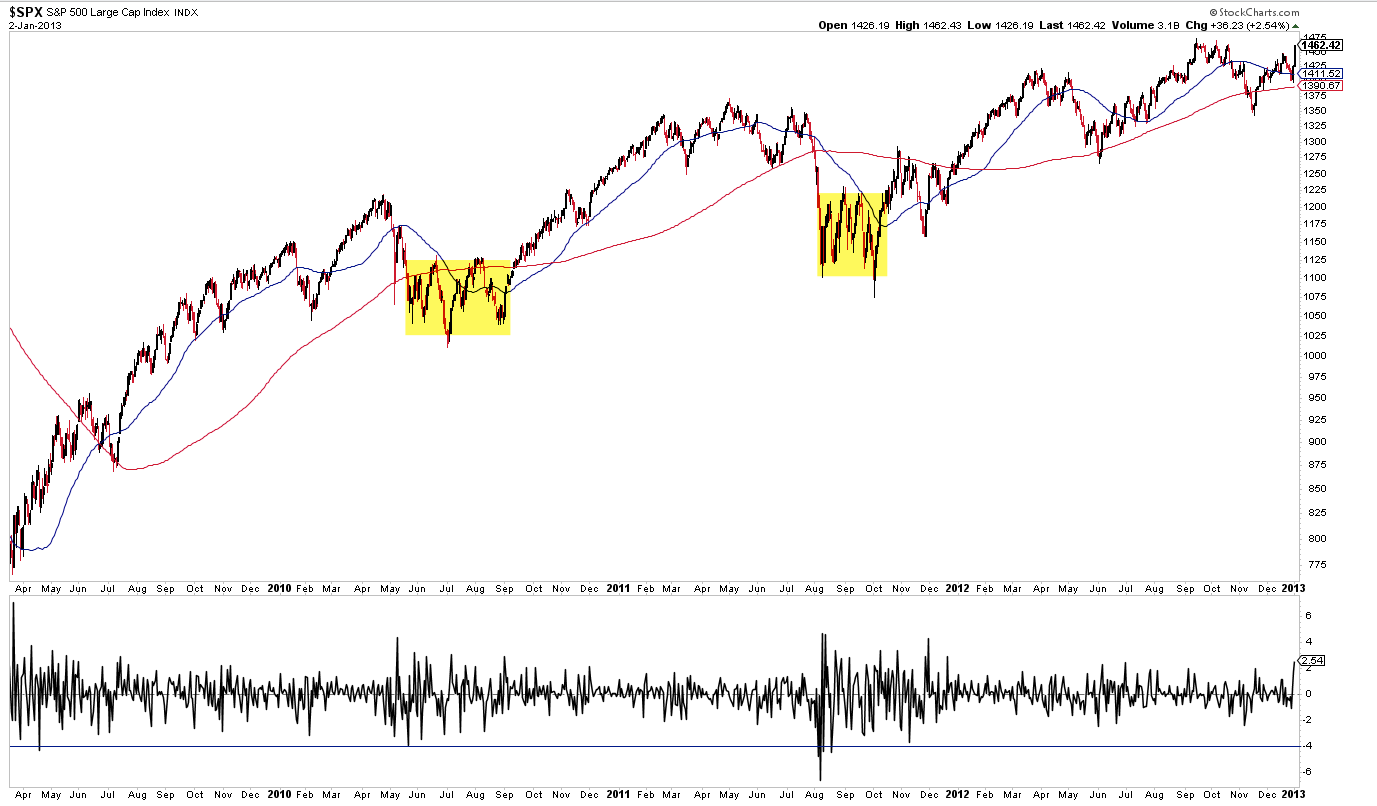
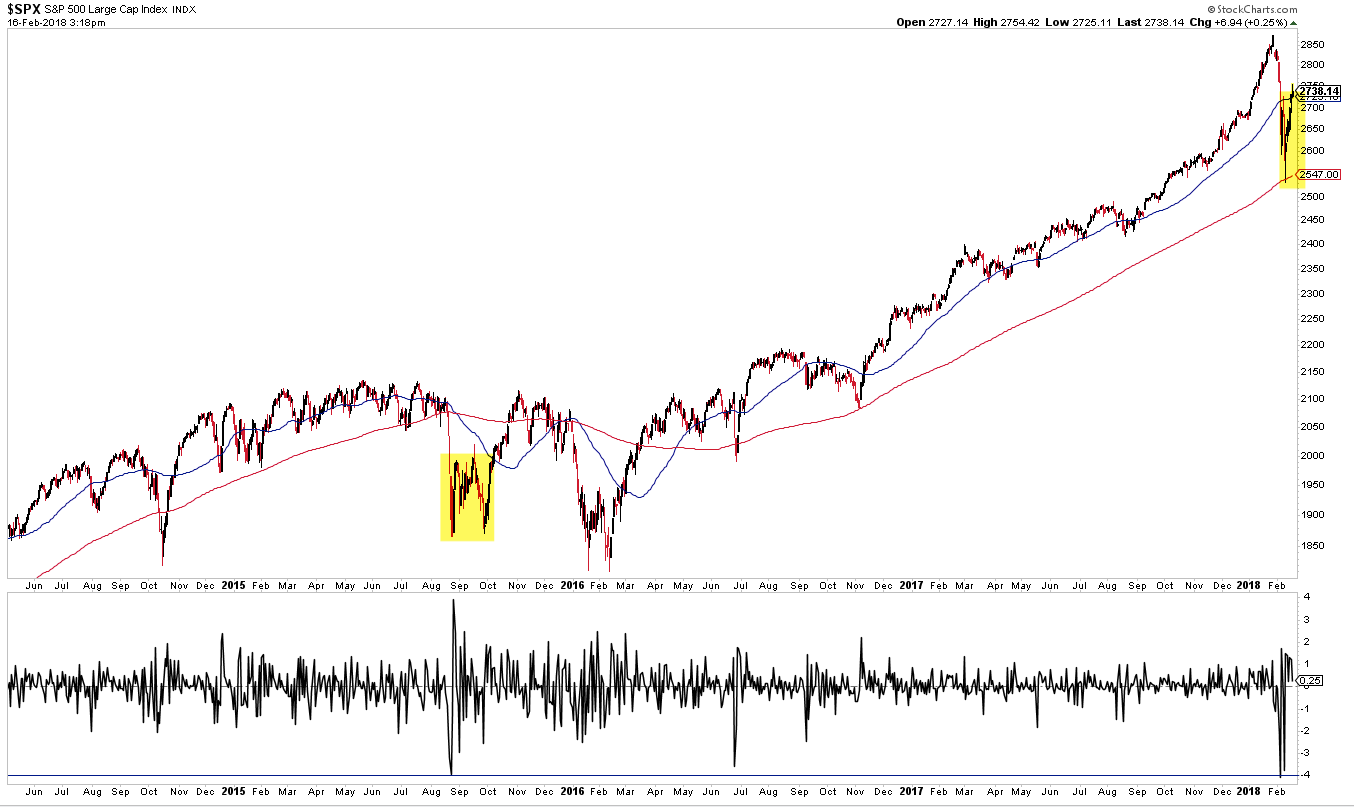
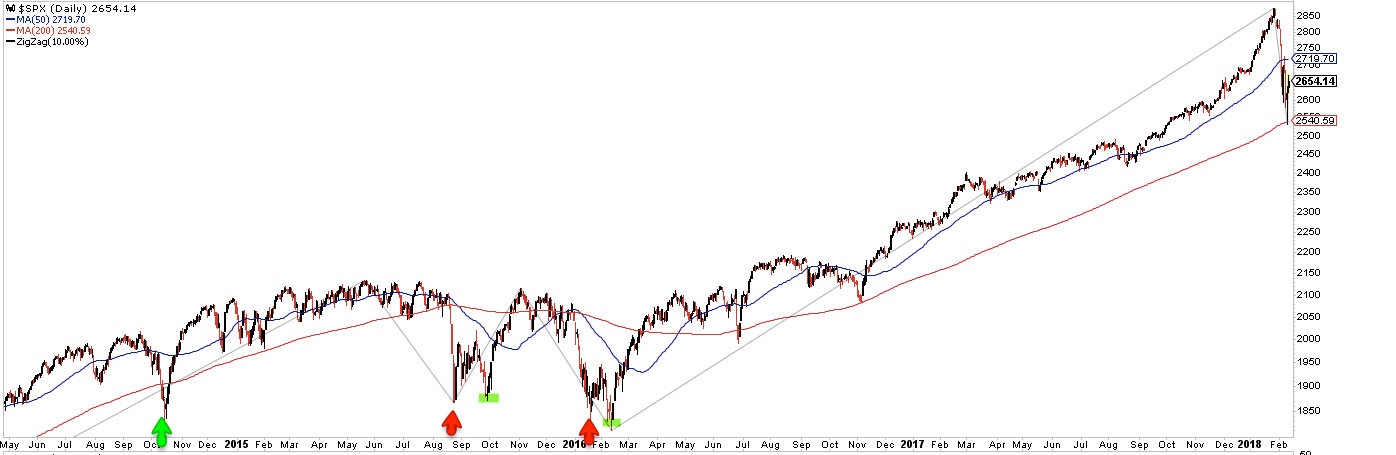
Corrections (i.e., falls of 10%) during bull markets have had a strong propensity to form a double bottom (green shading). Since 1980, only 16% of corrections have had a "V bounce" where the low was never revisited. However, the current bull market has been different: since 2009, about half of the corrections have had a "V bounce" (green arrows). Net, there is at least an even chance that the low will be tested. A new post on this is here.
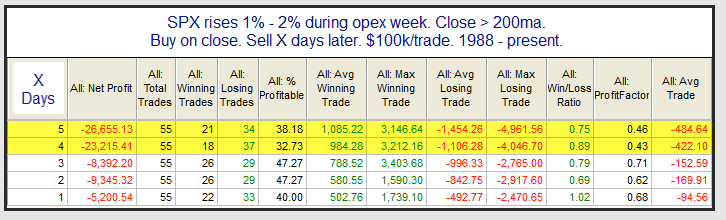
The strong bounce this week doesn't change that perspective. Consider, for example, daily falls of 4%, something SPX experienced on February 5. Since 1980, there have been more than 10 of these while SPX was in an uptrend. Each time, SPX has bounced and then dropped again, usually to the prior low, as shown in the charts below (shading starts with initial >4% drop).