Summary: After gaining more than 7% by late January, US stocks have fallen into a 10% correction. It's the quickest decline of that magnitude from an all-time high in 90 years. While a fall in stocks was not a surprise, the speed and severity certainly were.
So what happens next? Prior falls like this have led to quick recoveries. That likelihood is further supported by a washout in breadth, volatility and several measures of sentiment. Moreover, the fundamental backdrop remains excellent. Risk/reward is heavily biased towards upside in the near term.
That said, strong down momentum normally reverberates into the weeks ahead. Equities sometimes "V bounce" but more often form a double bottom. A low retest in the not too distant future remains a greater than 50% probability. The longer term outlook for US equities is unchanged and favorable.
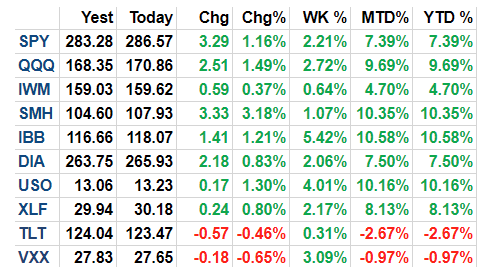
Two weeks ago, all of the US indices made new all time highs (ATHs). SPX and DJIA were up 7% and NDX was up 10% YTD. VXX, the ETF based on the VIX, was down for the year (the next two charts from Alphatrends). Enlarge any chart by clicking on it.

In hindsight, we now know that that was an interim top. Compare the chart above to the one below: most equity indices have lost 10% in two short weeks. Bonds have tumbled further. Volatility is 80% higher.
In the grand picture, a drop of 10% is not unusual, and so the last two weeks are not be a complete surprise. In a post on "What To Expect in 2018" (here), we showed that the median annual drawdown in the SPX has been 10%, and that even a 14% fall is within the normal range.
And in a post in early January, we showed that low volatility years (like 2017) have always been followed by years with volatility 2-3 times higher (from Ryan Detrick).
Strong starts to a year (like 2018) usually continue higher, but intra-year drawdowns are larger than in all other years. That makes sense, as price has further to fall to revert to trend (from Bespoke).
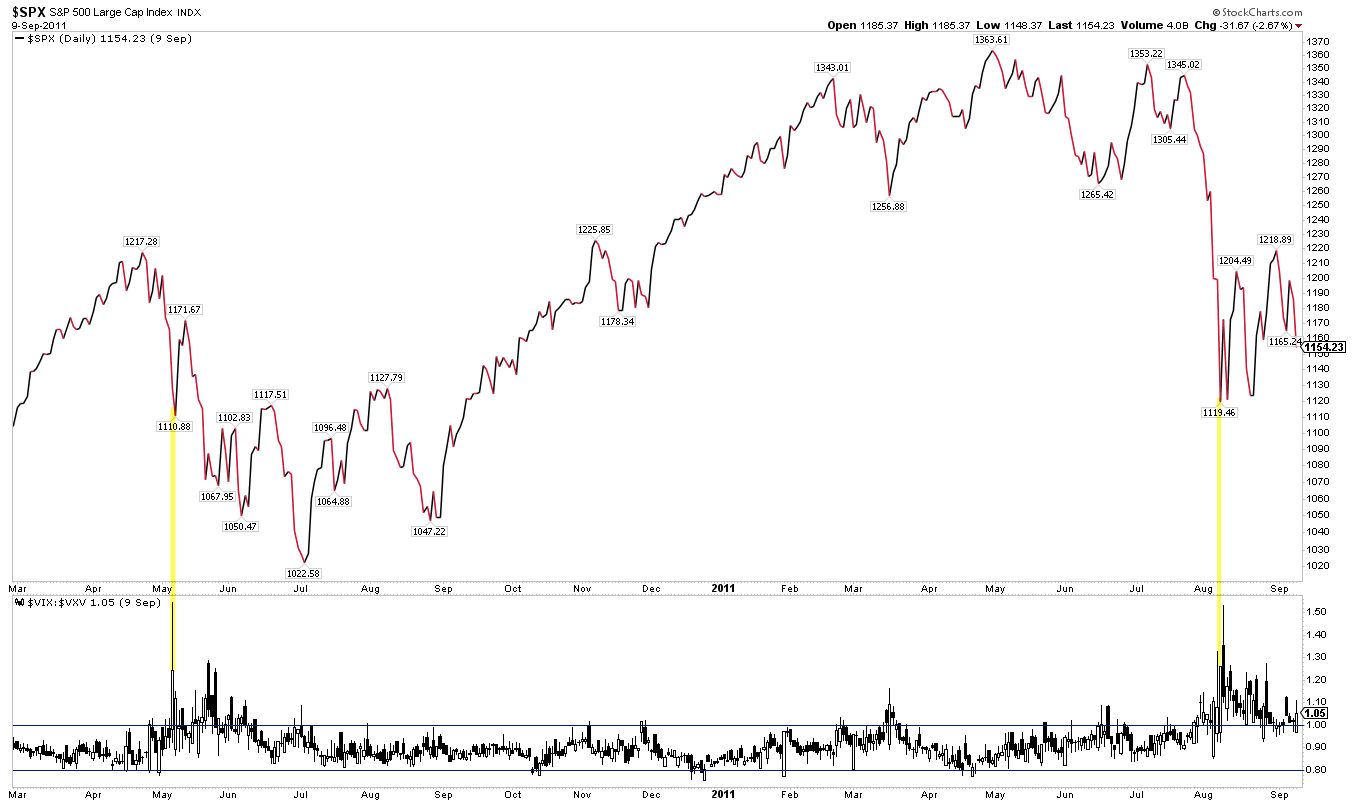
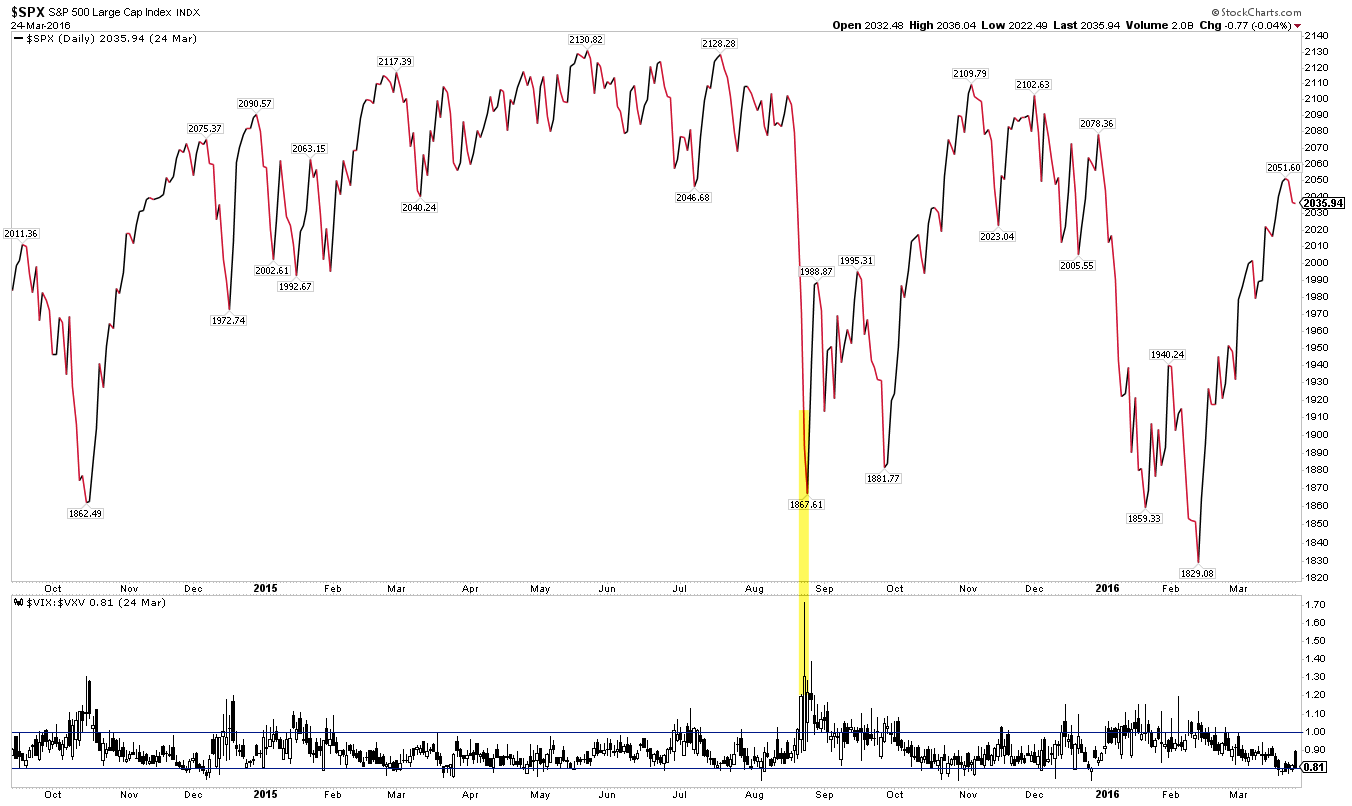
A week before the peak in US equities, optimism among retail investors reached a more than 3 year high, an extreme only matched twice during the current bull market: in January 2011 and November 2014. Investor optimism is a poor market timing tool but when price continues to rise, subsequent gains tend to be given back (arrows). So while it's impossible to know when the market will reverse, the reversal itself was not unexpected.
But it would be wrong to say that the extent and speed of the fall in the past two weeks was easily anticipated. In only 9 days, the SPX and DJIA fell more than 10%. The last time a fall this large and fast occurred from an ATH was 90 years ago, in 1928.
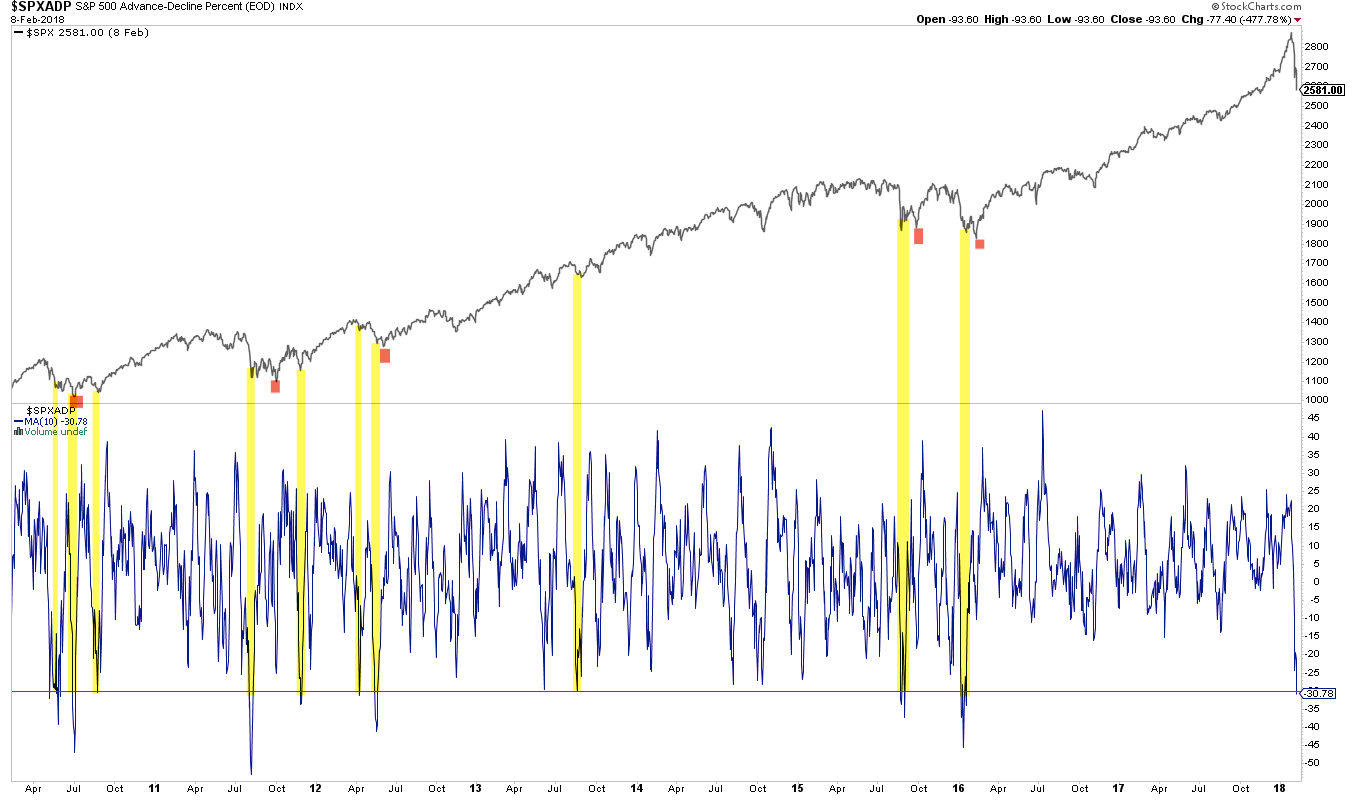
Recall that the SPX had set a record for the longest rise without a 3% fall, and that the current uptrend was one of the longest without a 5% fall or a 10% fall. In the past, there has been almost no overlap in streaks between 3% and 5% falls or streaks between 3% and 10% falls, meaning that long, calm uptrends tend to weaken in stages and over time. Yet within a few days, all of these streaks ended (from Bespoke).
Daniel Perczek
Quantifiable Edges
Recall that 1955 and 1986 were also periods when monthly RSI(14), a measure of momentum, reached an extreme present only two other times since, in 1996 and in January of this year. In our update two weeks ago, we showed that in all prior cases, SPX moved to new highs in the months ahead, but not before falling 11%, 5%, 6% and 9% in the next month. It's a small sample, but so far SPX is following the same pattern (that post is here).
That equities have quickly recovered from previous swift falls that started from a high should not be a surprise. Strong uptrends carry momentum that typically weakens before failing completely. The implication, however, is that for the first time since early 2016, the trend in equities is on watch. A recovery to prior highs followed by more volatility creates the sawtooth pattern that is most often found at important tops.
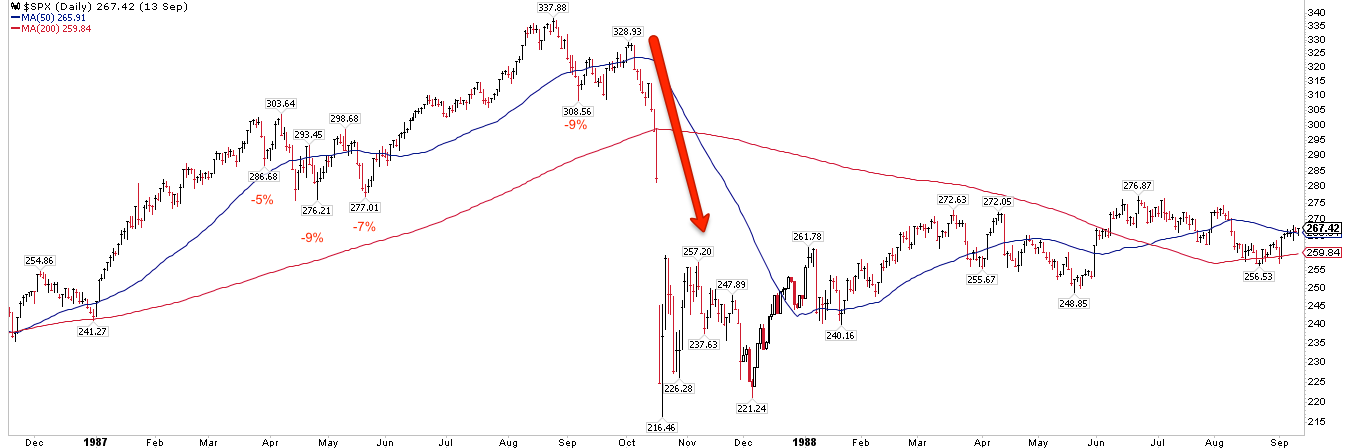
To take a popular but extreme example, in 1987, SPX first fell 5% in March, recovered to new highs but then fell 9% in April and 7% in May. After another new high in August, SPX again fell 9%, recovered to within 2% of the top before crashing in October. What is now remembered as a sudden crash actually unfolded over the course of 6 months.
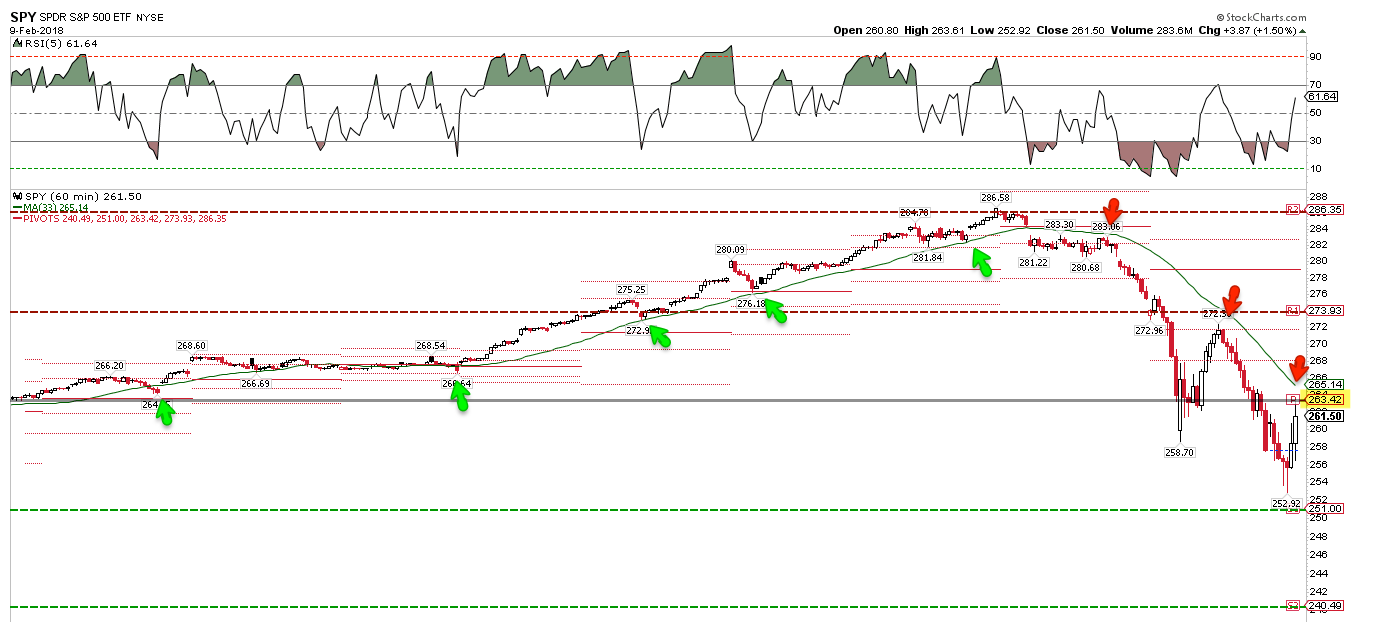
SPX broke to a new low on Friday before bouncing over 3% into the close. It is now in an intermediate downtrend, as price is under a flat 50-dma and a falling 13-ema. New uptrends start when price regains the 5-dma, which then flattens and then starts to rise (green line). The rising 5-dma was support on the rise and has been resistance since the late-January peak (arrows). The pivot points for next week are well placed.
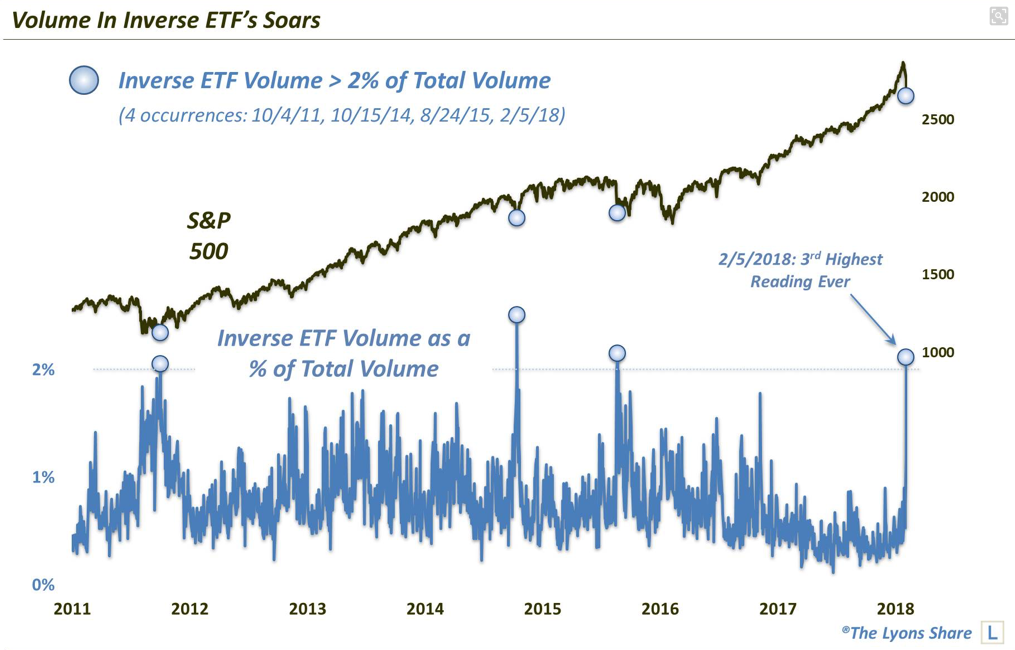
The CNN Fear and Greed index dropped to 8 on Thursday. In the past 5 years, SPX has closed higher after 1 or 2 weeks 93% of the time (only August 2015 was a failure). SPX has also closed higher after 1 or 2 months 87% of the time (from Sentimentrader; to become a subscriber, please use this link).
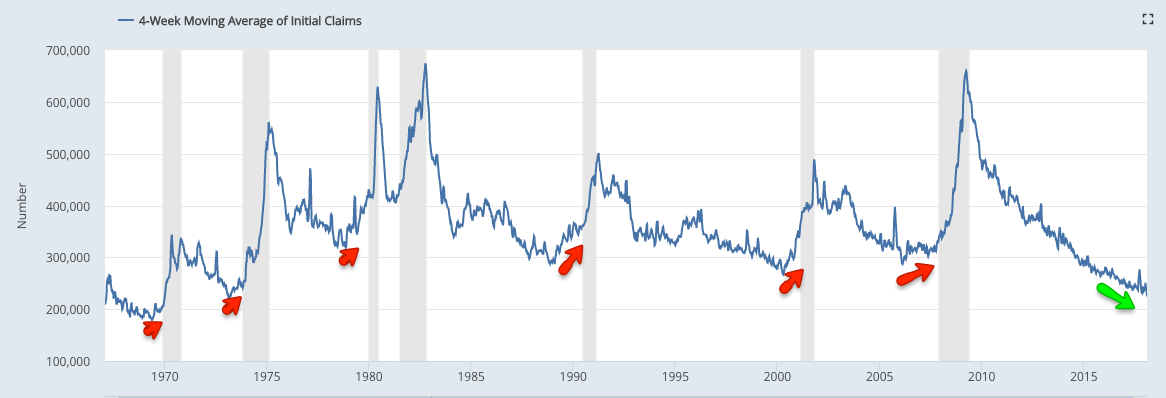
Fundamental data continues to be excellent. This week, initial unemployment claims fell to a fresh 45-year low. Historically, claims have started to rise at least 6 months ahead of the next recession. It's unlikely the recent swoon in equities is related to US growth prospects.
Ten year treasury yields have gained nearly 50bp this year. In the past 17 years, equities have gained in all years except one in which treasury yields have risen, as rising yields reflect better growth prospects (from Liz Ann Sonders).
That said, it's likely the rise in yields has become extended. Commercial hedgers ("smart money" traders) have one their largest net long positions ever, meaning they believe yields will likely decline in the weeks/months ahead. Their track record is very good (from Sentimentrader).
In summary, prior falls like the one suffered over the past two weeks have led to quick recoveries. That likelihood is further supported by a washout in breadth, volatility and several measures of sentiment. Moreover, the fundamental backdrop remains excellent. Risk/reward is heavily biased towards upside in the near term.
That said, strong down momentum normally reverberates into the weeks ahead. Equities sometimes "V bounce" but more often form a double bottom. A low retest in the not too distant future remains a greater than 50% probability.
© The Fat Pitch
Read more commentaries by The Fat Pitch