The Dynamic Yield Curve
For those who may have a life beyond the daily activities in the bond market, it is possible to have missed the dramatic changes in the Treasury yield curve over the last four years. Short-term yields have risen sharply while long-term rates have fallen, with the 7-year segment of the curve as the pivot point for the shift. Chart 1 below illustrates the dramatic change in the curve structure from the end of 2013 to the end of 2017. During this time, the slope of the Treasury curve flattened 212 bps between the 2-year and 10-year maturities, from a steep slope of +264 bps in late-2013 to a relatively flat +52 bps at the end of 2017. The yield spread between 2s and 10s at the start of this year was one-half the long-term average spread of approximately +100 bps since the late-1970s.

As many investors know, the yield curve has been one of the more reliable leading indicators of economic growth and inflation over many cycles. A flattening curve has often been a signal of slower growth ahead. More worrisome has been an inverted curve, where short-term rates are higher than long-term, which has preceded every post-World War II recession. The curve’s predictive value, however, is not perfect, with occasional false positive signals for both flat and steep curves. The steep 2013 curve was, in fact, a false signal of faster growth and higher inflation. Instead, the curve was reflecting the Fed’s extended zero-rate policy which held short-term rates historically low. Since then, the Fed’s financial repression has mostly ended as the Fed normalizes monetary policy.
The curve may once again be sending misleading signals as we do not yet see signs of economic warning clouds on the horizon. Rather, growth has strengthened; averaging nearly 3% in the final three quarters of 2017, and the cyclical momentum has extended into 2018. In addition, the corporate and individual tax cuts should provide a modest boost to growth this year. More importantly, this fiscal stimulus may help extend the length of this cycle. January was the 103rd month in this economic expansion and surpassing the record 120-month expansion of the 1990s now seems a possibility, if not a high probability.
A growing economy has provided support for the Fed’s five gradual one-quarter point rate hikes since December 2015. The market currently expects three rate hikes this year which, if correct, would push the target federal funds rate to the 2.0% - 2.25% range, a level many economists believe is the “neutral” rate given the slower expected growth rate for the U.S. economy going forward. Neutral is defined as the point at which monetary policy neither slows nor enhances the pace of growth and presumably further rate adjustments would occur only to tamp down persistent inflation above the Fed’s 2% target. While 2-year Treasury yields should continue to rise as the federal funds rate rises, the Fed may not do so at the same one-for-one pace as in 2017, given the approaching neutral rate “ceiling.”
Further out the curve, the decline in long-term yields has been due to a combination of favorable fundamental and technical factors. Relatively slow growth and moderate inflation plus strong demand from natural, long-maturity buyers, such as life insurers and pensions de-risking, have contributed to the lower yield trend. Abundant global liquidity and a nearly insatiable demand for income from retiring baby boomers have been supportive as well. Although no single indicator is infallible, including the yield curve, experienced investors know to keep an eye on the shape of the yield curve when considering their outlook.
Value in Short-Term Bonds
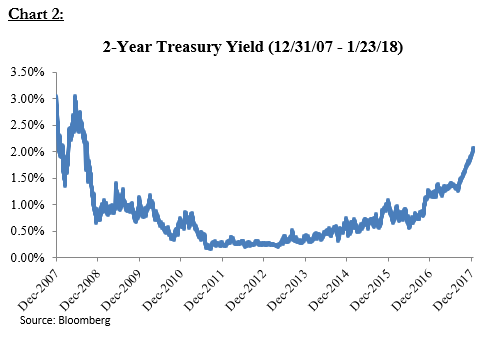
The sharp rise in short-term rates in 2017 has created attractive valuations on the front end of the investment-grade curve. If the curve could speak, almost certainly the shorter maturities would now be shouting, “look at me …look at me!” (see Chart 2). Not since Fall 2008 have investors been able to earn 2.0%, or more, on high-quality, short-term bonds such as 2-year Treasury notes. Investment-grade corporates and short-term mortgage and asset-backed products, even higher-quality, short-term tax-free municipal bonds when tax adjusted, all offer even more yield than do Treasuries. Considering how low short-term rates were (near 0%), and how long they remained low, the recent boost in short-term yields not only allows investors to once again earn a reasonable nominal return on their money without needing to take significant duration risk, but it also provides an opportunity to earn a positive real return, since core inflation measures remain below the Fed’s 2.0% target. In recent years, conservative investors who focused on the short end of the yield curve bore the brunt of the Fed’s extraordinarily easy monetary policy, while the more aggressive investors who responded to the Fed’s message to move out the yield curve and/or down in credit quality were handsomely rewarded. Fortunately, there remains a massive amount of cash on the sidelines that can now benefit from the value in short-term bonds. According to the Federal Reserve’s Q3 2017 data on the Financial Accounts of the United States, $10.8 trillion of personal assets was sitting in bank time and savings deposits and money market mutual funds in the U.S. In addition, a Wall Street Journal analysis (January 17, 2018) estimates that 311 companies have a total of more than $2.5 trillion in unremitted foreign profits, a significant portion of which will be repatriated back to the U.S. due to the recent tax law changes.
Risk, Reward, and Roll Along the Curve
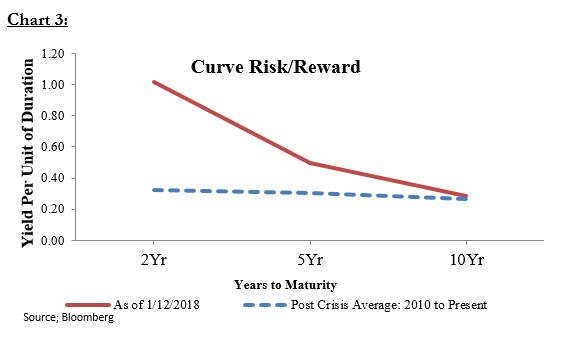
In analyzing the curve, one rather simple means of identifying relative value is to consider what percentage of the yield of the entire curve is available in short and intermediate maturities. For example, a 2-year Treasury yielding 2.0% would provide roughly 80% of the yield of a 10-year bond (2.0 vs. 2.5%), yet with just over one-fifth the duration risk (2.0 years vs. 9.0 years). This is another way of describing the “yield per unit of duration” at various maturity dates. The same 2-year Treasury in this example offers one unit of yield per each unit of duration (2.0% yield/2.0 years duration), for a 1:1 ratio. The yield-per-unit of duration measure becomes less favorable further out the curve, as illustrated in Chart 3 below. It is noteworthy that the current short-end risk/reward metric compares very favorably to the average measure in the post-crisis environment since 2010. Until recently, investors received approximately the same yield per unit of duration whether they were invested in 2-year or 10-year bonds.
Another consideration: not only do the risk/reward metrics decline as you extend on the curve, but when the curve is flat the roll down opportunity – the excess return a bond earns as it ages along a positively sloped curve – is also less rewarding. Consider the 7-year spot on the two curves in Chart 1 above. The 7-year Treasury yield was just 12 bps lower at the end of 2017 than it was four years prior (2.33% and 2.45%, respectively), but the roll potential was significantly different. In December 2013, the 7-year Treasury offered 210 bps of roll return over the next 12 months, assuming an unchanged yield curve, whereas in December 2017 the expected roll had declined to just 30 bps. The total return prospects for the 7-year Treasury had declined by 192 bps (12 bps yield + 180 bps roll) relative to four years ago.
Duration and Curve Allocation – Two Separate Decisions
Given the value among short-term maturities highlighted above, it would be natural to ask whether intermediate and/or long-term holdings should be sold and the money redeployed down the curve. In our view, however, an investor’s target duration and the yield curve allocation are two different decisions. The target average duration of a bond portfolio should be driven by the expected investment horizon of the investor. Put differently, the average duration of the assets should roughly align with the average duration of the liabilities it is intended to fund. For example, if there is a known tax liability to the IRS within a year, then it would be most appropriate to have assets invested with 12-month average duration. But if a fixed income portfolio is intended to fund a long-term liability stream, such as an endowment, retirement savings plan, or the income needs of a retiree, then a longer duration investment portfolio is perfectly appropriate. That said, an investor should continually evaluate the relative value at different points along the curve to determine the optimal curve position to maintain the desired overall duration target.
Summary
If one had to select just one market indicator to help forecast the outlook for growth and inflation over some reasonable time frame, the yield curve would be among the best available. Yet, it is not infallible. The unusually steep curve four years ago sent a false signal of faster growth and higher inflation. Instead, the flattening trend since then has been caused by moderate growth with low inflation combined with abundant global liquidity and strong demand for both duration and income. We don’t yet see signs of a recession on the near horizon that a flattening curve has historically signaled. In fact, growth is improving and the cycle length may ultimately become the longest on record.
We now see the financial repression that held short-term rates unusually low as mostly over, with positive real rates now available after being deeply negative for an extended period. We also know that investing in a relatively flat yield curve environment presents both opportunities and challenges. We see value currently in the front end of the yield curve. Short-term bonds offer the highest nominal and real returns that we have yet seen in this cycle. Conservative investors with excess cash may now want to consider reallocating a portion of that money to the short end of the yield curve. Investors in intermediate and longer-term core bond portfolios should only consider changing the average duration of their assets if the average duration of their liabilities has also changed. Otherwise, maintaining the same target duration while considering ways to capture the value along the yield curve is the appropriate strategy in the current environment.
Disclosures
This is not a complete analysis of every material fact regarding any company, industry or security. The information has been obtained from sources we consider to be reliable, but we cannot guarantee the accuracy.
Fixed income is generally considered to be a more conservative investment than stocks, but bonds and other fixed income investments still carry a variety of risks such as interest rate risk, credit risk, inflation risk, and liquidity risk. In a rising interest rate environment, the value of fixed-income securities generally decline and conversely, in a falling interest rate environment, the value of fixed-income securities generally increase. High yield securities may be subject to heightened market, interest rate or credit risk and should not be purchased solely because of the stated yield.
Indices are unmanaged, and are not available for direct investment. Past performance is not a guarantee of future results.
Past performance is no guarantee of future results. All fixed income investments carry a variety of risks such as interest rate risk, credit risk, inflation risk, liquidity risk and loss of principal. In a rising interest rate environment, the value of fixed income securities generally declines and conversely, in a falling interest rate environment, the value of fixed income securities generally increases. Robert W. Baird & Co. Incorporated does not offer tax or legal advice.
©2018 Robert W. Baird & Co. Incorporated. Member SIPC.
Robert W. Baird & Co. Incorporated. 777 East Wisconsin Avenue, Milwaukee, Wisconsin 53202. 800-79-BAIRD. rwbaird.com
First Use: 10/2017.
© Baird
Read more commentaries by Baird