Summary: Global equities rose 22% in 2017. Throughout almost that entire period, fund managers held significant amounts of cash and were, at best, only modestly bullish on equities. All of this suggested lingering risk aversion following a recession scare in 2016.
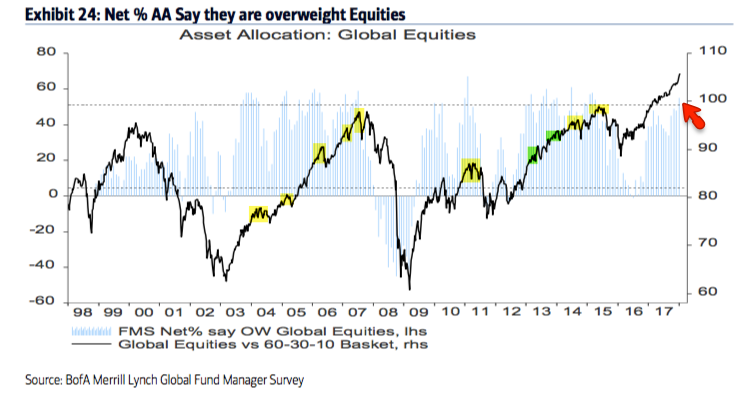
As 2018 begins, cash levels have fallen to the lowest level in 4 years. Allocations to global equities have risen to the highest level in nearly 3 years. In most respects, investors are now bullish.
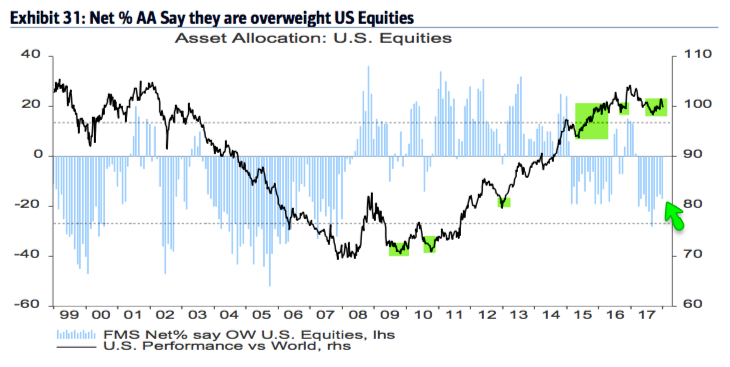
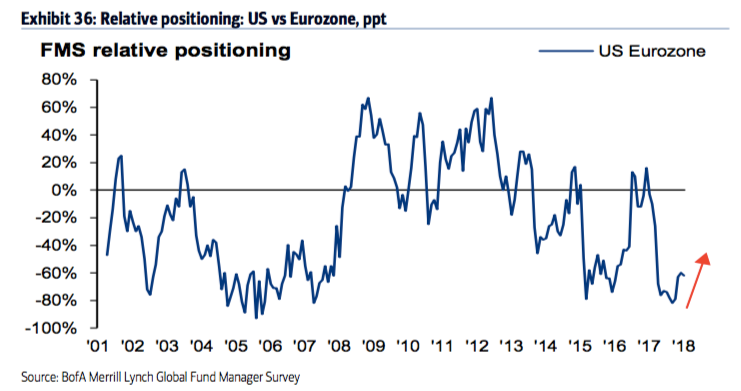
In the past 6 months, US equities have outperformed Europe by 12% and the rest the world by 2%. Despite this, fund managers remain underweight the US. US equities should outperform their global peers.
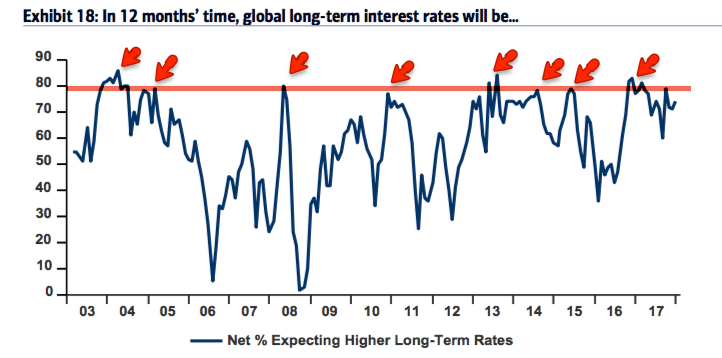
Fund managers are underweight global bonds by the greatest extent in 4 years. Only 4% of fund managers believe global rates will be lower next year, a level at which yields have often fallen, at least temporarily.
Among the various ways of measuring investor sentiment, the BAML survey of global fund managers is one of the better as the results reflect how managers are allocated in various asset classes. These managers oversee a combined $600b in assets.
The data should be viewed mostly from a contrarian perspective; that is, when equities fall in price, allocations to cash go higher and allocations to equities go lower as investors become bearish, setting up a buy signal. When prices rise, the opposite occurs, setting up a sell signal. We did a recap of this pattern in December 2014.
Overall
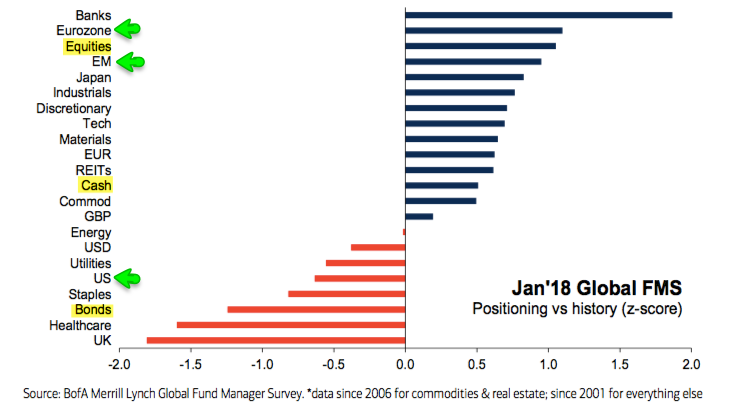
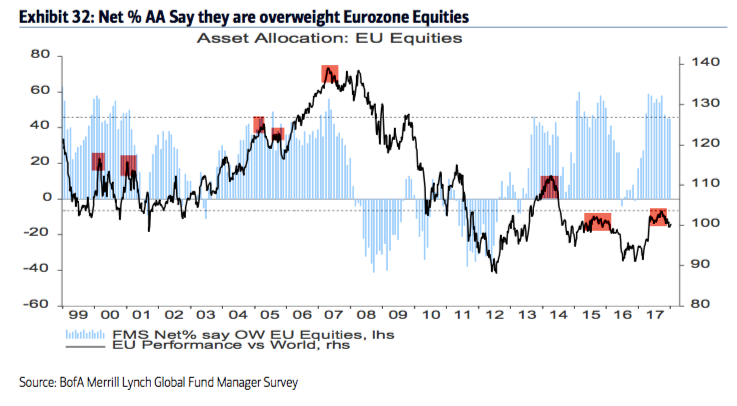
Within equities, the US is significantly underweight while Europe, Japan and emerging markets are all significantly overweight.
A pure contrarian would overweight US equities relative to Europe, Japan and emerging markets, and overweight global bonds relative to a 60-30-10 basket.

Cash
Fund managers' cash levels rose to 5.8% in October 2016, the highest cash level since November 2001. This set up a contrarian long in equities.
Cash remained above 5% for almost all of 2016 and into early 2017, the longest stretch of elevated cash in the survey's history. Cash remained near 5% until October 2017.
In November 2017, cash fell to 4.4%, the lowest level since October 2013. It remains at this level in January 2018. At current cash levels, a tailwind behind the rally is gone. A further drop in cash in the month(s) ahead would be bearish.
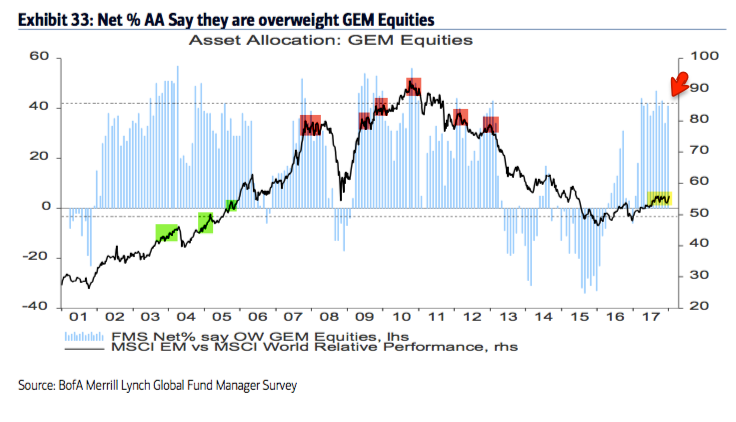
In January 2016, allocations to emerging markets fell to their second lowest in the survey's history (-33% underweight).
As the region outperformed in 2016, allocations rose to +31% overweight in October 2016, the highest in 3-1/2 years. That made the region a contrarian short: emerging equities then dropped 10% in the next two months.
Allocations fell to -6% underweight in January 2017, making the region a contrarian long again: the region has since outperformed.
This month, allocations are +41% overweight, near a 7-year high (+0.9 standard deviations above its long term mean). Emerging market equities are at risk of underperforming. They have performed in-line with the US the past 5 months.
Global bonds: Bonds are a long on a purely contrarian basis. A recap:
In July 2016, global bond allocations rose to -35% underweight, nearly a 3-1/2 year high. Bonds subsequently underperformed a 60-30-10 basket.
A capitulation low in the past has often occurred when bonds were -60% underweight, a level reached in March and April 2017 (shading and dashed line). In other words, bonds became a contrarian long.
In September 2017, fund managers' allocations to bonds rose -48% underweight bonds, the highest in 10 months (-0.3 standard deviations below its long term mean, i.e., close to neutral). Bonds have since underperformed.
Now in January 2018, allocations to bonds dropped to -67% underweight (-1.2 standard deviations below its long term mean), a 4 year low (since late 2013). This is a possible capitulation low.
When bonds were last this underweight, US 10 year yields peaked at 3% in December and then fell to 1.6% over the next 13 months.
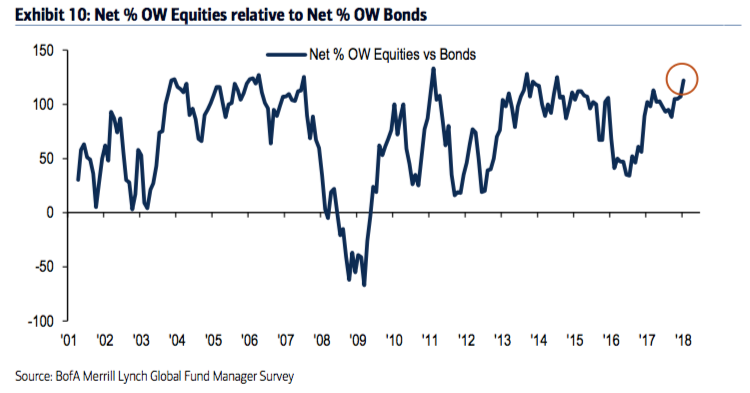
Fund managers' allocation to equities relative to bonds in the highest since August 2014 - when the outperformance of US equities relative to 10-year notes was nearing an end that lasted almost 2 years - and among the highest in the survey's history.
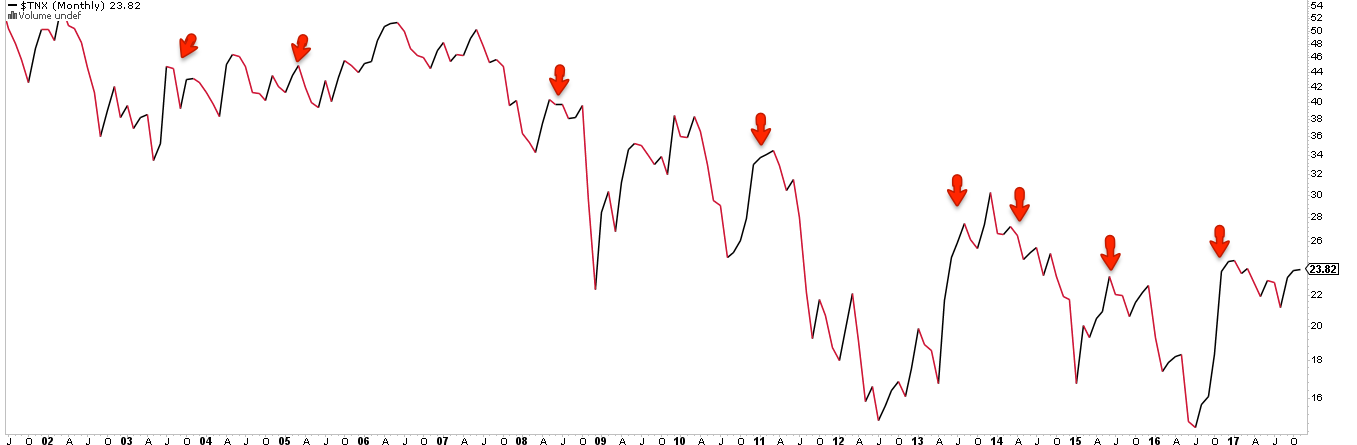
Only 4% of fund managers believe global rates will be lower in the next year; 78% think rates will be higher. This has most often coincided with lower yields, at least temporarily (second chart).
Survey parameters are below.
-
Cash: The typical range is 3.5-5.0%. BAML has a 4.5% contrarian buy level but we consider over 5% to be a better signal.
-
Equities: Over +50% overweight is bearish. A washout low (bullish) is under +15% overweight.
-
Bonds: Global bonds started to underperform in mid-2010, 2011 and 2012 when they reached -20% underweight. -60% underweight is often a bearish extreme.
-
Commodities: Higher commodity exposure goes in hand with improved sentiment towards global macro.
© The Fat Pitch
Read more commentaries by The Fat Pitch