One of the most important discoveries in finance over the past few decades is that stocks of firms that share certain fundamental characteristics called “factors” exhibit different return and risk characteristics than the overall market. Critical to investors is the fact that, over long periods of time, certain of these factors have earned excess returns compared to the overall market.
Broadly speaking, these factors can be distilled into the following categories:
-
Value: Stocks that are low-priced in relation to earnings, dividends, cash flow or book value, on average, have outperformed growth stocks over long time horizons.
-
Size: Stocks of small and mid-size companies have earned, on average, higher returns than stocks of large companies over long time periods.
-
Momentum: Stocks that have exhibited positive momentum – i.e., have performed relatively well over the past 3 to 12 months – have outperformed, on average, over long time horizons stocks that display negative momentum.
-
High Yield: Stocks of companies that pay higher dividends, on average, have earned superior returns to lower and non-dividend paying stocks over the long run.
-
Quality: Stocks that have evidenced superior profitability in relation to capital have outperformed, on average, firms with poorer profitability in relation to capital over long time horizons.
-
Low Volatility: Stocks that have exhibited low volatility have on average outperformed stocks that display high volatility over the long run.
There are two primary explanations for the higher returns associated with these factors. One is that the higher returns represent risk premiums – i.e. compensation to investors for incremental risks beyond that of the total stock market. For example, small company stocks are not only more volatile than stocks of large companies but are also much less liquid. Value stocks tend to include a higher proportion of heavily indebted companies which dramatically underperform the overall market during periods of extreme market stress.
The second explanation is offered by behavioural finance. Investors’ cognitive biases such as “myopia” and “overconfidence” can lead to the persistent mispricing of certain securities. For example, many investors, attracted to the episodic outsized returns of high volatility and low quality stocks, chase these types of stocks despite a pattern of longer-term underperformance. Overly optimistic investors overestimate the earnings prospects of growth stocks while underestimating those of value stocks; value stocks then generate superior returns as investors eventually realize that earnings in the value universe are better than initially expected.
Social phenomena such as the “bandwagon effect” can also distort prices. The “madness of crowds” - as evidenced by the railway mania of the 1840’s, the Florida real estate boom of the 1920’s, the Japanese bubble of the 1980’s and the internet mania of the 1990’s - is a well-documented recurring market spectacle. The herding behaviour of investors has also been advanced as an explanation for the returns associated with the momentum factor.
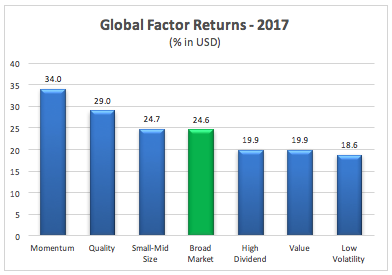
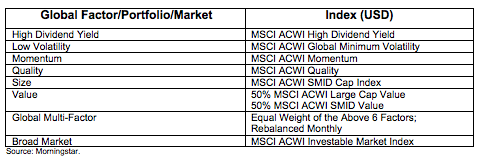
Factor performance can vary because of business cycle influences, market sentiment, interest rate changes, sector composition and other variables. The following chart sets out the return earned by each factor globally in 2017 compared to the overall broad market. (See Appendix I for Sources).

Momentum returned a whopping 34.0% globally, although the benchmark – the broad market in its entirety – was no slouch itself, returning 24.6%. It is no surprise that while momentum outperformed the broad market in every region it did so most strongly in the US where technology stocks are so prevalent. Quality came in second with a 29.0% return. Small and midsized capitalization stocks took third, albeit at such a de minimis increment they in effect posted equivalent performance to the broad market.
There was a trio of laggards, although 2017 was such a robust year for equities (“global synchronized growth”) that none of them could be characterized as “losers”. High dividend yield fell short of the broad market with a 19.9% return [Tacita commented on the excessive infatuation with this strategy in the January 2012 commentary “The Dividend Yield Love Affair”]. Value too fell short by the same quantum. And finally, low-volatility – for so many angst-ridden years since the Great Financial Crisis the #1 performing factor by annual relative return – came in last.
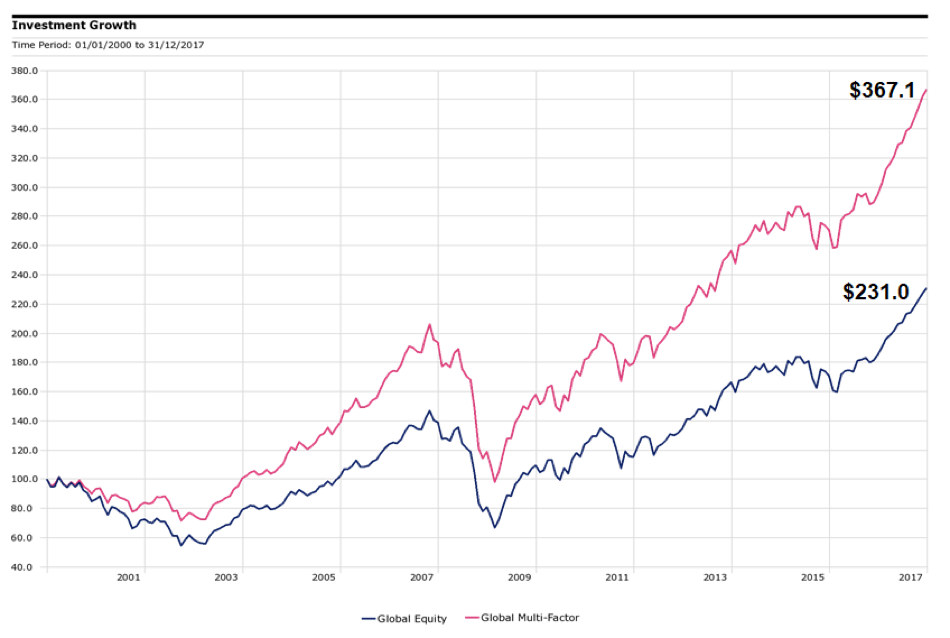
Although the global multi-factor portfolio slightly underperformed the broad market in 2017 (24.3% vs. 24.6%), it outperformed in 13 of the 17 previous calendar years. Cumulatively, as illustrated by the following graph depicting the growth of $100 invested since 2000, the global multi-factor portfolio has created nearly 59% more wealth versus the broad market.
A decade ago, “factors” were a fascinating corner of the capital markets but of little practical use to individual investors. Since then, with the advent of low-cost exchange traded funds and the creation of transparent, rules-based factor indices by several index providers, a multi-factor portfolio has moved from academic theory to concrete application. Investors finally have an empirically sound approach to pursue market beating returns.
17th January 2017
www.tacitacapital.com
Appendix I
Disclaimer
|
Tacita Capital Inc. (Tacita) is a private, independent family office and investment counselling firm that specializes in providing integrated wealth advisory and portfolio management services.
Tacita research has been prepared without regard to the financial circumstances and objectives of any individual investor. The asset classes/securities/instruments/strategies discussed may not be suitable for all investors and certain investors may not be eligible to purchase or participate in some or all of them. It is not possible to invest directly in an index. Whether a particular investment or strategy is appropriate depends on individual circumstances and objectives. Investors should therefore independently evaluate particular investments and strategies or seek the advice of a financial advisor.
All investments involve risk including loss of principal. Past performance is not necessarily a guide to future performance; estimates of future performance are based on assumptions that may not be realized. Management fees and expenses are associated with investing.
Tacita research is based on public information and is prepared for informational purposes. While we make every effort to use reliable, comprehensive information, we do not warrant that it is accurate or complete. We assume no obligation to inform anyone should the opinions, estimates or information provided change.
Tacita research is not intended to provide tax, legal, or accounting advice. Investors should obtain their own professional advice in this regard.
Neither the information provided nor any opinion expressed in our research constitutes a solicitation by Tacita for the purchase or sale of any securities or financial products.
© Tacita Capital Inc.
|
|
Read more commentaries by Tacita Capital