Recent macro economic data in the US has been very good. In just the past month, retail sales have risen to new all-time highs, new home sales have risen to a new 10 year high and unemployment claims have fallen to more than a 40 year low. Last month, manufacturing notched an annual growth rate of 2.7%, the highest rate in over 3 years.
It would be sensible, therefore, to expect the Federal Reserve to raise its funds rate at its December 13th meeting; in fact, the implied probability of this is now close to 100%. Three further rate hikes are also expected in 2018.
Under this backdrop, investors would logically expect treasury yields to also rise.
That might well be the case, but the path is unlikely to be that straight forward.
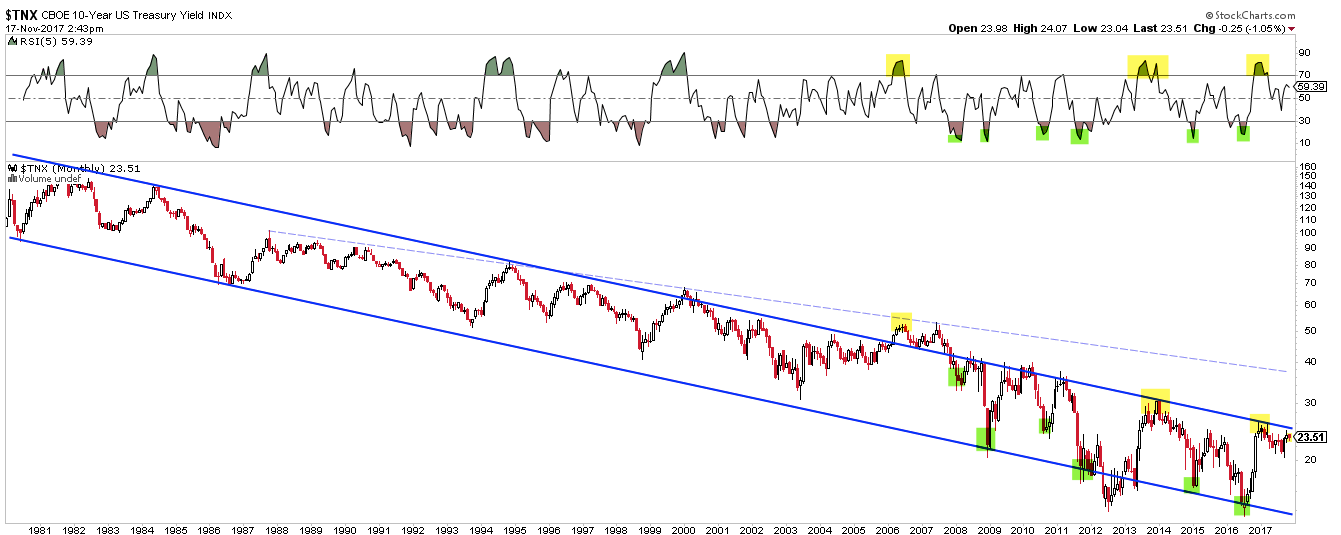
Consider, first, that the Fed has already raised its funds rate 4 times in the past 2 years. Treasury yields were lower several weeks later every time. Enlarge any image by clicking on it.

That pattern is not anomalous either.
The Fed raised its funds rate 17 times between June 2004 and June 2006 (green vertical lines). 10 year yields mostly fell after these rate increases. Between the first rate hike and the 14th, yields had declined on a net basis. Yields, in fact, did not even bottom until the 9th rate hike. Most of the overall gain in yields during 2004 and 2006 took place in the final 5 months of the cycle (rising 90 bp). The final rate hike (labelled #17) marked the high in yields which has still not been surpassed in the subsequent 10 years. More here.

Second, while recent macro data has been very good, streaks of positive macro data have a very strong tendency to revert to disappointing data, and vice versa. This is a point we have made repeatedly in our monthly macro update (here):
Macro data was ahead of expectations to start the current year. During the current expansion, that has led to underperformance of macro data relative to expectations into mid-year and then outperformance in the second half of the year (green shading). 2009 and 2016 had the opposite pattern: these years began with macro data outperforming expectations into mid-and then underperforming in the second half (yellow shading).

Macro expectations are now nearly as high as at the start of 2017, which was a 4-year high. The 10 year yield subsequently fell, from 2.6% in January to 2.1% by mid-year when expectations bottomed and starting cycling higher.