Summary: The major US indices closed at new all-time highs (ATH) again this week, led by the surging technology-heavy Nasdaq. SPX is now higher 7 months in a row; that level of momentum has not marked a bull market high.
Several short-term studies - using trend, sentiment, volatility and breadth - suggest a lower close than today may be ahead in the next few weeks. Any weakness is likely to be temporary.
* * *
SPX, COMPQ, NDX and DJIA all closed at new all-time highs (ATH) again on Friday. The dominant trend remains higher. Enlarge any image by clicking on it.

The very broad NYSE (comprised of over 2800 stocks) last closed at an ATH 10 days ago. It's accurate to say that there is some weakness in breadth, but note that the NYSE closed just 0.5% from its prior high.
The trend in SPX is very strong. SPX has closed below it's 5-dma on just two days within the last 5 weeks. It has not closed below its rising 13-ema since the day after Labor Day (43 days ago). Uptrends do not typically reverse quickly; they weaken first. It would be normal for SPX to first crisscross its 5-dma and then its 13-ema before a bigger drawdown takes place.
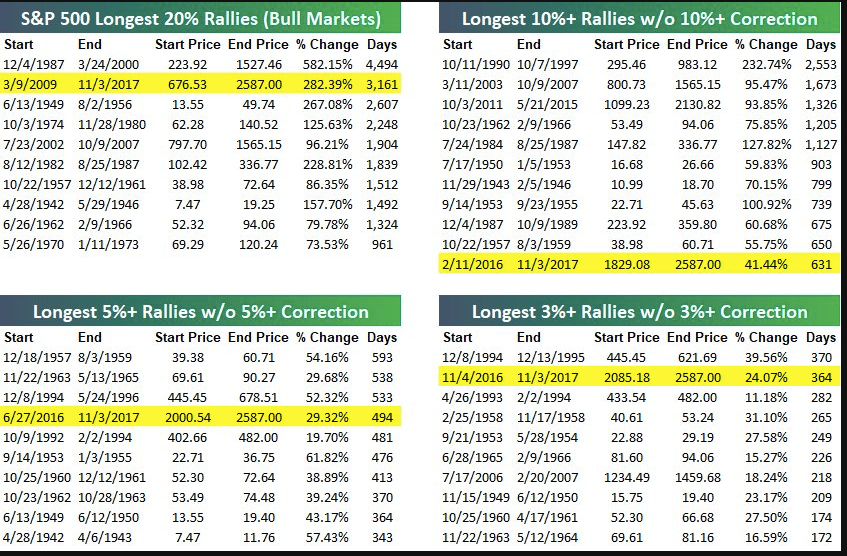
That fact is seen longer-term, as well. The current uptrend ranks as one of the longest ever without a 3%, 5%, 10% or 20% correction. Note that only 1 out of the top 10 longest streaks without a 3% correction led directly to a 10% correction (1966). The same is true for 5% corrections not leading directly to 20% corrections (1955 being the one exception). In short, the trend weakens first. Without any weakness so far, the risk of a significant immediate correction is low (from Bespoke).
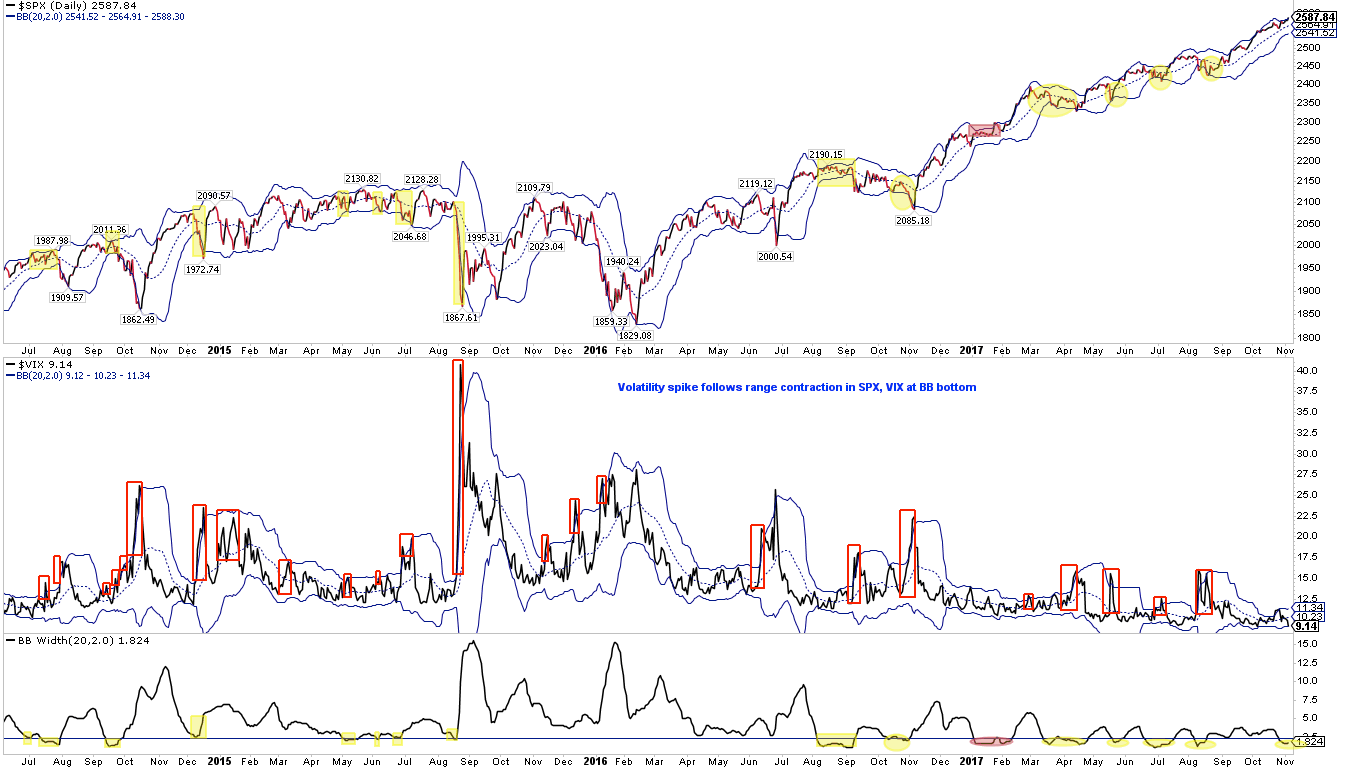
In the chart above, note that the current stretch of low volatility is not unprecedented. It was a feature of the 1940s, 50s, 60s, 80s, 90s and 00s. It's uncommon and can feel odd in real-time, but a period like the current one has happened every decade. The malicious work of the Fed or indexing is not at play.
Importantly, the current uptrend is also consistent with the macro environment. Employment has grown a record 85 months in a row, the longest streak on record. In the past month, new home sales have notched a 10 year high, auto sales a 12 year high and durable goods growth a 5 year high. Some deterioration in macro is typical 6-12 months ahead of a recession. More on this in a new post
here.
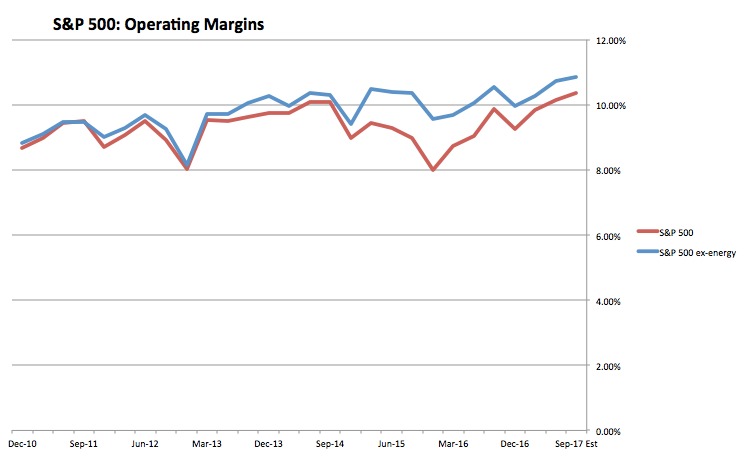
Corporate results are also very good. In 3Q17, sales grew 6% and EPS (GAAP) grew 12% yoy. Profit margins are at a new high, even without the tailwind of energy. There will be a new post on this in the coming week (data from S&P).
Moreover, for the time being, the political environment is calm. With the economy, corporates and politics all benign, it's not surprising that equity markets are also calm and doing well.
Throughout the year, we have been highlighting a now considerable list of positive studies suggesting that US equities will likely finish the year higher. The longer-term outlook for US equities remains positive.
SPX rose more than 8% during May-October. This period is often considered the "weakest 6 months of the year"; when SPX has done well during this period, the next 6 months have also been strong, with SPX gaining a median of 12% and closing the period with a gain 91% of the time (next two charts from Stock Almanac).
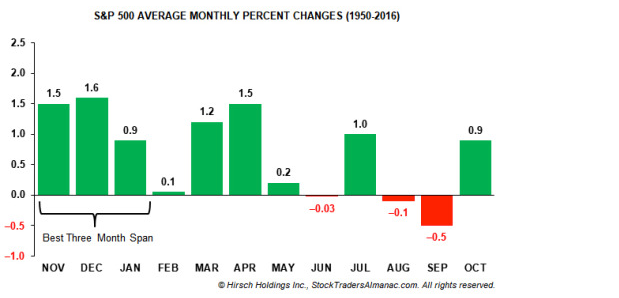
Seasonality is typically a tailwind into year-end. November-January is considered the best 3 months of the year, with SPX gaining an average of 4%.
The year-end tends to be even better when momentum is already strong. In years like 2017, when there was not even a 5% correction in August-October (the worst 3 months of the year), median gains rise to 4.3% through year-end versus 3.1% for all years (from NDR).
SPX rose for a 7th month in a row in October. Since 1980, this has happened 8 other times with SPX rising an 8th month 5 times (63%). None of the prior 7 month streaks marked a significant top. It's a small sample, but notable tops in 1987, 1990, 1998, 2000, 2007, 2011 and 2015 fit the pattern described previously: small weakness followed by larger weakness, with the top marked by a much shorter monthly uptrend (less than 4 months and more typically alternating up/down each month as participants search for direction).
All of this suggests that US equities are not at risk of topping very soon. Any surprising interim weakness (which is always possible), is likely to be a buying opportunity. The first sign of weakness usually is.
All of that said, there are a few new studies suggesting that short-term weakness may be ahead.
First, SPX has risen 8 weeks in a row. This has occurred just 10 other times since 1970. Within the next 2 weeks, SPX closed lower 90% of the time (weekly close basis). The minimum interim drawdown over the next 4 weeks was -0.7% with a median of -2.3%. Interim risk/reward skews negative over the next 4 weeks. In short, the current uptrend appears likely to take a break (from @SJD10304).
That weakness should be short-lived as momentum is likely to carry the index higher. In the table above, SPX closed higher within the next 4 weeks 90% of the time.
On Friday, the volatility index closed two standard deviations below its one-month mean. This is rare, with the last occurrence on August 5, 2016: SPX traded sideways for a month, then dropped 3%. Vix doubled during this time. More generally, SPX typically underperforms for a brief period of time following similar extremes in volatility (from Cam Hui).
Likewise, the trading range for SPX has tightened significantly (lower panel). This has typically been followed by a pop in volatility (middle panel) and normally a drop in SPX (top panel). Many times, SPX moves to its lower Bollinger Band, about 2% lower (currently 2540).
Breadth momentum has weakened over the past two weeks: while SPX has risen, the Summation index has been falling (bottom panel). This has consistently led to equity weakness (sometimes with a lag; see arrows). Even in 2017, SPX has subsequently fallen 1-2%. At a minimum, SPX appears likely to return to 2550.
Sentiment has been mixed over the past several months, which might help account for the persistent rise in the equity markets. However, the one-month weighted equity only put/call ratio has now dropped to a multi-year low, indicating excessive bullish behavior among investors. It hit the same low in June - SPX traded 1% lower during the month, to its 50-dma - but in January 2014, SPX lost 6% within a month (arrow in second chart) and in December 2014, SPX lost 5%. At best, upside gains for SPX are likely to be limited (from McMillan).
A sentiment study from last month is still active. Recall that the CNN Fear & Greed index hit 94 on October 6th. Using the backtest engine from Sentimentrader, prior instances in the past 5 years have preceded a lower close in SPX within the next month 91% of the time and within six weeks 100% of the time. A close below 2520 is implied (if you wish to become a Sentimentrader subscriber, please use this link which results in a small contribution to the Fat Pitch).
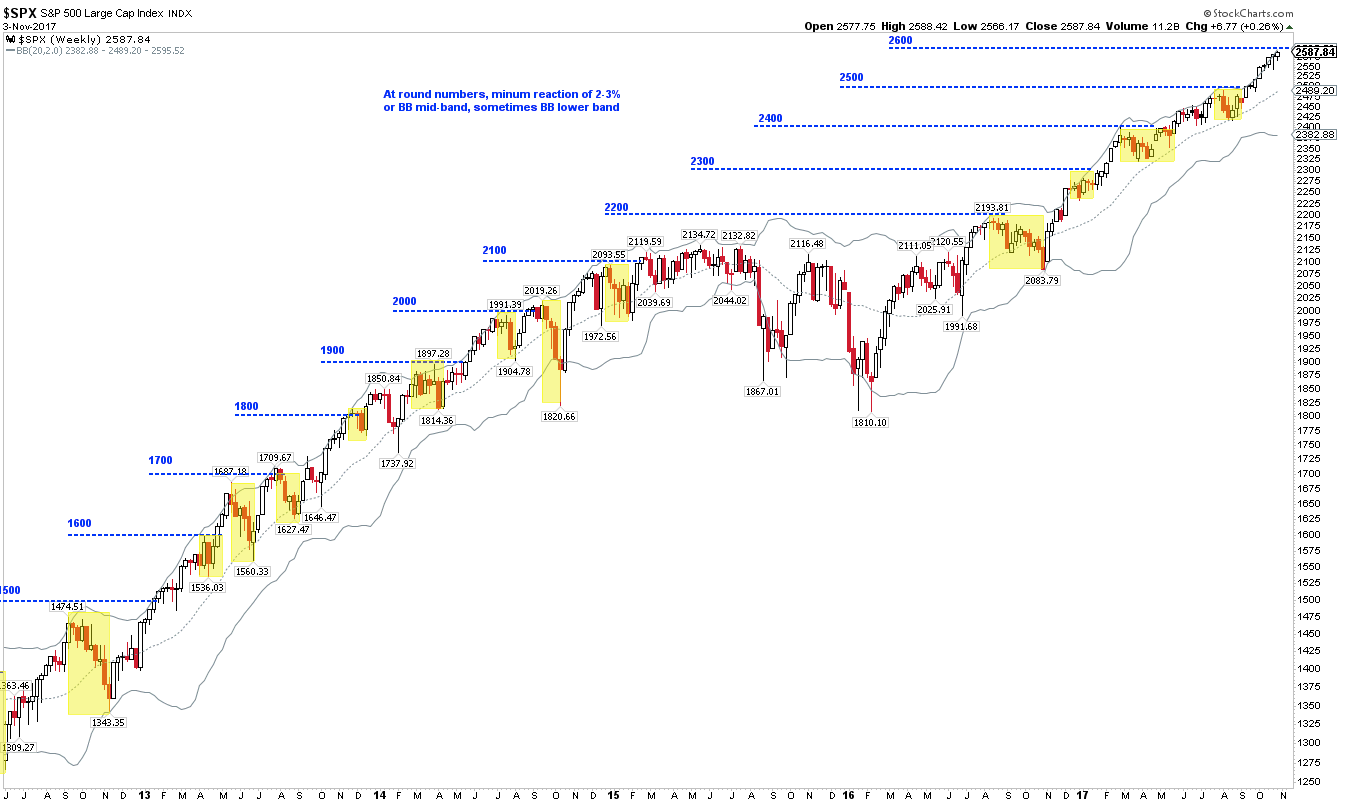
SPX is again approaching "round number" resistance, this time at 2600. It's not perfect, but the index has had a high propensity to correct at least 2% at each round number, which would again target the lower Bollinger near 2540.
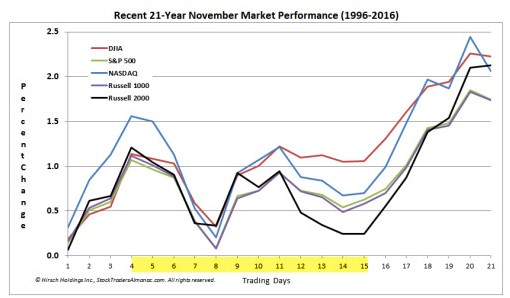
Finally, while November is known for being strong, those gains typically accrue early and late in the month. The next two weeks tend to be seasonally soft (from Almanac Trader).
Net, US equities continue to make new ATHs and the outlook into year-end (and beyond) is favorable. Several short-term studies - using trend, sentiment, volatility and breadth - suggest a lower close than today may be ahead in the next few weeks. Any weakness is likely to be temporary.
The macro calendar this week is light, with no major data to be reported.
© The Fat Pitch
http://fat-pitch.blogspot.com
Read more commentaries by The Fat Pitch