Global equities: Despite a 19 month rally, equity allocations are only slightly above neutral. There is room for further gains. A recap:
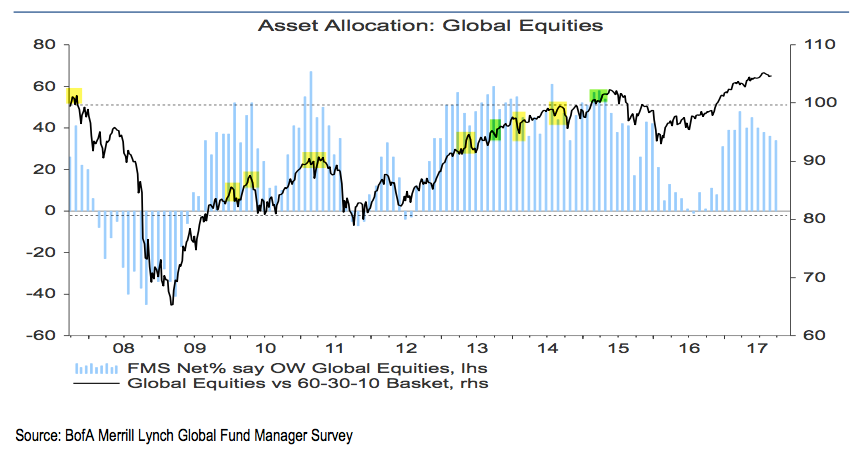
Fund managers were just +5% overweight equities at their low in February 2016; since 2009, allocations had only been lower in mid-2011 and mid-2012, periods which were notable bottoms for equity prices during this bull market.
Allocations in September have increased to +34% overweight, which is only slightly above neutral (0.2 standard deviations above the long term mean).
Outside of 2013-14, over +50% overweight has historically been bearish (dashed line and shading).
Similarly, only a net 27% of fund managers have not bought equities hedges (i.e., downside protection). Current levels are similar to those prevailing prior to the US election last autumn. This further indicates a lack of complacency.
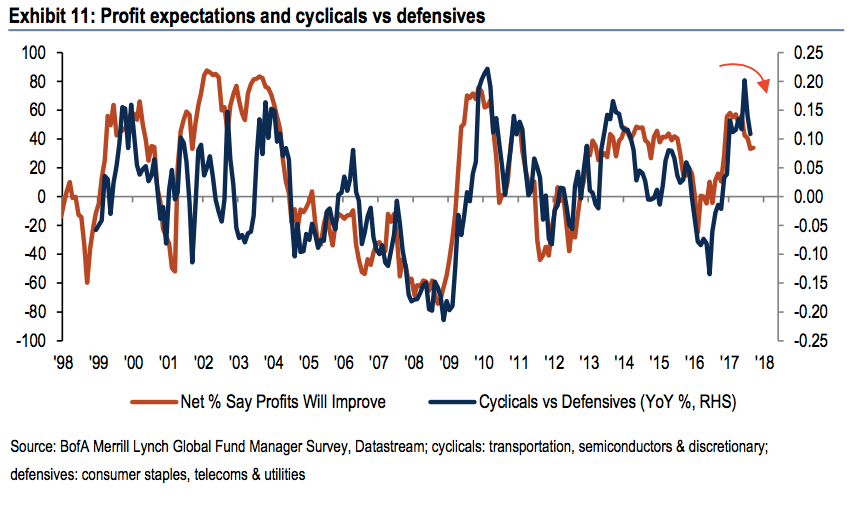
In February 2016, more than 20% of fund managers believed profits would be
weaker in the next 12 months, the lowest since 2012. They are now more optimistic, but not exceptionally so: 34% expect
stronger profits in the next year (red line). Pessimism explained their prior low allocation to equities and high allocation to cash; that has changed a bit.
More (but only a net 25%) expect a better economy in the next year. This explains their generally improved enthusiasm for equities but, like cash levels, investors are far from excessively bullish.
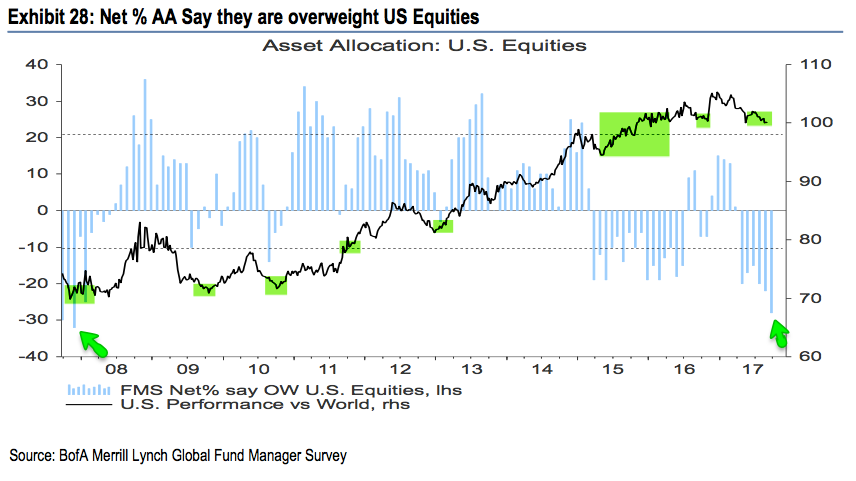
US equities: US equities are strongly out of favor and should outperform. A recap:
Fund managers were consistently and considerably underweight US equities for a year and a half starting in early 2015, during which US equities outperformed.
That changed in December 2016, with fund managers becoming +13% overweight, and they remained overweight through February: bearish sentiment was no longer a tailwind for US equities and US equities underperformed their global peers.
Fund managers have now dramatically dropped their allocation to -28% underweight, the lowest since November 2007 (1.2 standard deviations below its long term mean). This is where US equities typically start to outperform again.
Notably, the S&P has outperformed the Europe's STOXX600 by 10% the past four months.
Above +20% overweight and sentiment typically becomes a strong headwind (dashed line).
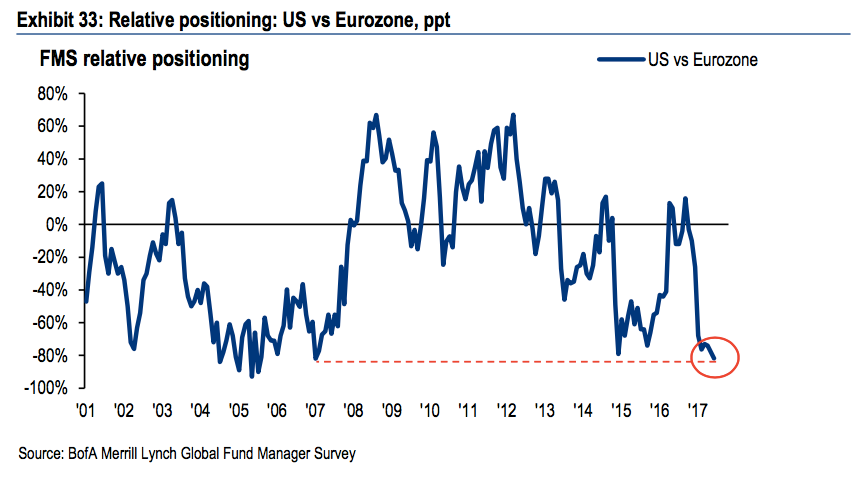
Fund managers' positioning in US equities versus Europe is the lowest since April 2007 (1.5 standard deviations below its long term mean), after which the region began to outperform.
Likewise, fund managers' positioning in US equities versus emerging markets is the lowest since November 2007 (1.5 standard deviations below its long term mean), after which the region began to outperform.
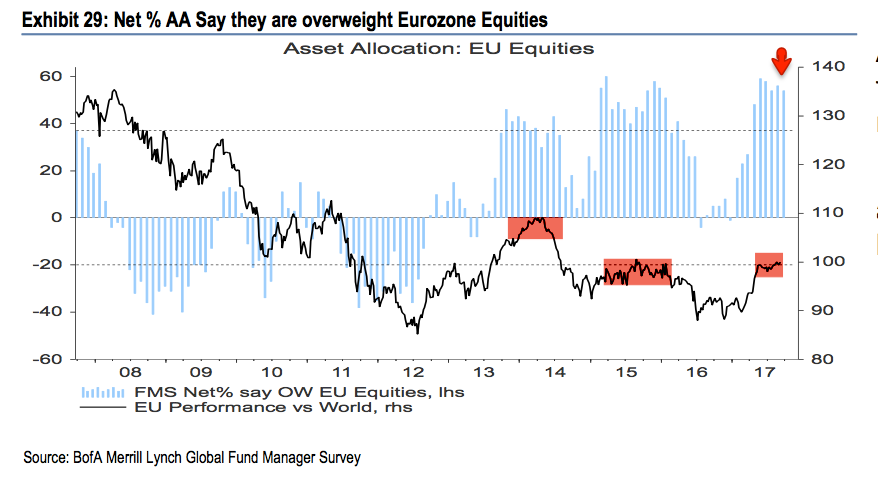
European equities: European equities are at high risk of underperforming. A recap:
Fund managers had been excessively overweight European equities in 2015-16, during which time European equities underperformed.
That changed in July 2016, with the region becoming underweighted for the first time in 3 years. The region then began to outperform.
European exposure rose to +54% overweight in September, near a 3-1/2 year high. This is well above neutral (1.5 standard deviations above its long term mean). European equities are at high risk of underperforming.
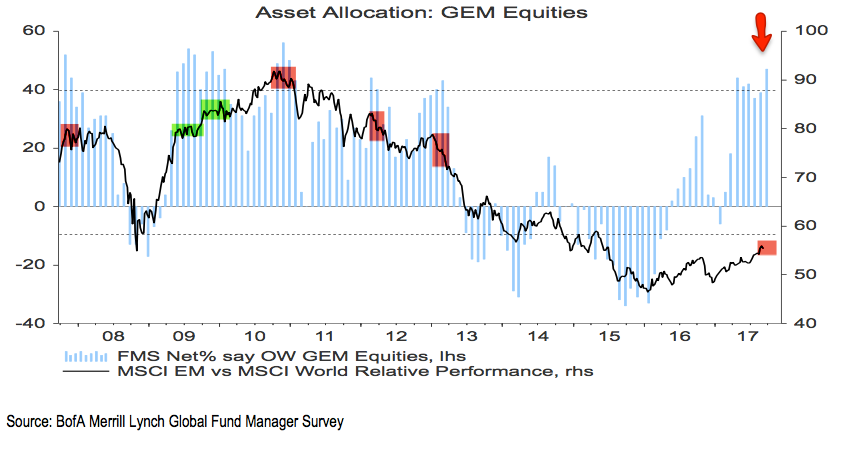
Emerging markets equities: Emerging market equities are at risk of underperforming. A recap:
In January 2016, allocations to emerging markets fell to their second lowest in the survey's history (-33% underweight).
As the region outperformed in 2016, allocations rose to +31% overweight in October, the highest in 3-1/2 years. That made the region a contrarian short: emerging equities then dropped 10% in the next two months.
Allocations fell to -6% underweight in January 2017, making the region a contrarian long again: the region has since outperformed.
This month, allocations jumped to +47% overweight, a 7-year high (1.2 standard deviations above its long term mean). Emerging market equities are at risk of underperforming.
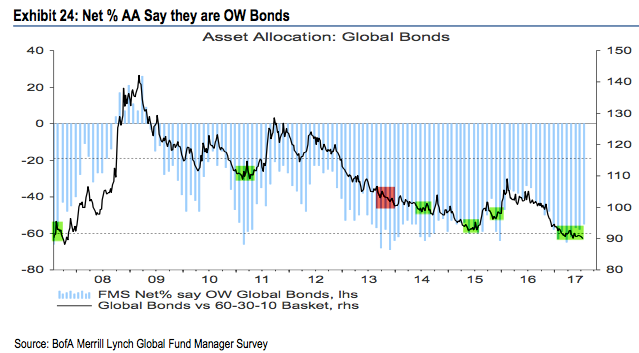
Global bonds: Bonds are a modest contrarian long. A recap:
In July 2016, global bond allocations rose to -35% underweight, nearly a 3-1/2 year high. Bonds subsequently underperformed a 60-30-10 basket.
A capitulation low in the past has often occurred when bonds were -60% underweight, a level reached in March and April (shading and dashed line). In other words, bonds became a contrarian long.
In September, fund managers' allocations to bonds rose -48% underweight bonds, the highest in 10 months. This is now just 0.3 standard deviations below its long term mean (i.e., close to neutral). Note: the chart below is from July.
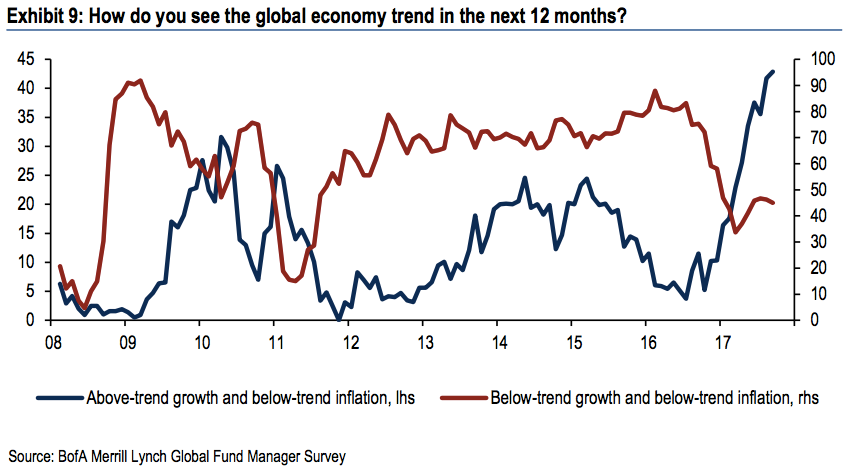
Fund managers' growth expectations relative to inflation are the highest on record (blue line). Similar (but lower) peaks in 2Q 2010, 1Q 2011, 2Q 2014 and 2Q 2015 preceded a fall in yields (second chart).
Commodities: Allocations to commodities dropped to a 1-year low in June (-15% underweight) before rebounding in September (-4% underweight). This is equal to its long term mean (neutral).
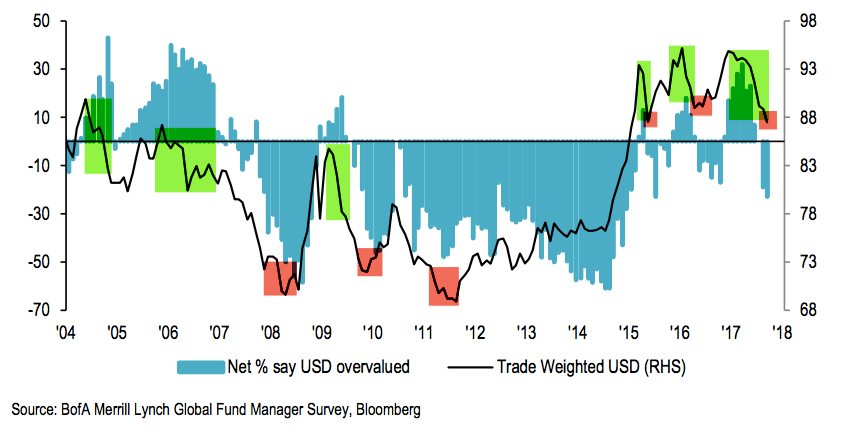
Dollar: The US dollar has gone from overvalued to the most undervalued in nearly 3 years. A recap:
Since 2004, fund managers surveyed by BAML have been very good at determining when the dollar is overvalued (highlighted in green).
In March 2015, they viewed it as overvalued for the first time since 2009; the dollar index fell from 7% in the next two months.
In late 2015, they again viewed the dollar as overvalued and the index lost 7%.
Fund managers had viewed the dollar as overvalued since November 2016; since then, the dollar has lost about 8%. YTD, the dollar is down 12%.
In September, 23% of fund managers view the dollar as undervalued, the most since December 2014. This has been when the dollar has begun to rise (red highlights).
Survey parameters are below.
-
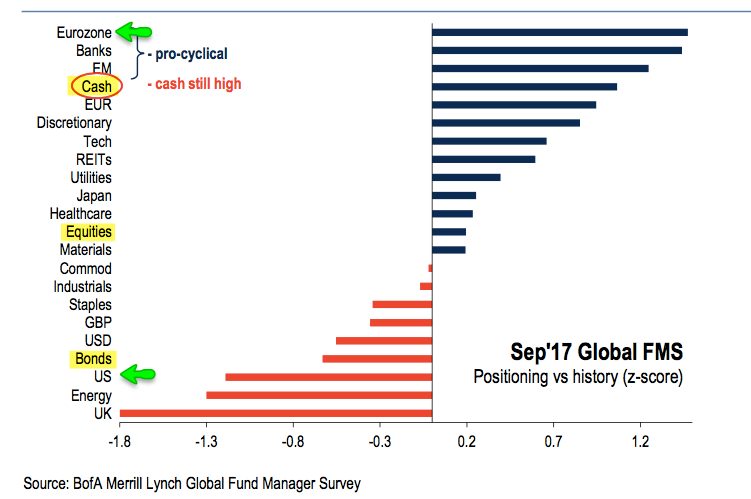
Cash: The typical range is 3.5-5.0%. BAML has a 4.5% contrarian buy level but we consider over 5% to be a better signal. More on this indicator here.
-
Equities: Over +50% overweight is bearish. A washout low (bullish) is under +15% overweight. More on this indicator here.
-
Bonds: Global bonds started to underperform in mid-2010, 2011 and 2012 when they reached -20% underweight. -60% underweight is often a bearish extreme.
-
Commodities: Higher commodity exposure goes in hand with improved sentiment towards global macro.
© The Fat Pitch
Read more commentaries by The Fat Pitch