Our Summer Outlook comes a bit late this year as we were traveling in the weeks after July 4th. Our itinerary included the San Francisco area, the Washington DC area, Castle Rock and Colorado Springs. While we travel a bit every year for business, it struck us that each of these locales displayed a skyline that was bespeckled with cranes and other equipment generally found in abundance when economic sentiment is sound, and investor risk appetite is strong. Of course, our own city of Boston’s Seaport District continues to show dramatic growth as well. Perhaps it was the more relaxed pace of vacation that freed our senses to notice. We thought about the gloom which was very present in the market narrative as recently as last year, and the multitude of cranes, construction equipment and growth presents a very different, and vibrant picture.
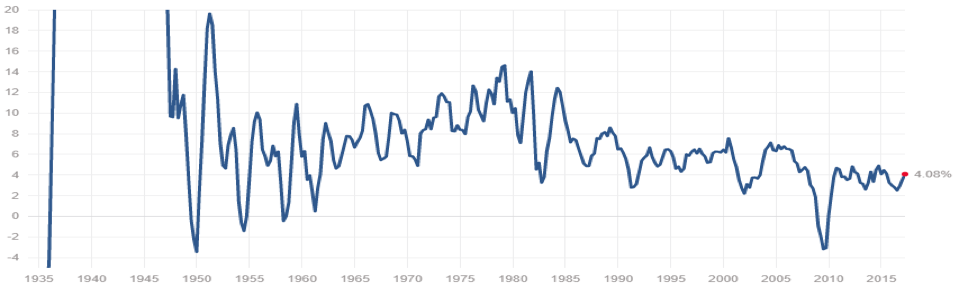
Year-to-date, the US stock market seems to belie the underlying economic data (~2.1% GDP), yet seems to justify the animal spirits at work on the skyline across the country. Already the S&P 500 is up 9.34% year to date, exceeding its 90-year average annual return. In the royal we, our life experience includes schooling in the 1980’s, and a career beginning in the 1990’s. So yes, we’re accustomed to higher average GDP growth than we have in fact experienced over the preceding eight years. Herein lies the conundrum some of us feel given GDP growth rates in the 2% range. With the US economy expanding at a pace well below multi-decade averages and the stock market having posted so many new highs just on a year to date basis, there must be a disconnect somewhere, right? Or is that our bias?
US GDP Growth Rate (nominal)

Perhaps more worrisome is the “Black Swan” fears some of us harbor. Nassim Taleb, one of our favorite authors, describes the statistical significance and inherent unpredictability of calamity which tends to elude all people prior to striking, even those who search for it, in his book “The Black Swan”. Michael Gayed, CFA, a portfolio manager with Pension Partners whom we read frequently recently wrote about the Black Swan in his Week in Review:
“…this is a highly troubling environment. Markets have been absurdly boring. Bond yields haven’t spiked despite reflation hope. Emerging markets have been on a tear, and volatility in the S&P 500 and in the small-cap Russell 2000 is quite literally at all-time lows. This has been the most peacefully quiet (and boring) stock market in history.”
Boring markets might describe the lead-up to the 2008 financial crisis which sent things into a significant tailspin. But we think low volatility needn’t conjure calamity in the markets. We also think the underlying fundamentals of the US market are fine, but one simply needs to shift the paradigm a bit to understand that the “new normal” outlook no longer includes GDP growth edging toward 4%, 5% or even 6%. It also includes prolonged periods of low inflation. Hence “lower for longer” interest rates around the globe. In other words, the severity of the financial crisis and the unusual policy response, both in the US and globally, has resulted in trend-shift in the gap between the “optimal” growth in our economy and what is actually possible—at least for now. We would add that this is entirely our theory. The US is, after all, near the “full employment” mark. So while the low growth rate (in historical context) is persistent, it also seems durable.
We subscribe to Capital Economics research as a third party source of macro-economic thought and we extract three points from their Q3 Outlook which we believe are salient in supporting a positive economic outlook in the short run:
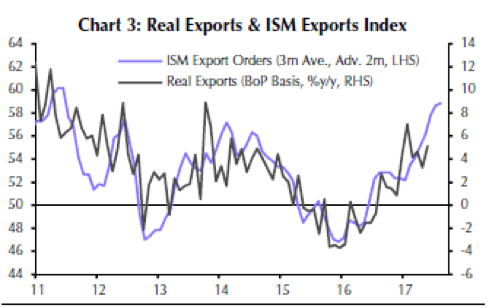
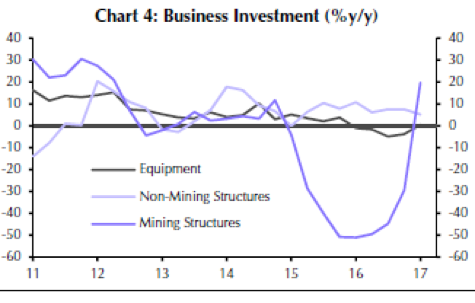
- Two of the biggest drags on growth last year should provide small boosts this year. After the prior surge in the Dollar weighed heavily on exports, the Dollar has declined by 5% on a trade-weighted basis this year. As a result, export growth has rebounded and the survey evidence points to further acceleration soon (See Chart 3). Mining investment has also been rebounding strongly (See Chart 4). And even if lower oil prices weigh on mining activity over the rest of the year, business equipment investment should continue to recover.
- Employment growth has continued to trend lower this year, but that is what we would expect to see when the [labor] market is getting closer to full employment. It has also been more than enough to keep the unemployment rate on a downward trend.
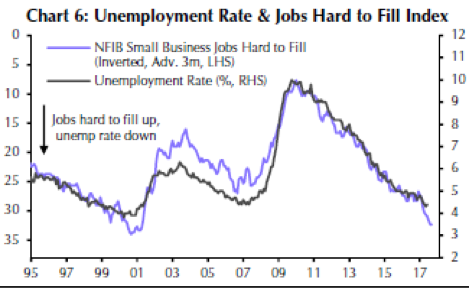
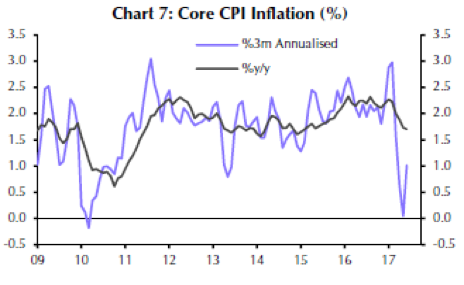
- After stalling at just below 5% for most of 2016, the unemployment rate has fallen sharply this year, reaching a 16-year low of 4.3% in May. The surveys suggest that it will fall even lower soon (See Chart 6.0.) This presents a dilemma for the Fed and its dual mandate because core inflation (and hourly wage growth) has recently dropped back…And with core inflation having been weak for several months now, it is hard to claim this is just a temporary lull.
Capital Economics comes to an out-of-consensus conclusion that the drop in inflation, while likely transient, will keep the Fed from raising interest rates again in September (though not December). If this plays out, we can take the Fed out of the list of boogeymen that could put a dent in this market in the near term. In our view, this leaves Fiscal Policy (or lack thereof) as perhaps the last logical cause for concern.
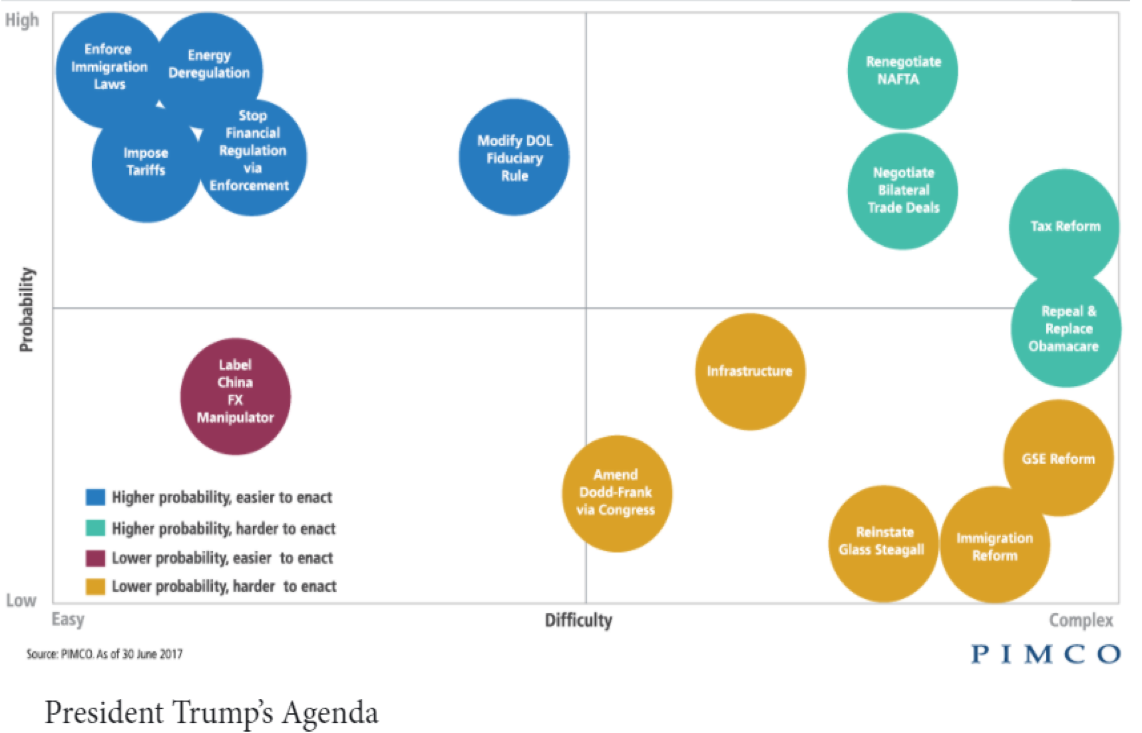
Donald Trump was elected president largely by a segment of the population which lies between places like San Francisco, Boston, and Washington DC, where economic growth and opportunity have not kept pace with the national average. These places cheered the outcome of the election in November largely due to the promises of regulatory relief and fiscal stimulus. It is now late July. Voters (and investors) continue to await a display of governing acumen from the party in power. While unilateral action, where it can be taken, will be an easy fix, much of the Trump administration’s agenda will require the involvement of Congress.
We have given up trying to tie market gyrations to Washington politics, but the sense remains that they will eventually intersect this fall, when we add the budget and debt ceiling to Congress’ “to do” list. Given the inter-party squabbling on Healthcare, this debate could be a doozy! We hope to be pleasantly surprised.
Non-US Equities
We believe the “sleeper” story of 2017 thus far has been the performance of most major non-US equity markets. The US equity markets have sucked up most of the media attention over the previous year given the “sex-appeal” of the US Presidential election, the ensuing stock market rally, and of course the tangential issues of Russian investigations and Trump’s Twitter-war with the media. Facebook, Amazon, Netflix, and Google (the FANG stocks) have wowed investors with their meteoric rise (more on this below). Yet, to comparatively little fanfare, the European Monetary Union (EMU) index has outpaced the S&P 500 by over 7% in the last year, and by almost 9% year-to-date in dollar terms! CCR Wealth Management’s models have tilted to large-cap growth for some time, and FANG is well-represented in our portfolios. Yet the best six and twelve-month performance figures come from our overweight positions in developed non-US equities.
In our view, the reasons for this outperformance can be traced to three catalysts. First, in October 2016 and again in January, we premised the future of global growth as being highly reliant on Productivity, Policy and Politics. Politics loomed large coming into 2017 with a populist mood having led to the Brexit surprise a year ago, Trump’s surprise victory in the November election, and with important elections occurring in the Netherlands and France yet to be held. Thus far, the anti-EU forces have been kept at bay, and Angela Merkel’s seat and the CDU party look safe in Germany’s looming elections this September. We think the markets have rewarded the outlook for political stability.
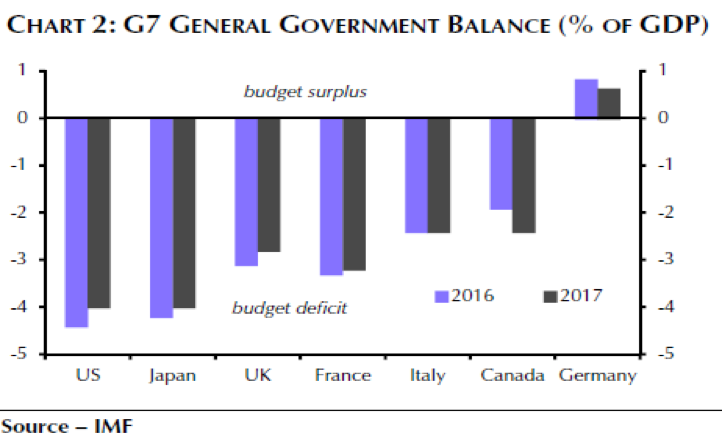
Second, we address Policy. The Euro-zone is seeing an easing of austerity measures enacted years ago to address fiscal deficits. These measures led to the economic contraction of 2014-2015, the emergence from which has been a stubborn grind. Capital Economics comments, “attitudes towards austerity has softened in the euro-zone as the aggregate fiscal deficit has fallen from over 6% of GDP to less than 2% in 2016 and economic growth has accelerated. As a result, fiscal policy is no longer a drag on euro-zone GDP growth.” We note though that less fiscal austerity does not equal fiscal stimulus. Looking ahead, while Germany may loosen fiscal policy somewhat (with modest tax cuts ahead of the election), France’s new President Emmanuel Macron may yet tighten policy more than anticipated due to higher projected deficits going forward.
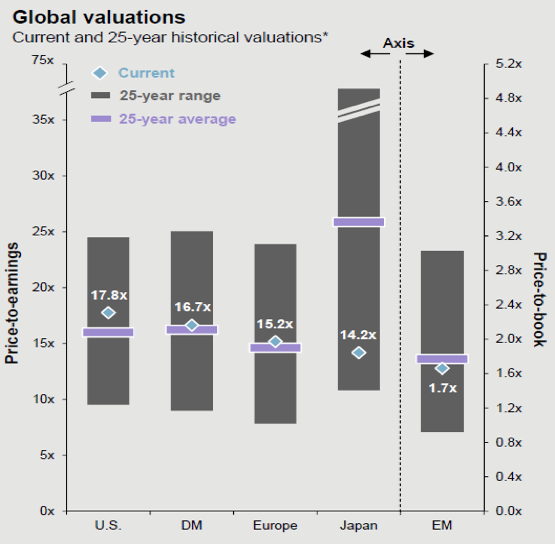
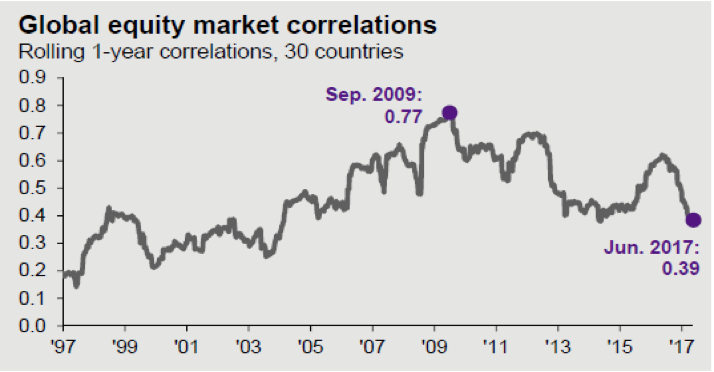
Our last point about non-US equity outperformance (and yes, mostly European) we first made over a year ago as it relates to market cycles. As mentioned, the EU is emerging from a more recent economic contraction, whereas the US market cycle is in its 9th year. Growth is accelerating, and valuations are attractive. Importantly for diversification benefits, correlations with US stocks has fallen significantly over the last five years. For those who complain about US equity valuations, we feel plenty of opportunity awaits overseas. We remain overweight non-US equities (20%-25% of total equities), even after having trimmed somewhat post-Brexit. We will be slow to rebalance this allocation.
A word about emerging markets: they’ve “been on a tear” year-to-date as Michael Gayed was quoted above. CCR Wealth Management does not currently have a discreet emerging markets allocation in our model portfolios and we haven’t had one in nearly two years. Our views concerning emerging markets are constructive, but looking around the world (and considering our own portfolio risk analysis), we do not feel compelled to add the extra risk. We do not see the reward opportunity surpassing that of a European early-market cycle, or US small cap holdings which have performed at least as well without the transient currency risk that could coincide with ever higher US interest rates. According to the prospectuses, our non-US equity managers all include an allowance for an emerging markets sleeve in their portfolios (ranging from 15% to 30%, and all EM positions remain modest, currently). As of the end of June, our widely held top bond fund allocation (the PIMCO Income fund) held a 26% position in emerging market debt.
Fixed Income
The Bloomberg-Barclay’s Aggregate Bond Index is up 2.50% year-to-date through mid-July, though it is down 0.26% over the trailing 12 months. These returns are in-line with our long-held expectations that investors should anticipate returns on this benchmark of 0%-2% for the foreseeable future. While it is interesting that the BarcAgg Index total return year-to-date is positive given the three rate hikes we’ve had since December, we view some of this as price rebound (mean reversion) from the sell-off after the election, which we covered in January. Two other equally plausible explanations include the dip in inflation readings pointed out above by Capital Economics and inaction on Capitol Hill regarding an aggressive (and anticipated) infrastructure program—fiscal stimulus which spiked anticipation of higher inflation back in Q4, 2016.
CCR Wealth Management’s bond portfolio “complexion” remains decidedly credit-centric, as opposed to duration-centric. This is a large distinction from the make-up of the BarcAgg Index. That said, we would point out our bond portfolio has a higher correlation to equity risk than the Benchmark and remind investors concerned about volatility that a higher duration mix will maximize diversification benefits.
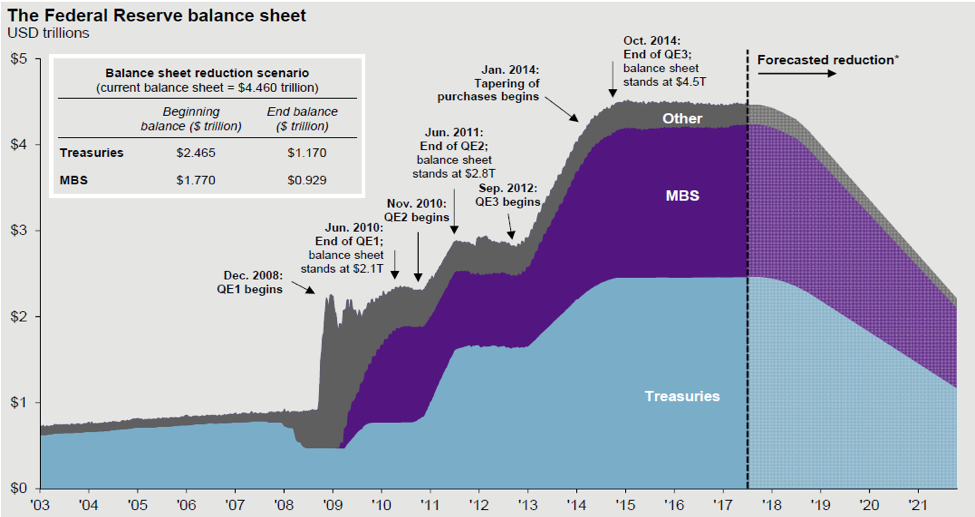
The bigger news in the Fixed Income universe was the announcement by the Fed in June, after its second rate-hike of the year, that they will begin trimming the massive $4.5 trillion Federal Reserve balance sheet. The annoucement was expected—but its timing was sooner than anticipated. The good news, in our view, is the transparency and slow pace of the intended unwinding. While the exact timing is unclear, most market participants expect this unwinding to begin in September, at the very modest pace of $10 billion per month, increasing by $10 billion every three months, up to a cap of $50 billion per month. This is a very measured pace, given that the last round of quantitative easing (“Q3”) saw the Fed adding to $83 billion per month to the balance sheet. In fact, at the beginning this pace amounts to little more than ceasing to reinvest interest and maturing bonds. This tapering will amount to approximately $4 billion in mortgage backed bonds and $6 billion of US Treasuries monthly, or roughly equivalent to the 40%/60% respectively of the balance sheet make-up.
While market watchers will no-doubt be paying attention to the bond markets for perceived effects of this rolloff (particularly the mortgage markets), we doubt there will be any effect on interest rates.
FANG à FAAMG Valuation Insights
Note: We draw heavily from the work Robert Boroujerdi, Jessica Binder Graham, CFA, and John Marshall of Goldman Sachs in this discussion (“Is FANG Mispriced?”, June 9 2017).
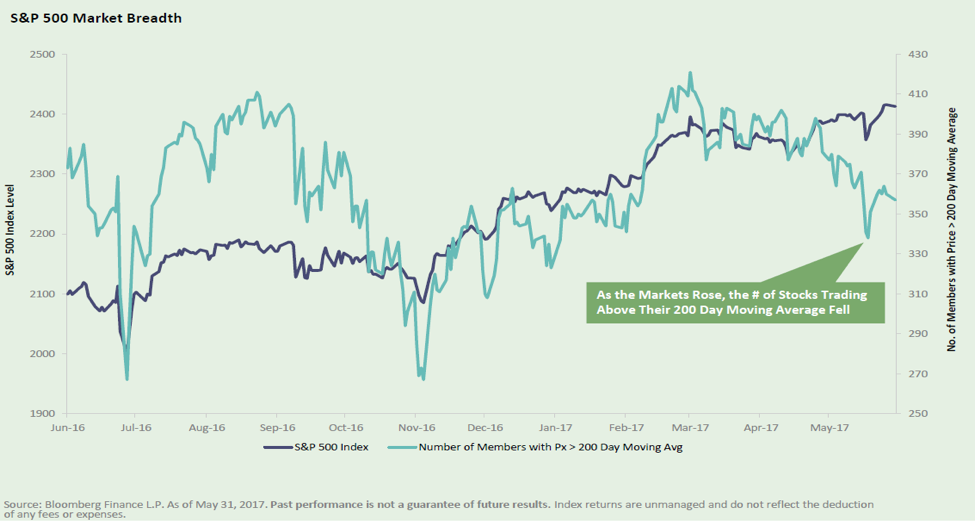
While markets have held their post-election “Trump-Bump” levels, we see a narrowing of participation among S&P 500 constituents, with large-cap tech companies providing much of the support. “FANG” is an anacronym brought into wide use this year to refer to a group of mega-tech companies which have become “category killers” in their respective fields: Facebook, Amazon, Netflix and Google (now Alphabet). For actual market dominance by market-cap (and thus influence on the cap-weighted indices), we adjust the list by dropping Netflix (due to its lower market cap) and adding Microsoft and Apple, which gives us FAAMG, and makes an interesting comparison to the Tech Bubble of the 1990’s that many of us remember well.
We feel it is important to make this comparison because with several aspects, today’s rally in the market (particularly in the largest five technology stocks), has a similar “feel” to the halcyon days of the Tech Bubble which burst in spectacular fashion. In recalling those days, one should also recall the narrowing breadth of the stock market, where one really needed to own the behemoths of the day Intel, Cisco, Microsoft and Oracle to achieve the vast majority of the S&P 500’s annual returns for several years. Through the first week in June this year, FAAMG stocks accounted for over a third of the S&P 500 year-to-date returns (37%), and over half of the NASDAQ 100’s returns (55%). In other words, while we can all be pleased with a stock market rally—relatively few stocks are carrying the load.
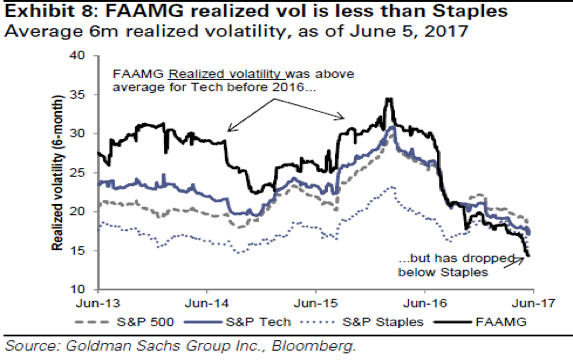
Not only is there low volatility in the S&P 500, but there is exceptionally low volatility among technology stocks. Goldman Sachs quantifies this, pointing out that for the last year, FAAMG realized volatility (measured as standard deviation) has actually been below both that of the S&P 500 and Consumer Staples group —a sector known for reliably low volatility.
In some ways this may feed into Michael Gayed’s fears of a “highly troubling environment” and “absurdly boring” markets. And yes, there has been plenty of talk about valuations in the market in general, and of FAAMG and other tech stocks in particular, as being at concerning heights. CCR Wealth Managment has pointed out repeatedly that while market corrections are a normal course of events (intra-year drops of 5%-10%-15%), bull markets generally do not end due to high valuations. Federal Reserve involvement is inextricably involved with the end of market cycles.
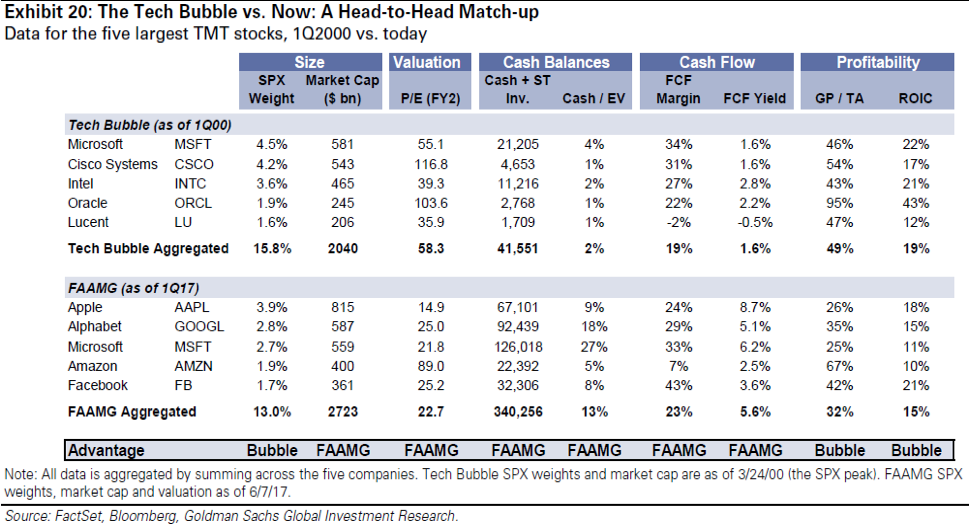
Goldman Sachs points out some important differences between the Tech Bubble stocks circa Q1 2000, and today’s high fliers seventeen years later (data as of June 5, 2017).
-
Size: Today’s FAAMG stocks are ~30% bigger that their Tech Bubble counterparts in 2000, yet together represent a smaller portion of the S&P 500 market cap.
-
Valuation: During the Tech Bubble, the five largest stocks traded at almost 60x forward earnings estimates (FY2—P/E to the second fiscal year). FAAMG today trades at 23x FY2. Amazon is the only stock in the group trading over 30X, whereas Lucent was the cheapest in this metric during the Bubble, trading at 36x FY2.
-
Cash: All FAAMG stocks have significantly more cash on hand than did their counterparts seventeen years ago.
-
Free Cash Flow: Free cash flow is a much better indication of business health than simple accounting-driven earnings per share (FCF is very difficult to manipulate). Note that FCF yield (Free Cash Flow /Share Price) is significantly more robust than Tech Bubble stocks.
Goldman points out that while profitability metrics seem to favor the Bubble stocks, it is likely that the ROIC (return on invested capital) comparison is skewed due to today’s accelerated depreciation practices. These businesses have grown more capital intensive over time, which would raise the denominator and reduce the GP/TA ratio (Gross Profits/Total Assets).
Conclusion
We’ll conclude by acknowledging this market has seemed to defy odds and expectations given the pressures of the current highly politicized environment. Successful long-term investors pay less attention to short-term news cycles and more attention to strong and durable fundamentals—like those describing the FAANG’s. We note that US markets have gone 18 months now without a 5% correction, which may itself represent a brief market dislocation. But given the underlying (if not “vibrant”) currents of the global economy, we believe our slightly overvalued markets will remain so for some time.
© CCR Wealth Management
Read more commentaries by CCR Wealth Management