Summary: US equities reached a new one-month low late last week before rebounding on Friday. In particular, NDX found support right on its mid-May low. This is now an important line in the sand, with implications for SPY as well; so long as the Thursday low holds, look for higher prices.
Despite general weakness in equites over the past several weeks, there have been no notable extremes in breadth, the volatility term structure or put/call ratios that often mark durable lows. On balance, this suggests any short-term gains are unlikely to be sustained longer-term. Moreover, in the past 2 weeks, equities have posted strong gains overnight that have been entirely given up during cash hours, a pattern that has the whiff of distribution.
Earnings reports for 2Q begin this week.
* * *
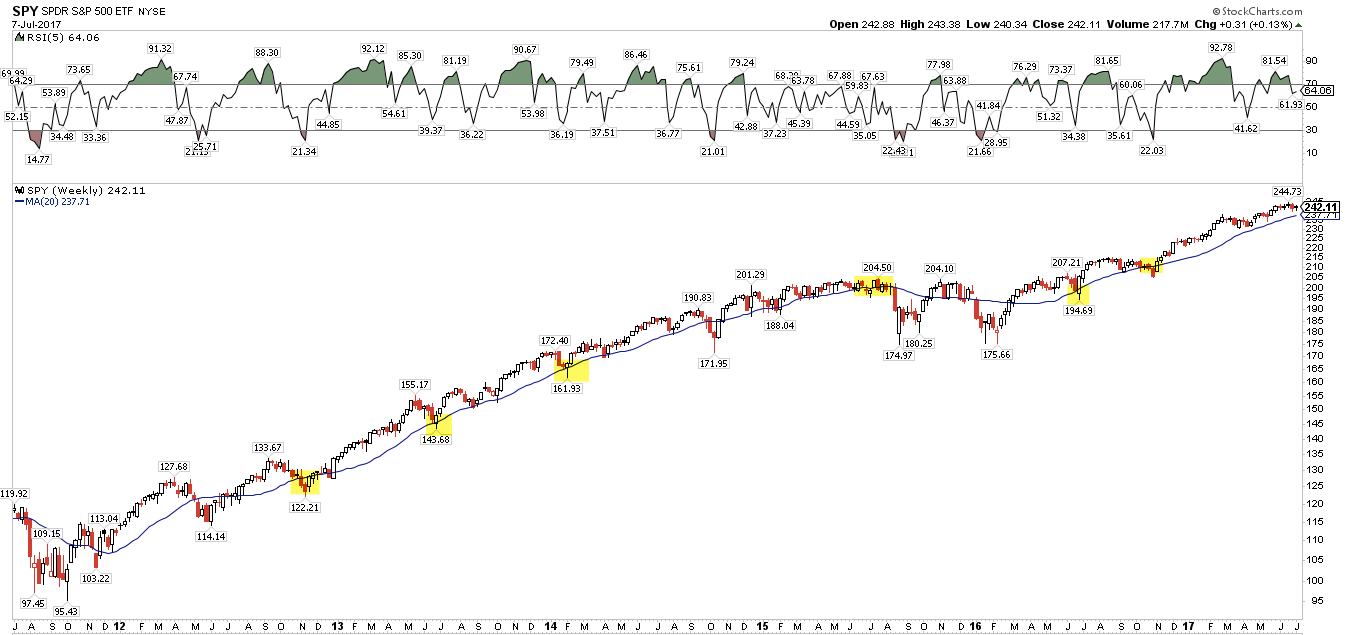
US equities remain in a long term uptrend. The 20-weekly ma (blue line) is often an approximate level of support during uptrends. Enlarge any image by clicking on it.
Long term uptrends typically weaken before they reverse strongly. Note the bottom panel: the 20-wma will flatten in advance of a significant correction to price. That doesn't preclude an intermediate term fall of more than 5-8% which is common in most years. But any such fall is likely to followed by a rebound to the prior highs before a siginificant correction ensues.
Similarly, we have previously presented the historical tendency for years that begin strongly, as this one has, to rise further (see here, here and here). We can add to these the following data: years in which the maximum drawdown in the first half is minor have an 81% historical likelihood of also gaining in the second half of the year, adding a median of 9% (the next 3 charts are from Schaeffer's).
That same report goes on to moderate this bullish conclusion: when more than half of Investors Intelligence newsletter writers are bullish in the first half of the year, second half returns produce small gains and are positive only 50% of the time.
Notably, neither 1995 nor 2013 - years in which the full-year drawdown was as low as 2017 has been to-date - had sentiment as consistently bullish as this year.
These studies mirror our own perspective: the current year is set up for further gains in the months ahead but, on balance, bullish sentiment is an important headwind. The upshot: a larger drawdown than what has been experienced so far this year is 'needed' to reset expectations and increase the likelihood for a solid second half rally. We consider this scenario to be odds-on.
That conclusion jibes with the following fact: SPY has now gone 167 days since it's last 5% drawdown; in the past 22 years, 173 days in 2006 is the only longer streak since the epic 296 day stretch in 1995-96. So, SPY has the potential to match the 2006 streak in the next week. Note again that investor sentiment was not as consistently bullish as now in either 1995 nor 2006.
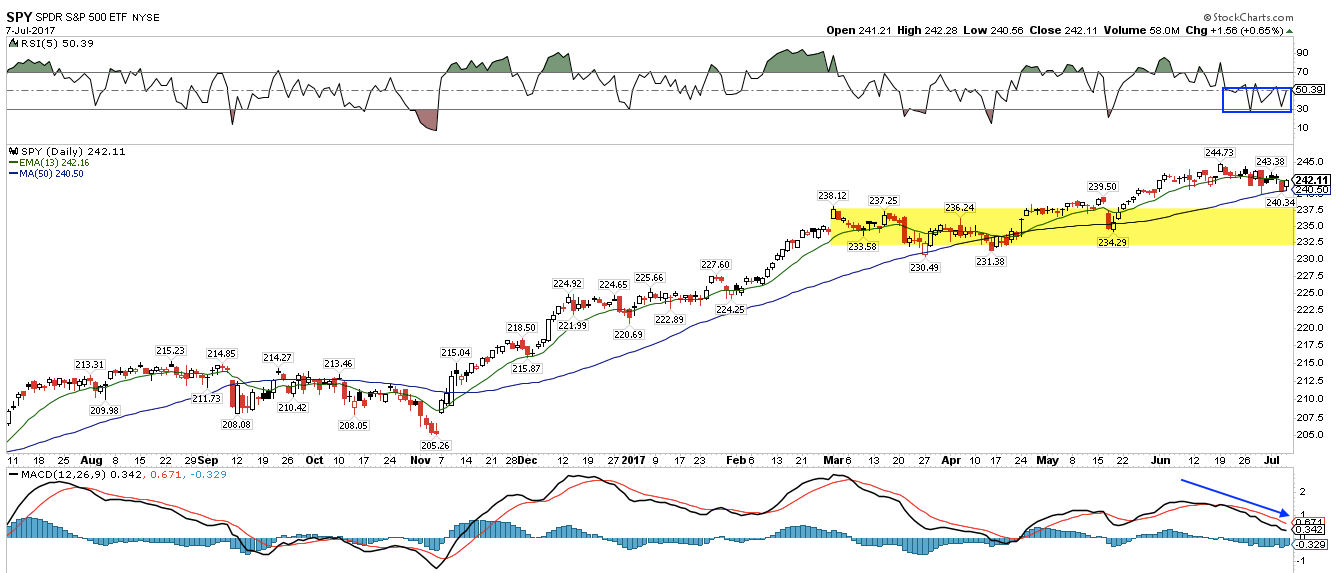
US equities had their lowest close in a month this past week. For SPY, the index once again touched it's 50-dma on Thursday before bouncing on Friday. This is the second touch of the 50-dma in the past 2 weeks: repeated touches increase the likelihood of a larger break. The next lower target is highlighted in yellow.

In the chart above, the top of the highlighted range is the 237.5 area (equal to SPY's 20-wma, the blue line in chart at the top of this post), equal to a 3% correction. The bottom of the highlighted range is the 232.5 area, equal to the mid-April low and 5% correction.
In short, a break below the Thursday low and the 50-dma likely signals likely a move to the highlighted area. Conversely, so long as the Thursday low holds, look for higher prices.
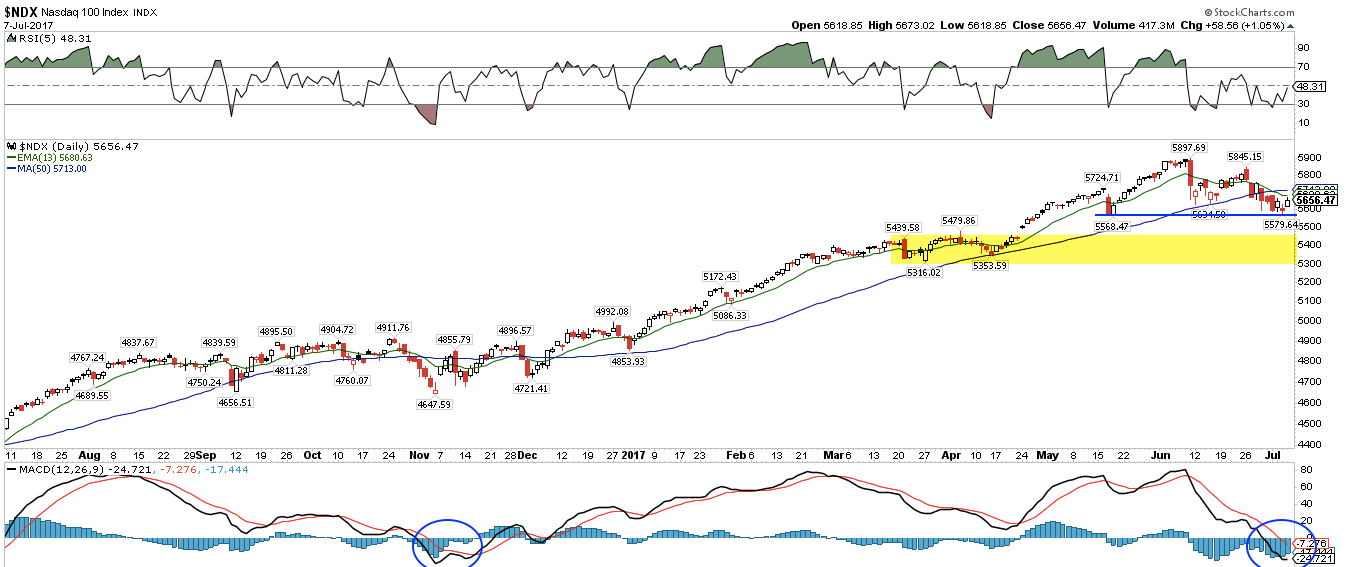
The NDX has been leading SPY lower. As expected, NDX found support right at it's mid-May low (blue line). A strong bounce on Friday followed. This is now a good line in the sand for NDX: if that low fails, the long consolidation during March and April centered on 5400 - more than 2% lower - is the next lower target (yellow shading). Like SPY, so long as the Thursday low in NDX holds, look for higher prices.
New uptrends start with price regaining its 5-dma, which then inflects higher (green line). Note how the 5-dma usually acts are resistance on weakness and support on strength. Watch for this in the coming week as a tell on whether the rebound has sustaining power. Also, momentum should stay mostly overbought (upper panel). This hasn't happened since the index peaked on June 8.
Curiously, despite the weakness in equities the past several weeks, there have been no notable extremes in breadth, the volatility term structure or put/call ratios. Washout lows occur when a number of extremes occur. So far, there has been almost none. On balance, this suggests any short-term gains are unlikely to be sustained.
Another notable feature of the recent market environment is this: in the past two weeks, SPY has gained 2.1% overnight but fallen by more than that during cash hours. Overall, the index has fallen slightly. This activity has the whiff of distribution.
2Q earnings reports start this week, with several large banks reporting on Friday. Reports peak the weeks of July 24th and 31st (from RBC).
Corporate buybacks are in a blackout during earnings, but the affect on the indices is too inconsistent to be useful: sometimes the indices rise during earnings season and sometime they fall. There is no reliable edge.
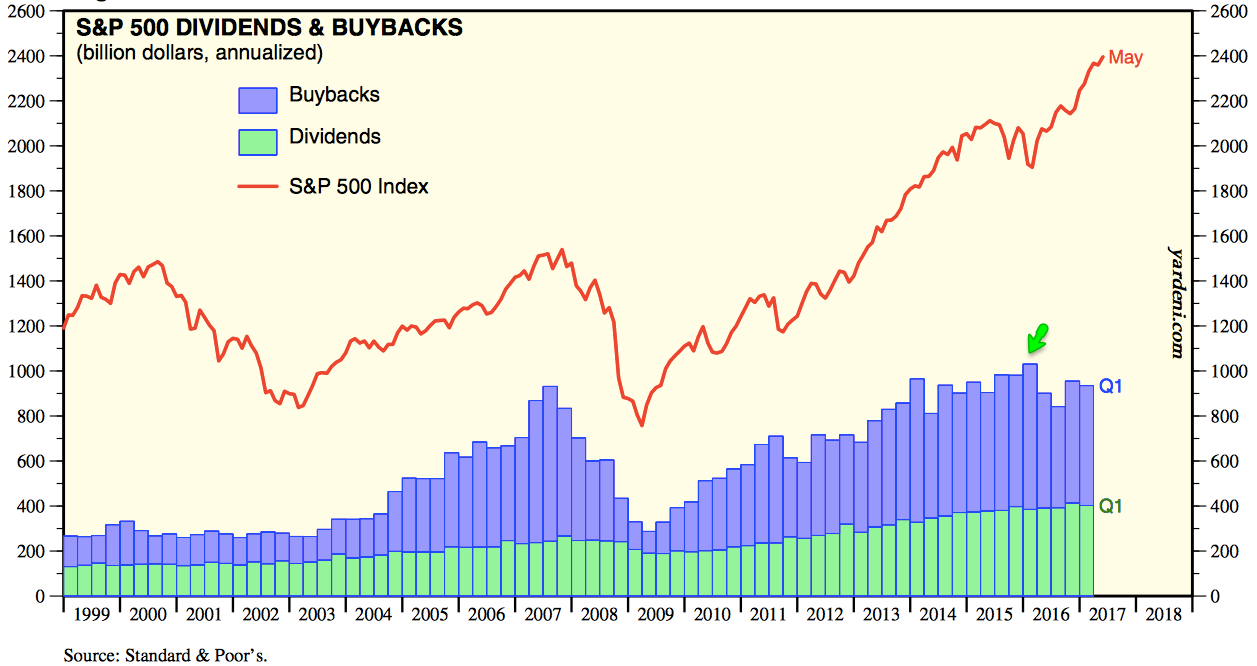
More generally, buybacks are an added tailwind to the indices, but there is much more to equity appreciation than buybacks (for more on this, see
here). Buybacks peaked more than a year ago and SPX is more than 20% higher today (from Yardeni).
Last week's employment report showed a 1.6% annual gain in jobs. Employment has risen 81 months in a row, the longest streak in history. Overall, the data suggest that the likelihood of an imminent recession remains low. A new post on this is
here.
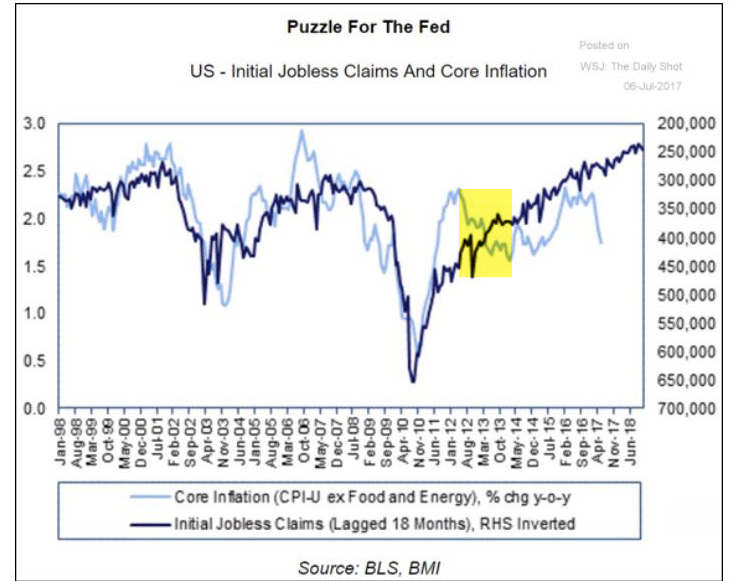
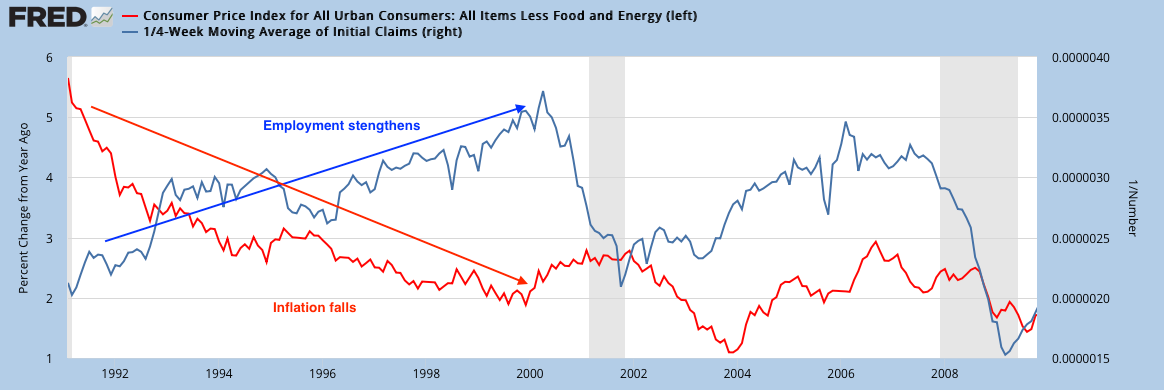
There is some consternation among pundits about core inflation falling while employment strengthens. This is not unprecedented, as it also happened during 2012-13 (shading in first chart; from WSJ) as well as during 1991-1999 (second chart) and during the mid-1980s.
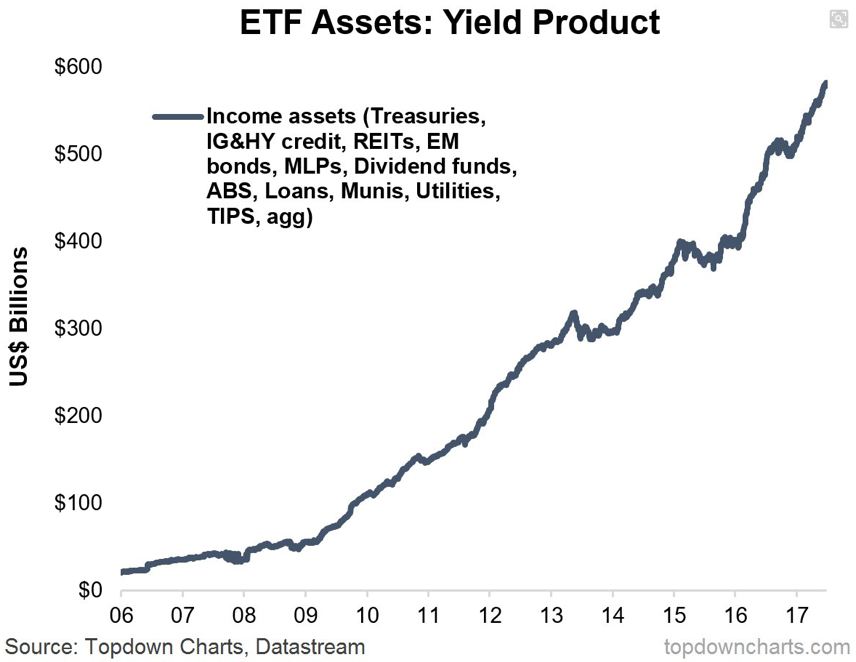
There is also consternation among pundits about the amount of money flowing into bond-like ETFs (first chart; from Topdown Charts). But current assets in these ETFs amounts to just 1.5% of the US bond market (second chart; from JPM).
The macro calendar this week is highlighted by a speech from Fed Chair Yellen on Wednesday and CPI, retail sales and industrial production on Friday. The following week is July OpX.
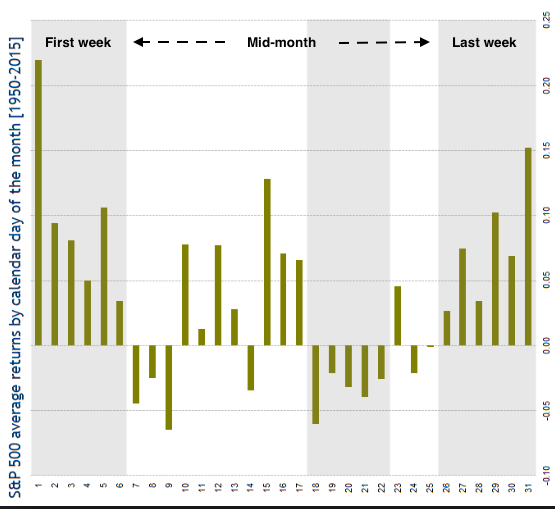
Mid-month trading starts this week. Equities have a strong tendency to produce gains at the end of one month and the start the next. Mid-month periods are weaker (from BAML).
Read more commentaries by The Fat Pitch