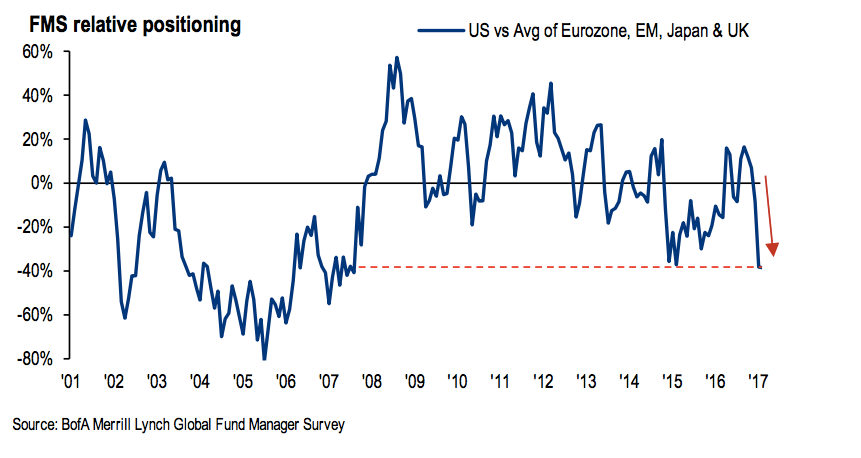
Overall: Relative to history, managers are overweight equities and very underweight bonds. Cash weightings are neutral. Within equities, the US is significantly underweight while Europe and emerging markets are significantly overweight. A pure contrarian would overweight US equities relative to Europe and emerging markets, and overweight global bonds relative to a 60-30-10 basket. Enlarge any image by clicking on it.
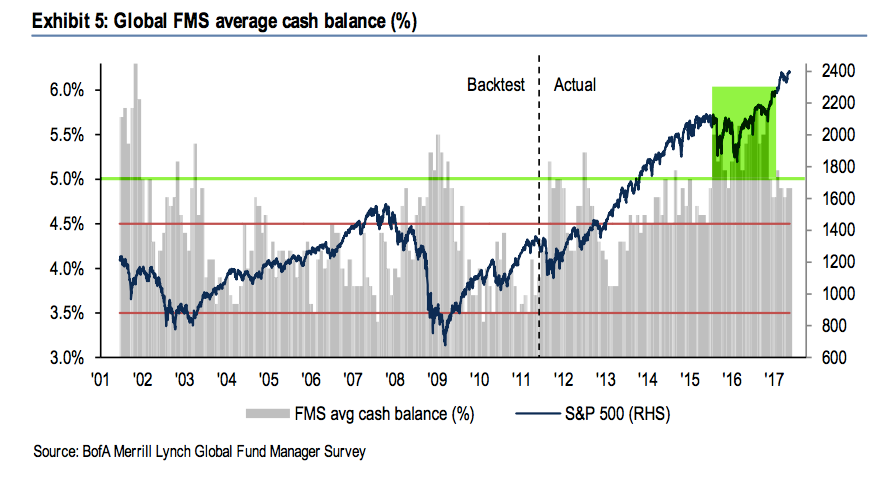
Cash: Fund managers' cash levels dropped from 5.8% in October 2016 to 4.9% in May. Recall that 5.8% was the highest cash level since November 2001. Cash remained above 5% for almost all of 2016, the longest stretch of elevated cash in the survey's history. Some of the tailwind behind the rally is now gone but cash is still supportive of further gains in equities. A significant further drop in cash in the month ahead, however, would be bearish.
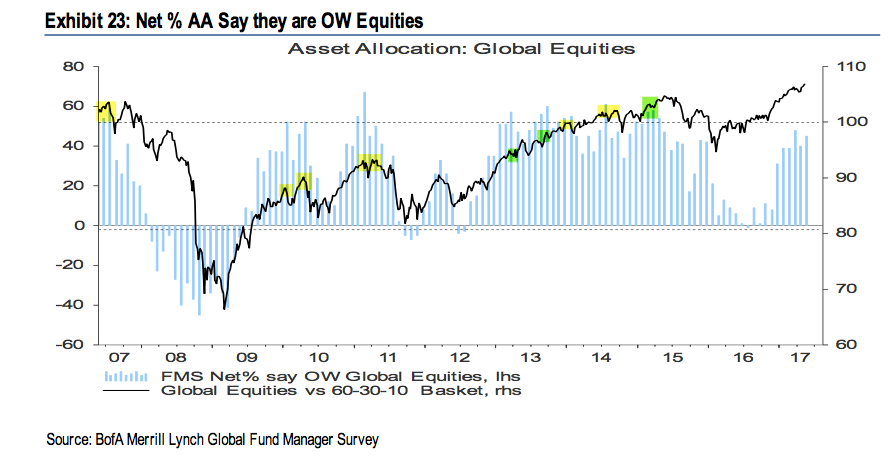
Global equities: Fund managers were just +5% overweight equities at their low in February 2016; since 2009, allocations had only been lower in mid-2011 and mid-2012, periods which were notable bottoms for equity prices during this bull market. Allocations in May have increased to +45% overweight, which is above neutral (0.7 standard deviations above the long term mean). Outside of 2013-14, over +50% overweight has historically been bearish (dashed line and shading). This is getting close to being a headwind to further gains.
In February 2016, more than 20% of fund managers believed profits would be
weaker in the next 12 months, the lowest since 2012. They are now optimistic: 56% expect
stronger profits in the next year, near a 7-year high. Pessimism explained their prior low allocation to equities and high allocation to cash; that has now changed.
Similarly, most (48%) expect a better economy in the next year, near a 2-year high. This also explains their enthusiasm for equities.
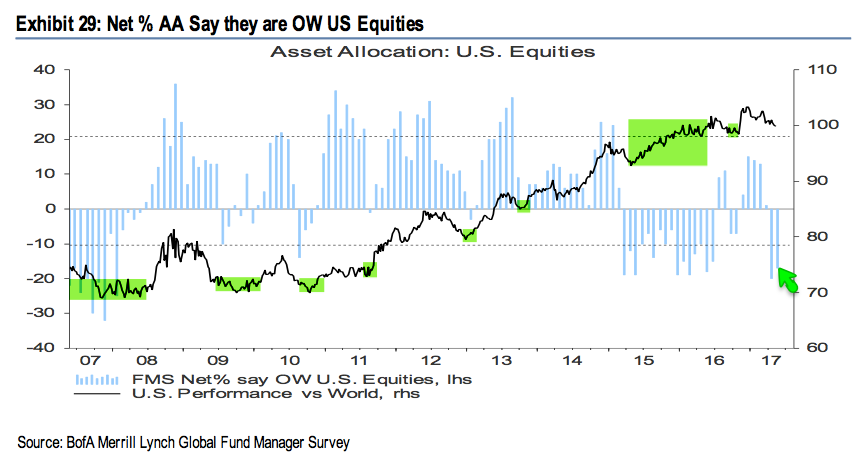
US equities: Fund managers were consistently and considerably underweight US equities for a year and a half starting in early 2015, during which US equities
outperformed. That changed in December 2016, with fund managers becoming +13% overweight, and they remained overweight through February: bearish sentiment was no longer a tailwind for US equities and US equities underperformed their global peers. Fund managers have now dramatically dropped their allocation to -17% underweight, near the lowest since January 2008 (0.7 standard deviations below its long term mean). This is where US equities typically start to outperform again. Above +20% overweight and sentiment typically becomes a strong headwind (dashed line).
Fund managers' positioning in US equities versus the rest of the world is lowest since November 2007 and early 2015, after which the US began to outperform.
European equities: In contrast, fund managers had been excessively overweight European equities in 2015-16, during which time EZ equities underperformed. That changed in July 2016, with the region becoming underweighted for the first time in 3 years. European exposure jumped to +59% overweight in May, a 26-month high. This is well above neutral (1.7 standard deviations above its long term mean). European equities are at high risk of underperforming.
Emerging markets equities: In January 2016, allocations to emerging markets fell to their second lowest in the survey's history (-33% underweight). As the region outperformed in 2016, allocations rose to +31% overweight in October, the highest in 3-1/2 years. That made the region a contrarian short: emerging equities then dropped 10% in the next two months. Allocations fell to -6% underweight in January 2017, making the region a contrarian long again: the region has since outperformed. This month, allocations jumped to +41% overweight, near a 5-year high (1.0 standard deviations above its long term mean). Emerging market equities are at risk of underperforming.
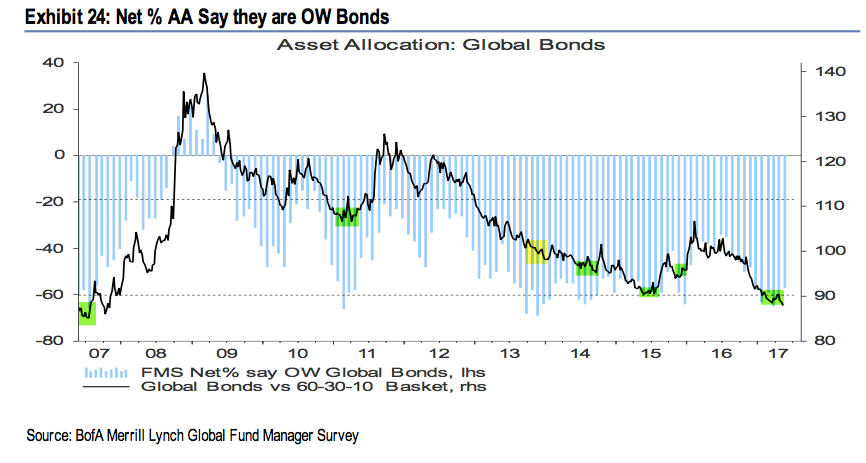
Global bonds: Fund managers are -57% underweight bonds, a fall from -35% underweight in July 2016 (which was near a 3-1/2 year high allocation). This is 0.8 standard deviations below its long term mean and near a more than 3-year low. A capitulation low in the past has often occurred when bonds were -60% underweight, a level reached in March and April (shading and dashed line). In other words, bonds are now a contrarian long. Note the failure in 2013.
Of note, fund managers' inflation expectations in March were at the highest level in 13 years; May was only slightly lower. This explains some of the sell off in bonds in the second half of 2016. It's notable that current levels have marked at least a short-term reversal point in yields in the past (lower panel).
Similarly, fund managers' growth expectations relative to inflation are at the highest level on record; similar highs in 1Q 2010 and 1Q 2011 preceded a fall in yields (arrows).
Commodities: Allocations to commodities remain near a 4-year high (-3% underweight). This is neutral (0.1 standard deviations above its long term mean). In comparison, in February 2016, allocations were near one of the lowest levels in the survey's history (-29% underweight). The improvement in commodity allocations goes together with increased macro optimism.
Dollar: Since 2004, fund managers surveyed by BAML have been very good at determining when the dollar is overvalued. In March 2015, they viewed it as overvalued for the first time since 2009; the dollar index fell from 7% in the next two months. In late 2015, they again viewed the dollar as overvalued and the index lost 7%. Fund managers have viewed the dollar as overvalued since November 2016; since then, the dollar has lost about 4%. Under similar conditions (highlighted in green), the dollar has fallen in value in the month(s) ahead.
Survey parameters are below.
-
Cash: The typical range is 3.5-5.0%. BAML has a 4.5% contrarian buy level but we consider over 5% to be a better signal. More on this indicator here.
-
Equities: Over +50% overweight is bearish. A washout low (bullish) is under +15% overweight. More on this indicator here.
-
Bonds: Global bonds started to underperform in mid-2010, 2011 and 2012 when they reached -20% underweight. -60% underweight is often a bearish extreme.
-
Commodities: Higher commodity exposure goes in hand with improved sentiment towards global macro and especially EM equities.
© The Fat Pitch
Read more commentaries by The Fat Pitch