Summary: US equities rose for a third week in a row, to new all-time highs. Trend persistence like this normally leads to higher highs in the weeks ahead. It's true that volatility has dropped to significant lows and that volatility risk is to the upside. But timing this "mean reversion" is tricky: SPX could rise several percent before VIX pops higher. It's not a stretch to say that US equities have been focused on this weekend's French election the past several weeks; there is, therefore, a "sell the news" event risk to be on the watch out for.
* * *
Trend
- NDX and COMPQ made new all-time highs (ATH) again this week. SPX made a new ATH on a closing basis, eclipsing the prior high from March 1. The primary trend is higher.
- SPX ended the week overbought (as measured by the daily RSI(5)). Upwardly trending markets are partially defined by their ability to become and stay overbought. This is a positive sign so long as it persists.
- After becoming overbought, the rising 13-ema is normally the approximate first level of support on weakness. This moving average has not been touched in the past two weeks, a positive sign of trend persistence. That level is approximately 2380 (a chart on this is here).
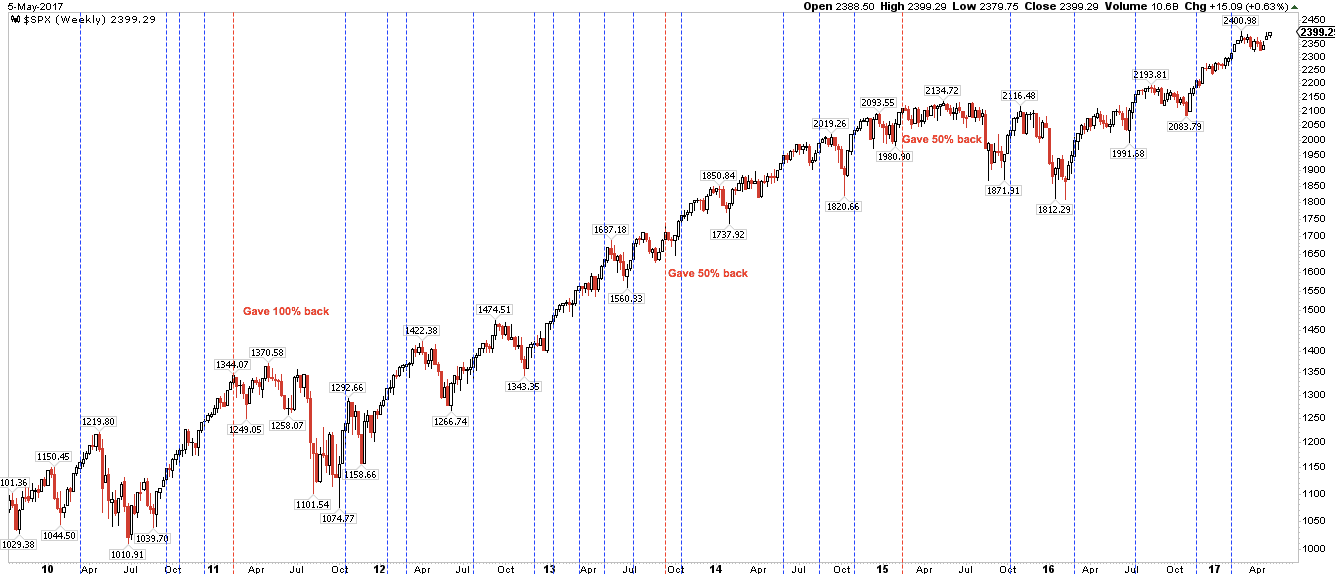
- SPX has now risen 3 weeks in a row. This is a positive sign of momentum. SPX has a strong tendency to make a higher high after rising 3 weeks in a row (blue lines in the chart below).
- All of the above said, markets undulate higher. Even the most persistent trends suffer setbacks, however temporary. The current uptrend is now one of the three longest since the low in 2009; if past is prologue, a 5% correction is odds-on by the end of June. That should be the expectation of swing traders heading into summer. Read last week's post on this here. Enlarge any chart by clicking on it.
Breadth
- The cumulative advance-decline for both the NYSE and SPX are at or near new ATHs. According to Sentimentrader, when this occurs while indices are at a new high (like now), SPX has been higher 1-2 months later 18 of the last 19 times. That doesn't preclude an interim swoon, but it does mean a meaningful top now is highly unlikely.
- The very broad NYSE index is within 0.5% of its ATH, a further sign that breadth is largely fine.
- True, there are some "breadth divergences" in indices versus their equal-weight benchmarks, but these have been too inconsistent markers of upcoming risk to be useful (a chart on this is here).
- On balance, overall breadth measures are supportive of the trend higher.
Sentiment
- After a three week rally, sentiment is again becoming bullish, especially when measured by Investors Intelligence and NAAIM.
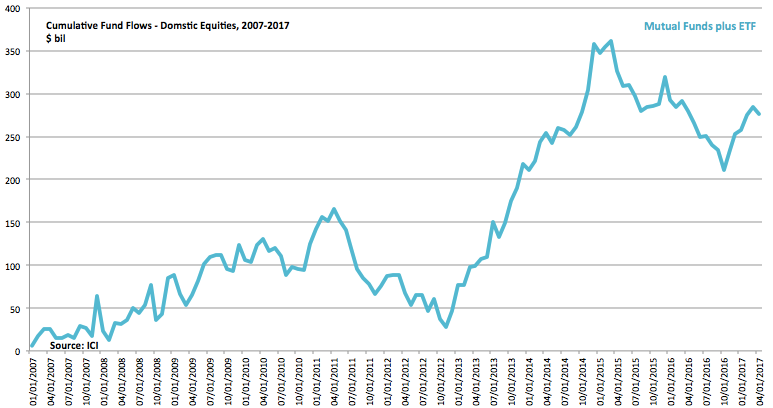
- In contrast, the 4-week AAII bull-bear spread is still emerging from a relatively high level of pessimism, suggesting more upside. That is also true to the BAML survey of fund managers. A post on this is here. And equity funds saw net outflows over the past month, hardly a sign of excessive bullishness (chart below).
- On balance, some of the tailwind in sentiment has been expended but it is not yet a clear headwind. On further gains this week, we'll be watching put/call ratios closely.