Summary: US equities ended the month of April above or near new all-time highs. There are no significant extremes that suggest the trend higher will suddenly end. But the upcoming "summer months" are normally marked by lower price appreciation and larger drawdowns. Into this period, it is notable that SPX's streak without a correction of 5% or more is nearing the longest of the 8 year old bull market.
* * *
US indices closed above or near new all-time highs (ATH) last week. In the past two weeks, SPX has gained 2.4% while NDX and RUT have each gained more than 4%. The set up for these gains was detailed here.
Overall, the trend in equities remains higher, supported by breadth, sentiment, volatility, macro and seasonality. All of that said, the first correction of at least 5% is increasingly likely to take place in the next two months.
Let's recap where markets currently stand as the month of May begins.
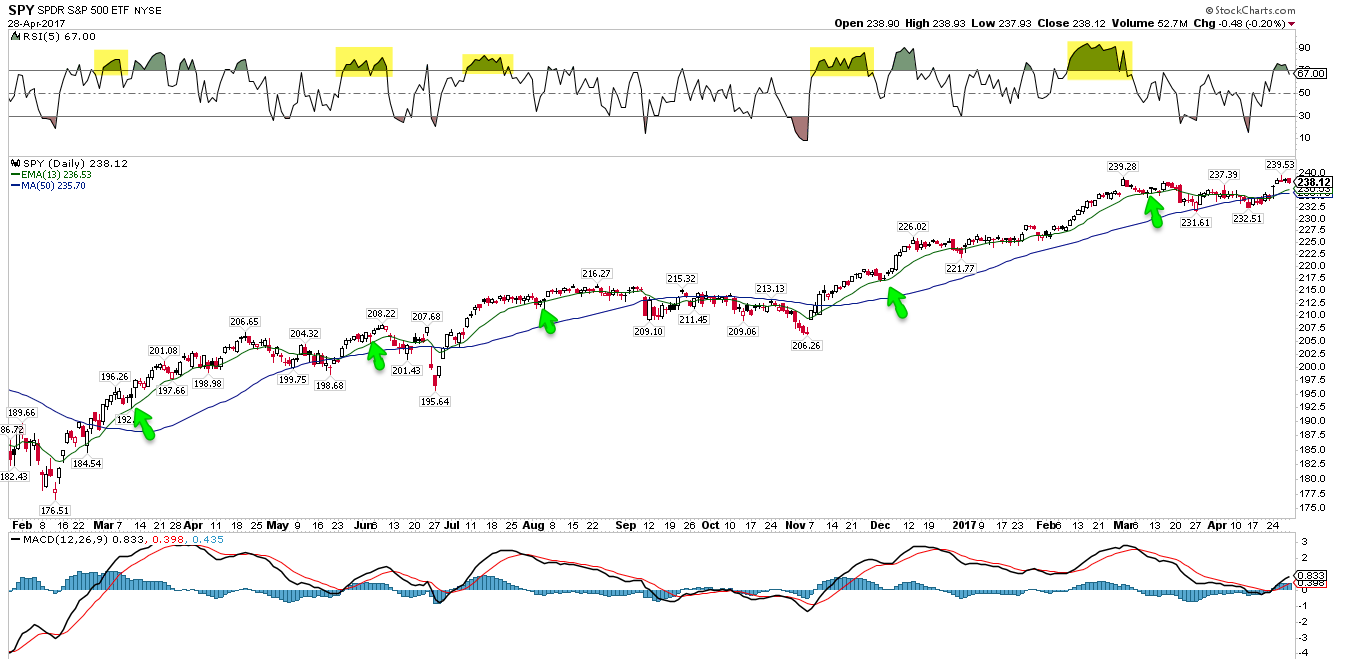
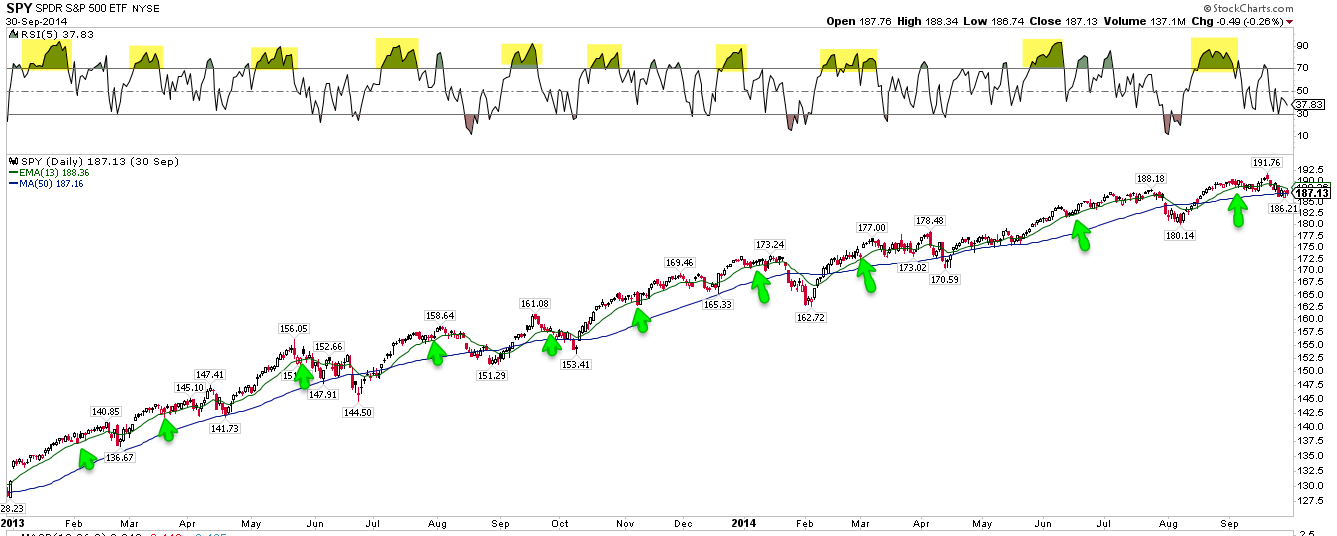
Trend: NDX and COMPQ made new ATHs this past week, as did RUT. On a total return basis, SPX is also at a new ATH. The primary trend is higher. After becoming overbought (top panel), the rising 13-ema is normally the approximate first level of support on weakness (green line and arrows). Enlarge any chart by clicking on it.

While the trend is higher, it is notable that it has been 120 days since SPX's last 5% (or greater) correction. Since 2009, there have been only 3 uninterrupted uptrends that have lasted longer, all taking place during 2013-14: 127 days (ending May 2013), 142 days (ending January 2014) and 158 days (ending September 2014). If past is prologue, then SPX appears likely to have a 5% correction by May 10 (127 days) to June 23 (158 days). That would fit a seasonal pattern as well (discussed below)
Breadth: That even small caps are at a new ATH is a strong indication that breadth in the market is mostly fine. Moreover, the cumulative advance-decline for both the NYSE and SPX are also at new ATHs.
It's true that larger companies are disproportionately pulling the indices higher: the SPX measured on an "equal-weight" basis is underperforming the index when measured on a market capitalization basis (lower panel). But these divergences have a highly inconsistent correlation to corrections of more than 5%. The last 4 corrections were preceded by a divergence (blue arrow) but 6 of the prior 8 corrections before than were not (red arrows). Moreover, the ongoing divergence has been taking place since early December, during which time SPX has gained 10%. Using these divergences for calling tops has simply not been a successful strategy.
Sentiment: The 4-week AAII bull-bear spread suggests individual investor pessimism is at a level consistent with a fall in equity prices of 5-10% (chart is here). Moreover, fund managers polled by BAML have their largest underweight since January 2008, and overall fund cash levels remain elevated (a recent post on this is here). It’s remarkable that these relative extremes in sentiment are taking place with US equities at new ATHs. Overall, these are positives for equities, especially in the US.
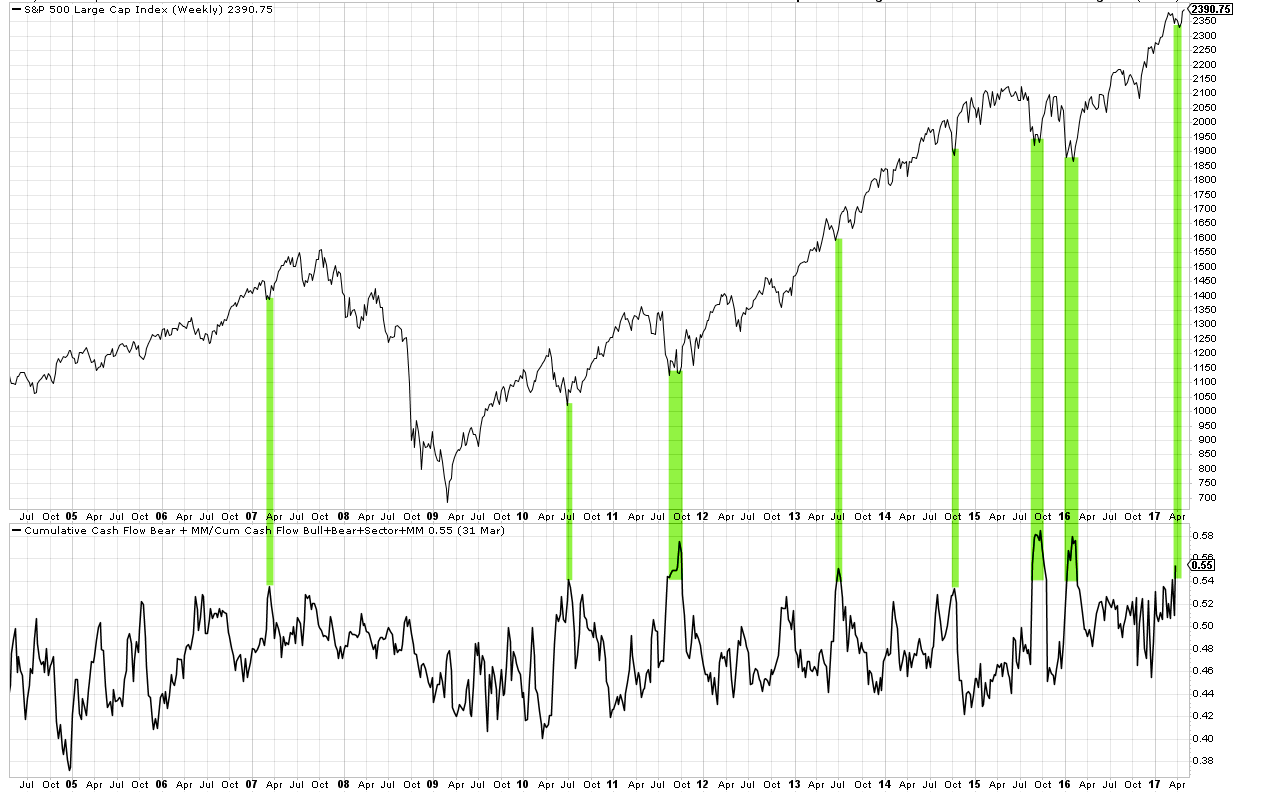
Another way of looking at sentiment is by measuring the assets in Rydex bearish equity funds plus cash balances as a percentage of total assets (lower panel). Pessimism is reflected in this indicator moving higher. It's currently at a 14-month high. In the past, current levels have been consistent with relative lows in SPX. An imminent 5% correction would be very unusual.
Macro: The first estimate of 1Q17 GDP growth was 1.9%; personal consumption, which forms 70% of the economy, grew 2.8%. Overall, recent data suggests economic risks remain low.
Volatility: There are no significant abnormalities in the level or term structure of volatility at present. Overall, low volatility is consistent with a grind higher in equity prices.
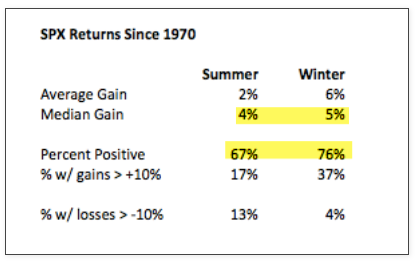
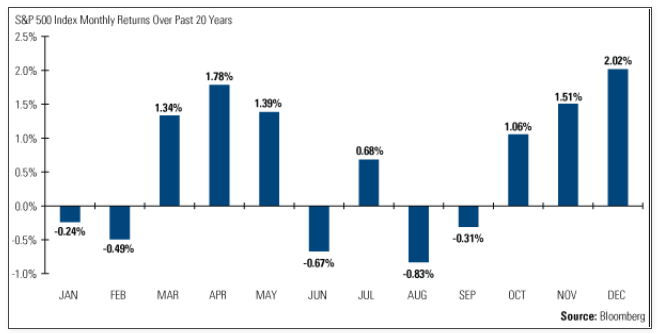
Seasonality: We are now entering “the worst 6-months of the year” for equities. It’s notable that equity prices are most often higher by the end of this period. In other words, you could "sell in May" and buy back higher in November. Nonetheless, the upcoming period does tend to produce lower average returns. The period of quick appreciation that began at the time of the US election is likely to take a pause. A post on May-October seasonality is
here.
While the month of May is seasonally strong, June, August and September are some of the weakest of the year. Even great years like 2013 experience multiple drawdowns of 3-8%; given the length of time since the last correction, one in the next two months would seem to be quite likely (from Bloomberg).
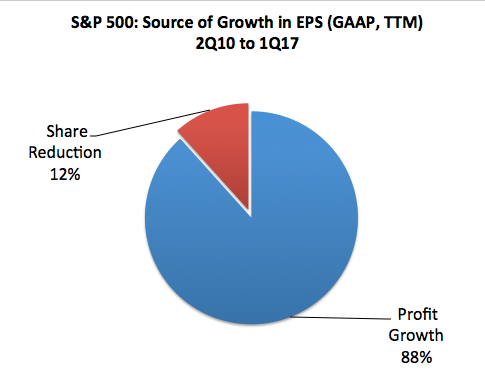
Valuation: Earnings reports for 1Q have been mostly good. Sales growth is averaging 7% yoy and GAAP EPS growth is averaging 22%. Growth continues to be driven higher profits, not by "accounting gimmicks" or corporate buybacks that reduce shares.
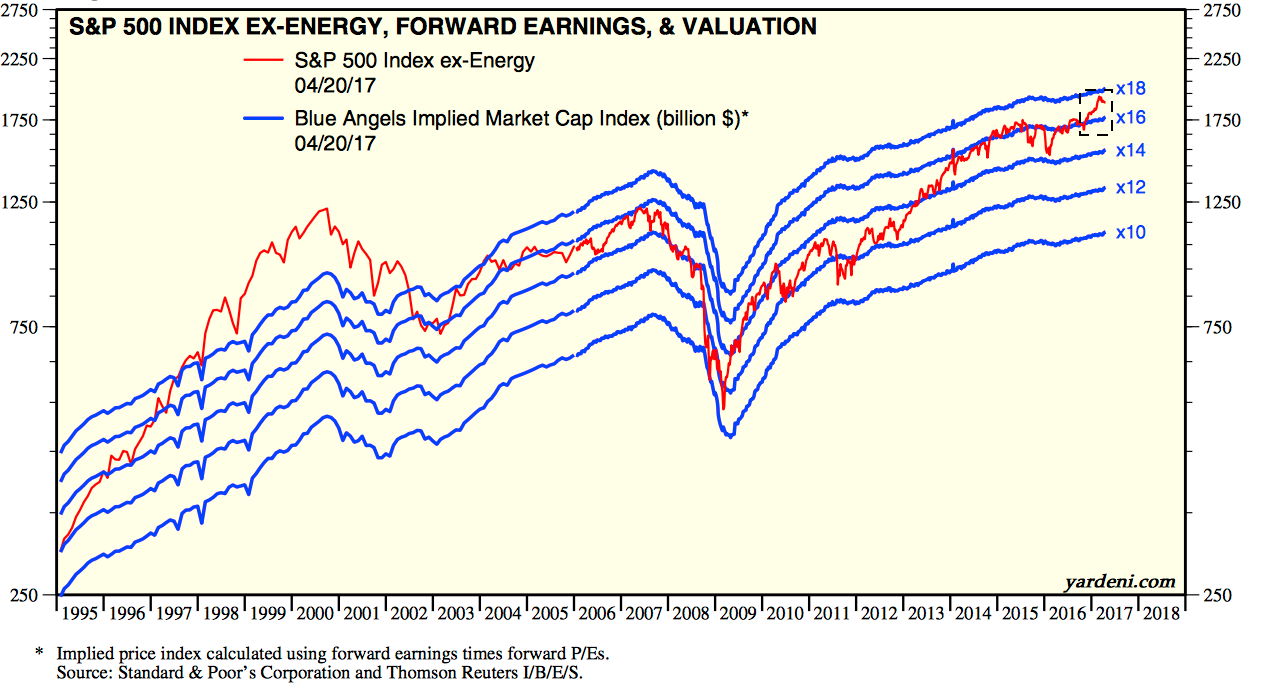
That said, it's accurate to say that current valuations are high relative to history, but that has been true since 2014, during which time SPX has moved much higher. Valuation has almost no correlation with equity returns over the next year but high valuations do imply lower expected returns over the next 3-5 years (from Yardeni).
This week is highlighted by several events that have the potential to bring some short term volatility. PCE is released on Monday, auto sales on Tuesday, the FOMC meets on Wednesday and NFP is on Friday.
© The Fat Pitch
Read more commentaries by The Fat Pitch