“I can calculate the movement of stars, but not the madness of men”
Sir Isaac Newton
We wrap-up our three-part series on Behavioral Finance in this issue of the Outlook with a discussion of Emotional Biases, which often adversely affect investors’ outcomes. This discussion and the tie-in with Sir Isaac Newton is found in the second half of this quarter’s Outlook.
As we write in early April, the S&P 500 has tacked on year-to-date gains of 4.74% to what has been billed the “Trump Rally”, which began after the November Presidential election. Some may find the market’s staying power surprising given the decidedly “mixed bag” for the new administration’s first eight weeks in office. We say this because in our January Outlook we pinned much of the fourth quarter rally squarely on optimism rather than achievement, as the 45th US President had yet to even be sworn in at the time. Optimism, as measured by equity market levels, has thus far not been displaced by political setbacks, including a failure to roll-back Obamacare, the legal roadblocks to the administration’s immigration orders, or the slow (and as-yet incomplete) approval of cabinet appointments. Regardless of what our clients think of these policies individually, their failure to launch drains the political capital needed to enact policies the capital markets want. We realize the we are in the very early months of the first presidential term, but we think it fair to say the political capital of this administration in finite, and must be used effectively.
We see the economy continuing to grind it out here is the US. The impressive job figures in January and February were theorized by some that not only did optimism permeate Wall Street, but that hiring was being positively affected by managers and business owners who anticipated regulatory reforms and corporate tax cuts. So went the narrative, until the less than impressive March non-farm payroll figures (98,000 new jobs created vs. expectations of 180,000), and a 38,000-combined downward revision to February and January payroll gains has called this theory into question. And yet, the market’s response has been muted.
Additional pressure on the market could have also been expected by the Federal Reserve’s 25 basis point interest rate hike in March, which, on the heels of the December rate hike was the first back-to-back interest rate increase in eleven years. The fed has also indicated in transparent language that they expect to raise rates twice more in 2017. And yet, the market’s response has been muted.

CCR Wealth Management’s outlook is bifurcated into nearer-term probabilities, and longer term expectations. In the near term, we think it is important to remind our clients that market corrections are a normal occurrence, and indeed occasional corrections may help fuel longer-term market expansions through a process of depressurization. We resurrect this by now (hopefully) familiar chart to make this point. An average intra-year drop in equity prices of 14.1% has still produced positive annual equity market returns over 75% of the time over nearly 40 years. As we know, market corrections often develop quickly. What would a 14% correction in the Dow Jones Industrial Average look like today? Answer; a drop of nearly 3000 points! Our message is don’t panic—but know something similar could be coming. It has been over a year since the last 10%+ correction in equity markets.
While equity markets have remained stalwart year-to-date, in the short term we have seen some technical indicators developing which may infer investors are hedging their optimism. Gold prices have risen nearly 14% off their December low’s, and the ten-year treasury yield has fallen about 15% at this writing, and is at levels last seen in mid-November (a drop in yields indicates a rise in prices). Both Gold and Treasury bond values often have a negative correlation to equity and credit risk in times of volatility. In short, we think many market participants are hedging in the near-term against a return of market volatility, and the probability of a bumpier ride in the near term has increased. While forecasting short-term market gyrations is difficult, we again point to a rally built on little more than optimism. A possible source of nearer term volatility the attempt at tax-reform legislation. Tax reform looms large in the near-term as the next test of the new administration’s ability to enact campaign pledges—most of which to-date remain unfulfilled by a government dominated by one political party. Tax reform is also highly anticipated by investors and corporate America. A fate similar to the healthcare attempt almost certainly will invite back volatility.
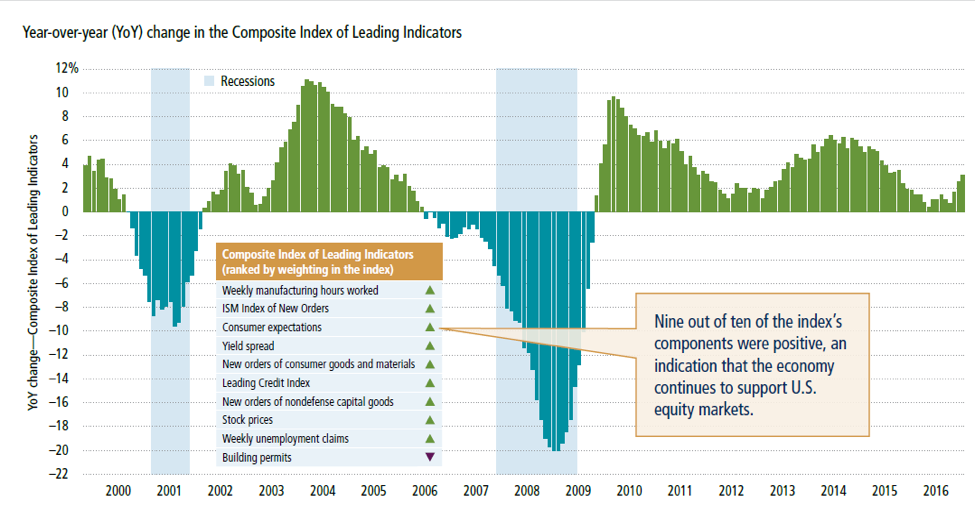
In the longer term (2-5 years), CCR Wealth management remains bullish, and we counsel our clients to expect, and ride out near-term volatility. Economic growth in the US, and indeed globally, remains sluggish when compared to previous decades, and much has been made by the media and financial pundits about current equity valuations, which we acknowledge are on the high side. By focusing on these comparisons alone, investors may be missing the mark. We continue to live in the “New Normal” globally, where low growth levels justify extraordinary monetary accommodation un most of the world. We think progress must be made in the context of this economic regime, and not measured against a past which shares little in common with today’s dynamics. In this context, long term economic fundamentals remain strongly suggestive of a continuing economic expansion in the US, and therefore supportive of equities.
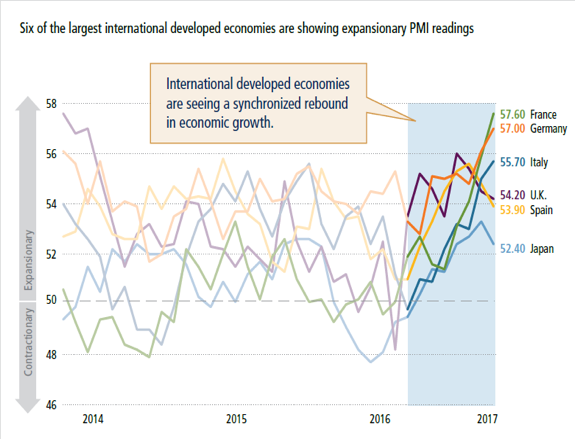
In Europe where economic growth has been far more fragile in recent years, we think it fair to say that a recovery is well underway. The Purchasing Manager’s Index, which tracks capital spending and is widely viewed as a leading economic indicator has swung decidedly positive for Europe’s largest economies in recent months. We will note here too that, while it may be “under the radar” of many investors, non-US equity indexes have surpassed the US—often by a significant margin when adjusted for the effects of currency.
For example, through April 12th, the one-year trailing European Monetary Union equity index is up 10.22% in US Dollar terms, marginally trailing the S&P 500’s 13.74% return. However, removing the effects of currency (the strengthening dollar), the EMU 12 month return is 18.06%--well exceeding US markets.
In fact, even in US Dollar terms, year-to-date the broader MSCI EAFE index exceeds the S&P 500 6.02% to 4.74%. So once again, non-US diversification pays off. Given both cheaper stock valuations and the early stages of economic expansion overseas, our expectation is that this dynamic will persist.
Regarding equity valuations, we will make the point here that has been a topic of our internal market strategy discussions. Bull Markets do not die of old age. Nor do they die of high valuations. They are almost always killed off by the fed. We read a Wall Street Journal Article a couple of months ago which included this eye-catching opening sentence:
“The S&P 500 stands at almost 18 times estimated operating earnings, the highest
forward PE ratio since 2004 and a figure which was higher before that only during the
late 1990s dot-com bubble and its aftermath”.
A New Way to Look at Crazy Stock Valuations, WSJ Feb 27th
Our outlook would not be complete without some media-bashing, so let’s dissect this nugget. The implication seems to be that stock valuations are so wildly out-of-whack that that a fall off the ledge is imminent. Remember how stocks tanked right after those valuations were reached in 2004? Neither do we. In fact, reinvesting dividends, had one purchased the S&P 500 index at the highs of December 2004 and held it through the rest of the market cycle (November 2007), another 35% was gained, or 11.17% per year (though investors cannot purchase indexes). Bull markets do not die of old age, nor do they die of elevated valuations. In fact, to our knowledge the bear market which began in October 2007 has never been attributed to stock P/E ratios. Rather, a continuing Fed tightening cycle exposed the fragility of an overheated housing market.
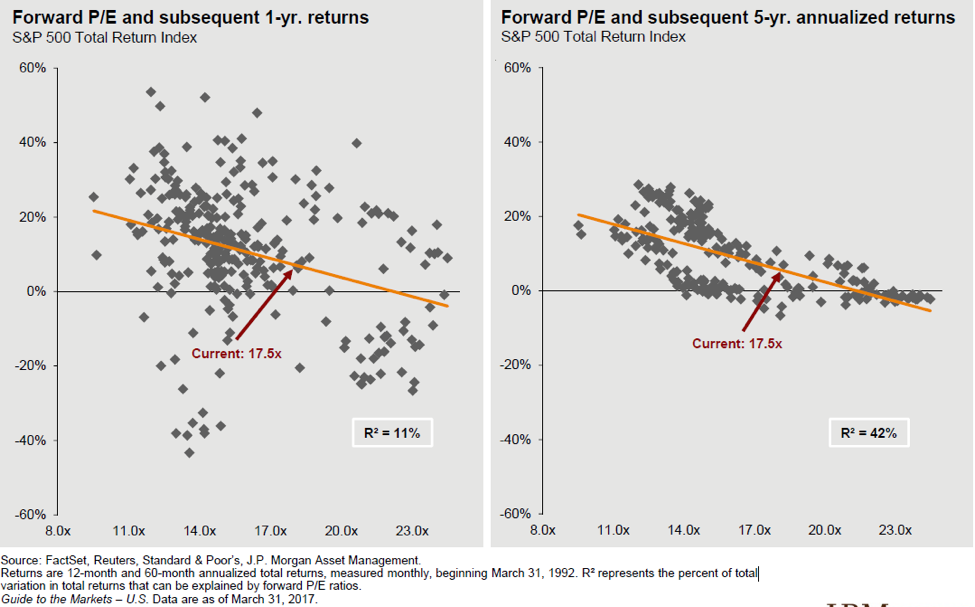
As further evidence to support our longer-term comfort with equity markets, we present the following two graphs which present ex-post market returns over one year and 5 years, given the same (current) 17.5x S&P 500 P/E ratio, going back to 1992.
Both scatter plots show that over the last 25 years, one and five year returns after equity valuations consistent with current levels (17.5x) have been in the mid to high single digits.
Our last item on valuation is also the gist of the same Wall Street Journal article. As we have pointed out before, a ratio is a fraction (Price/Earnings = relative valuation). If the denominator in any fraction increases, the value of the fraction decreases. Recall what happened to a meaningful segment of the US market a couple of years ago. The US Energy sector experienced its own rather severe bear market, as a glut of cheap oil and slackened demand from China drove down profit margins across the sector, and drove many smaller firms into bankruptcy. But oil prices have stabilized, and earnings for this swath of the US economy (roughly 8-9% of the S&P 500 market cap) are poised to rebound. So, in addition to the organic earnings growth of the broader market, we have a forecasted rebound in energy-related earnings, all of which could contribute the inflation of the P/E denominator, keeping stock valuations reasonable.
Fixed Income
Bond markets have “calmed” since the sharp interest rate rises post-election caused prices to tumble in Q4. Year to date the Barclay’s Aggregate Bond index is up 0.64% through March 31. This is a recovery from the steep post-election decline, resulting in a trailing 12 month return of 2.65%.
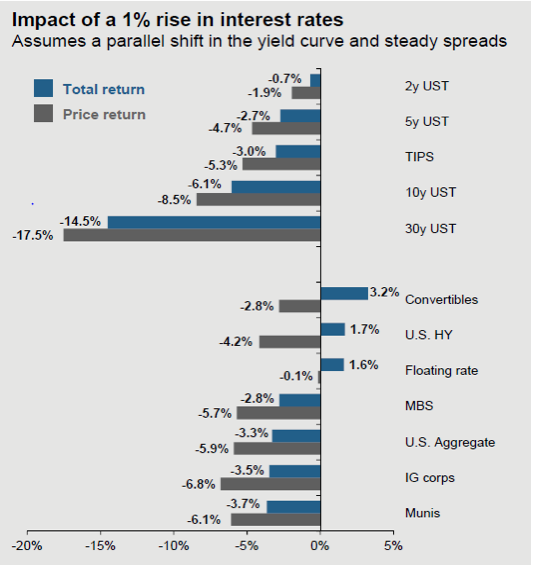
In our January Outlook we discussed at some length that investors should not be thinking of bonds as a homogenous asset class. While it is true that all bond values share a sensitivity to interest rates (an inverse relationship), various sectors within the bond market are more sensitive than others. CCR Wealth Management has long-aligned our model bond portfolios with the credit markets (which includes investment grade and high yield corporates, mortgage-backed, and senior loans). This decision, now nearly 5 years old, was motivated by both an expanding economy and an anticipation of rising interest rates. While it took a few years for the first Fed rate hike to be realized, this credit-centric allocation has generally far-exceeded a more rate-centric approach. The trade of, as discussed in January, is that credit-oriented bonds (think virtually anything non-government) have generally higher correlations to equities, which may be disadvantageous in volatile markets.
We see twin forces at work currently. Expansionary fiscal policies from the new administration should benefit the credit markets as it does the equity market (highly correlated). These same policies, however, likely accelerate the timeline for tighter monetary policy, placing pressure on “safe” bonds like Treasuries.
The “default” trade for investors seeking to reduce their risk profile and exposure to volatility has generally been to reduce their equity allocation, and add to bonds. Our thesis is that a more creative approach may be required given that volatility in the equity markets will spill over into the credit markets, and rising interest rates have a negative effect on all bonds, but especially bonds with no credit risk (US Treasuries). A portfolio which emphasizes low correlations among a variety of asset classes, in our view, is more likely to meet investor’s volatility objectives than simply toggling back and forth between stocks and bonds. Speak to your CCR Wealth Management advisor for more information on this approach.
Our outlook for the bond market in general hasn’t changed much in the last couple of years. Investors should be anticipating a low return. Most of our clients have bond allocations ranging from 30% to 50% of their portfolios, depending on their age, investment objectives and risk appetite. Be aware that current bond yields are highly indicative of longer term performance. In fact, 87% of a bond’s 10-year performance is attributed to its current yield. With the Bloomberg Barclay’s Aggregate Bond Index currently yielding less than 2.50%, investors with large exposures to this index should adjust portfolio expectations accordingly.
BEHAVIORAL FINANCE
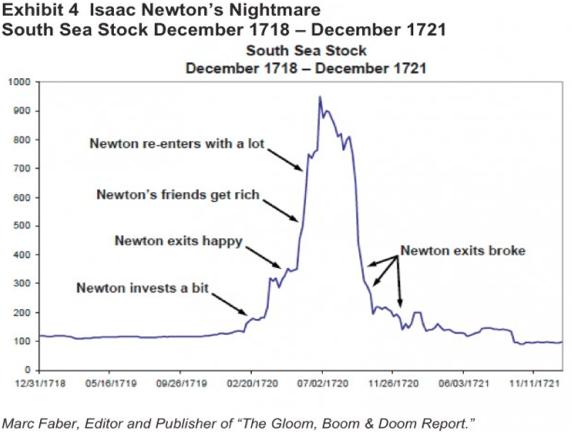
The South Sea Company was a British stock company created in 1711 as a joint public-private partnership to trade with South America. Its real purpose was to reduce the cost of national debt incurred by Britain in its ongoing War of Spanish Succession by “sharing” the debt burden with the public. The South Sea Company was granted a monopoly to trade with South America, which, ironically was controlled at the time by Spain. There was likely never much prospect of trade with South America because of this, but as the South Sea Company increased its dealings with government debt, its stock soared.
As Marc Faber describes in the “Gloom, Boom and Doom Report”, the soaring stock created much excitement, attracting many notable and wealthy people including Sir Isaac Newton. Newton invested a modest sum in February 1720, and within a few short months had more than doubled his money. Feeling quite satisfied, he then sold his shares.
Yet the Stock continued to soar! Newton’s wealthy contemporaries were getting even wealthier as he remained on the sidelines, no doubt making for some tiresome social interactions. Perhaps envy, perhaps greed prompted Newton to re-enter the trade a short time later—this time with a much larger investment. Unfortunately for him, the stock crashed within months, losing him almost his entire savings (roughly $4 million in today’s dollars).
Newton’s own seminal work on gravity, Principia, was published over thirty years prior to his foray into the South Sea Company. Unfortunatley, the fortune made discovering gravity was lost in gravity’s rediscovery. His concession reportedly included the statement “I can calculate the movement of stars, but not the madness of men”.
Envy and greed are irrational and destructive emotions, of course. While there is no way to know for sure what was going through Newton’s mind at the time, his pattern of investment behavior has repeated itself in countless others over time, from the Dutch Tulip Mania in 1637 through the Tech Bubble collapse over 360 years later.
In October, we described two distinct types of behavioral biases, cognitive and emotional, which negatively affect investors’ outcomes, and we cited the Dalbar Quantitative Analysis of Investor Behavior which identifies behavioral biases as the primary culprit for why tend to vastly underperform their investment benchmarks. In January, we listed several specific cognitive biases which are limitations of our ability to mentally process oftentimes complex information. We conclude our Behavioral Finance topical discussion with a review of emotional bias.
Emotional Biases tend to affect individuals more than investment professionals, though not exclusively. Emotional biases, in contrast to cognitive biases, can be quite difficult to “correct” because human emotions lie outside the realm of logic. Most often we as professionals seek to “work around” them, trying to achieve as close to an optimal outcome (usually an asset allocation) as the situation will allow.
Regret-Aversion Bias fueled sir Isaac Newton’s actions during the south Sea Bubble. Regret Aversion can lead to either an act of commission or an act of omission, and describes the fear that people have that they will regret the decision made which then affects future decisions. In Newton’s case, an act of commission was fueled by regret that he had sold his shares in the South Sea Company, while his friends continue to get rich (rather than any rational review of the investment, which may have revealed its imminent collapse).
Loss Aversion: We’ve referred to loss aversion several times in the previous Outlooks because it underpins so much of behavioral finance. In general, people strongly prefer to avoid “losses” vs. achieving gains of the same amount (a $1,000 loss is more painful than a $1,000 gain is satisfying). Additionally, people tend to evaluate their gains and losses based on a “reference point” (the entry point, a cost basis, the price last month) which is irrelevant to the prospects of the investment. The result is that investors frequently hold onto their “losers” and sell their “winners” to soon. The resulting portfolio is riskier than what is optimal.
Overconfidence Bias: The name says it all. This is an emotional bias that sometimes can creep into the financial professional’s realm. An “unwarranted faith in one’s own intuitive reasoning, judgements or cognitive abilities”, as described by the CFA Institute, can sometimes be the side-effect of a single or handful of past investment successes. It can lead to excessive trading, poor diversification, and poor investment results. “Don’t confuse brains with a bull market” is an old saying on Wall Street—and we’ve found it useful advice in our career. A conscious review of gains, losses, and number of trades could be illuminating (ask your neighbor who talks often about their investment successes, but rarely their failures for this information!).
An interesting subset of overconfidence is the Illusion of Knowledge Bias. This illusion can feed overconfidence, and is frequently brought about by actually gathering too much information on an investment subject—information which isn’t relevant to the decision, or could even the product of data mining. This sheer volume of information gathered feeds the investor’s perception that they know more about the risks or return probabilities than they do, or than is even possible to know.
Endowment Bias: We have encountered this bias several times in our career. Endowment bias is most common when dealing with real estate and inherited assets. It is the tendency for investors to overvalue what they own, demanding a higher price than what they would be willing to pay for the asset if they didn’t already own it. Rational investors are assumed to be willing to buy/sell a security for the same price (the market price). In the case of inherited assets, the consequences include failure to sell off assets and replace them, thereby holding an inappropriate asset allocation. An appropriate question for an inheritance beneficiary who has received assets to ask might be: “if an equivalent sum had been inherited in cash, how would I invest the cash?”.
Behavioral biases can also affect markets, though markets have a way of correcting themselves quickly. Herding behavior and myopic loss-aversion are biases which can have the effect of driving market indices to occasional extremes due to the collective effect investor behaviors. In October, we referenced the Dalbar study (Quantitative Analysis of Investor Behavior) to illustrate the long-term impact of human biases on investment results. If we can come to recognize within ourselves which biases have tended to define our investment approaches, then we are taking the first step toward improving our results already.
The views are those of CCR Wealth Management LLC and should not be construed as specific investment advice. Investments in securities do not offer a fixed rate of return. Principal, yield and/or share price will fluctuate with changes in market conditions and, when sold or redeemed, you may receive more or less than originally invested. All information is believed to be from reliable sources; however, we make no representation as to its completeness or accuracy. Investors cannot directly invest in indices. Past performance does not guarantee future results. Securities offered through Cetera Advisors LLC. Registered Broker/Dealer, Member FINRA/SIPC. Investment Advisor Representative, CCR Wealth Management, LLC. Registered Investment Advisor.
Cetera Advisors LLC and CCR Wealth Management , LLC are not affiliated companies.
© CCR Wealth Management
Read more commentaries by CCR Wealth Management

 Both scatter plots show that over the last 25 years, one and five year returns after equity valuations consistent with current levels (17.5x) have been in the mid to high single digits.
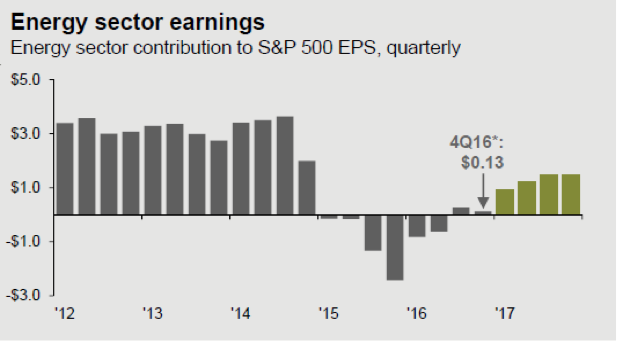
 In our January Outlook we discussed at some length that investors should not be thinking of bonds as a homogenous asset class. While it is true that all bond values share a sensitivity to interest rates (an inverse relationship), various sectors within the bond market are more sensitive than others. CCR Wealth Management has long-aligned our model bond portfolios with the credit markets (which includes investment grade and high yield corporates, mortgage-backed, and senior loans). This decision, now nearly 5 years old, was motivated by both an expanding economy and an anticipation of rising interest rates. While it took a few years for the first Fed rate hike to be realized, this credit-centric allocation has generally far-exceeded a more rate-centric approach. The trade of, as discussed in January, is that credit-oriented bonds (think virtually anything non-government) have generally higher correlations to equities, which may be disadvantageous in volatile markets.
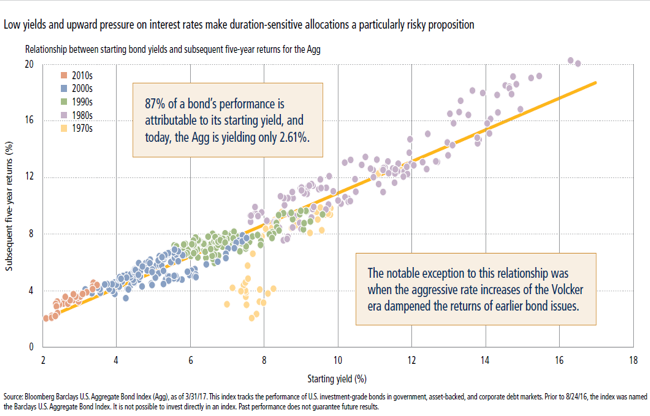
 Newton’s own seminal work on gravity, Principia, was published over thirty years prior to his foray into the South Sea Company. Unfortunatley, the fortune made discovering gravity was lost in gravity’s rediscovery. His concession reportedly included the statement “I can calculate the movement of stars, but not the madness of men”.
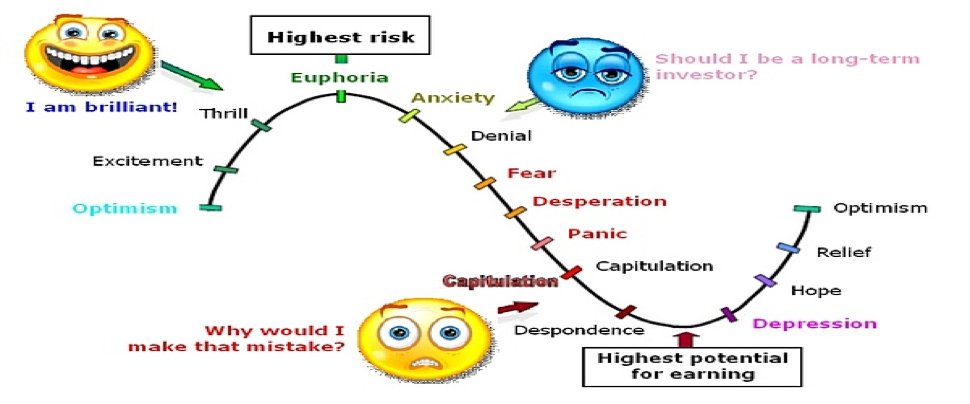 Regret-Aversion Bias fueled sir Isaac Newton’s actions during the south Sea Bubble. Regret Aversion can lead to either an act of commission or an act of omission, and describes the fear that people have that they will regret the decision made which then affects future decisions. In Newton’s case, an act of commission was fueled by regret that he had sold his shares in the South Sea Company, while his friends continue to get rich (rather than any rational review of the investment, which may have revealed its imminent collapse).