Summary: US indices closed lower this week, but not by much. SPX lost just 1% and is just 3% from its all-time high. A number of notable short-term extremes in sentiment, breadth and volatility were reached on Thursday that suggest equities are at or near a point of reversal higher. The best approach is to continue to monitor the market and adjust with new data. That said, it's a good guess that SPX still has further downside in the days/weeks ahead.
* * *
Our last several posts have emphasized several points:
Strong uptrends (like this one) weaken before they reverse, meaning the current sell off is unlikely to lead directly into a major correction.
Even years with powerful returns (like 2013) experience multiple drawdowns of 3-8% along the way, meaning the current sell off was due and is perfectly normal.
There are a number of compelling studies suggesting that 2017 will continue to be a good year for US equities, meaning equities will likely end the year higher.
Read more on these points here and here.
SPX ended the week at 2328, 3% off it's all-time high (ATH) made on March 1. That is a very mild drawdown. Our post last week argued that a sell off to at least the 2300 area (4% off the ATH) was likely. From that respect, a lower low is likely to still lie ahead. That post is here.
There were a number of notable short-term extremes in sentiment, breadth and volatility reached on Thursday that suggest a rebound in equities is ahead. Let's review these.
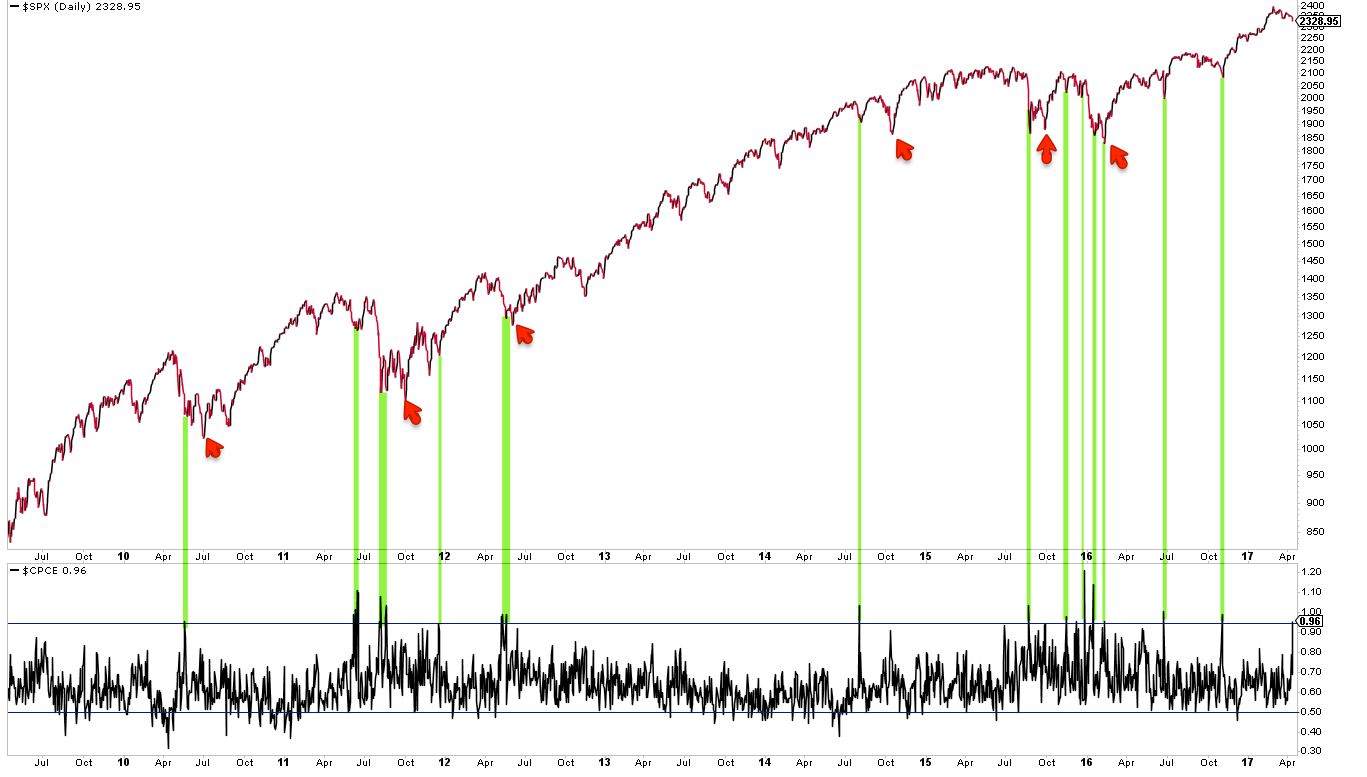
First, the equity-only put/call ratio reached a rare extreme on Thursday, with nearly as many puts as calls being traded on the day. That has happened only about a dozen times in the past 8 years. All of these have been at or near a short-term low in SPX (green lines). A rebound is likely ahead. That rebound might not last long, however: note that in several instances, the low was retested or exceeded in the days/weeks ahead (red arrows). Enlarge any chart by clicking on it.

Second, Trin (also called the Arms Index) closed above 2.0 on Thursday. Trin is a breadth indicator derived by dividing the advance-decline ratio for issues by that for volume. A close over 2 means that down-volume was twice down-issues; in other words, stocks fell on relatively high volume.
A spike higher in Trin like yesterday's can often be near a low in equities. That is particularly true when the spike higher in Trin has occurred after several days of selling, like now. In this case, a high in Trin marks capitulation. A relevant post on this indicator is
here.
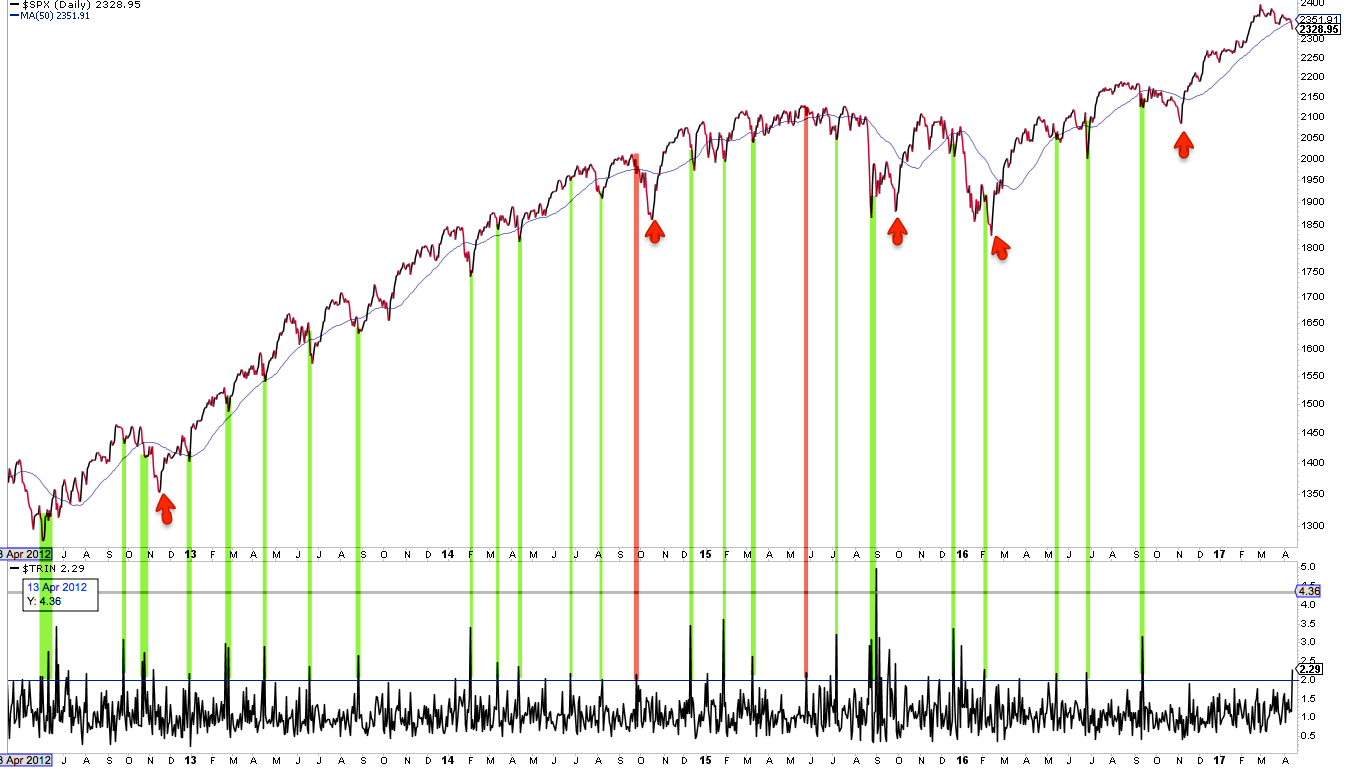
Similar spikes in Trin over the past 5 years are shown below. A rebound is likely ahead. But, like the put/call ratio discussed above, that rebound might not last long: note that in several instances, the low was retested or exceeded in the days/weeks ahead (red arrows). Take last September as an example: SPX rebounded to its 50-dma (blue line) before falling further into the November low.
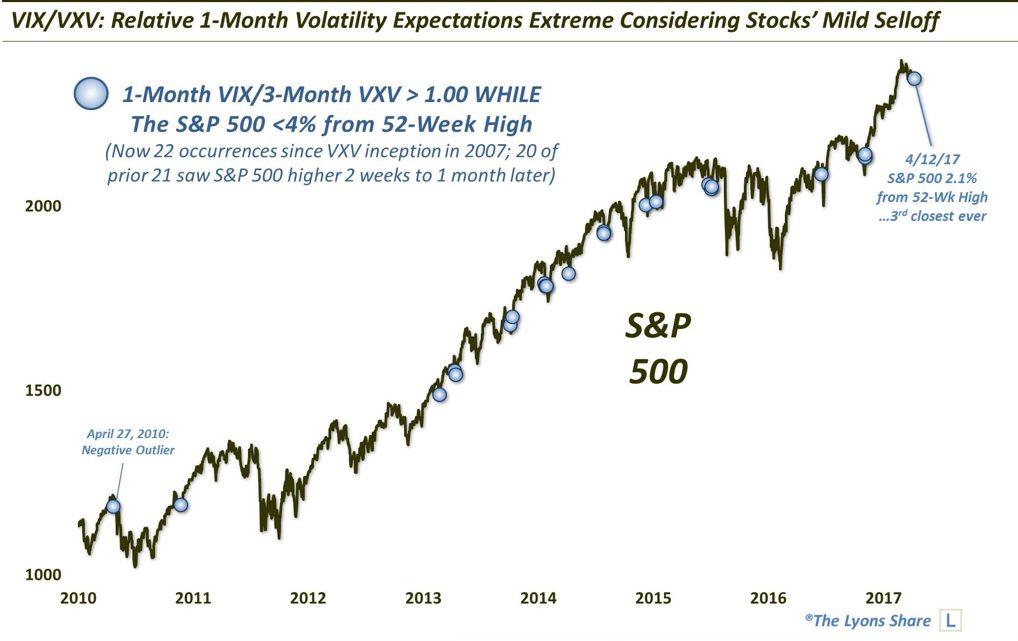
The third short-term extreme reached on Thursday was in the volatility term structure: when one-month protection is trading at a premium to three-month protection, equities have been at or near a point of reversal higher. Similar instances over the past 8 years are show below (green lines). Like the other two studies above, it is notable that the low was retested or exceeded in the days/weeks ahead in several instances (red arrows).
When the volatility term structure is in its current configuration and SPX is also near a 52-week high, equities have been higher 2-4 weeks later in all cases except one over the past decade (from Dana Lyons).
Finally, the VIX spiked up 24% this week, an extreme given that SPX lost only 1%. VIX has closed outside its upper Bollinger Band 4 days in a row. This has happened only 17 times since the year 2000, and in all cases except one, SPX was higher 2 days later by an average of more than 3% (from Kora Reddy).
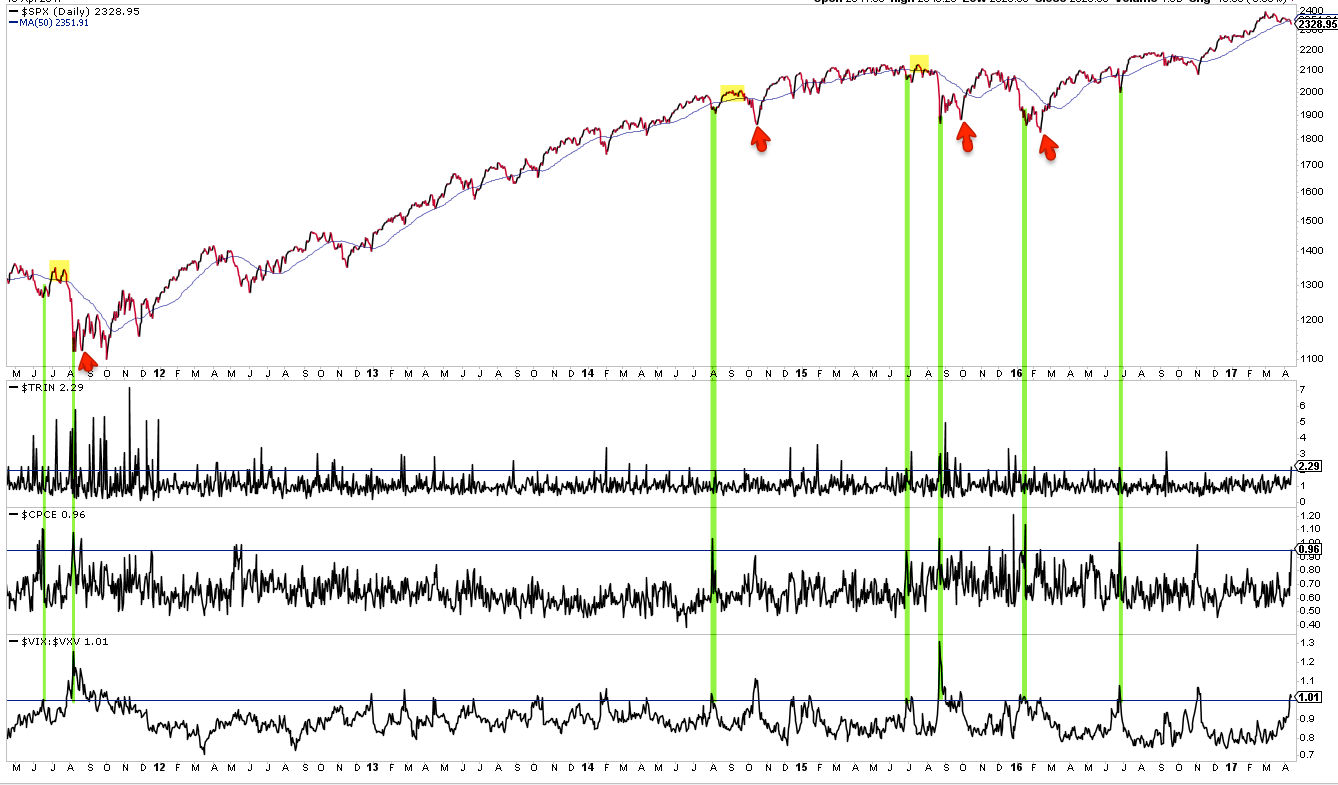
In summary, there were a number of short-term extremes reached on Thursday. Moreover, these all happened on the same day, which is even less usual. Prior instances are shown below (green lines). A rebound looks likely, but that doesn't necessarily mean that a lower low isn't ahead: again, it's notable that several of these failed in the days/weeks ahead (red arrows). Three cases where the rebound ended after the 50-dma (blue line) was retested are highlighted in yellow.
Uptrends "impulse" higher as buyers chase the indices. But over the past 3 weeks, SPY has lost $3.7 overnight while the index itself is only marginally lower. There is no incentive to chase price if almost every day starts lower than the prior close. It will be a positive sign if this pattern starts to change.
It will also be a good sign if the SPX can regain its 50-dma and then regain its (falling) 13-ema. Uptrends are partially defined by the ability to stay overbought, so following momentum indicators (like RSI(5)) will be a good tell.
In short, the best approach is to continue to monitor the market and adjust our expectations as new patterns and behavior emerge.
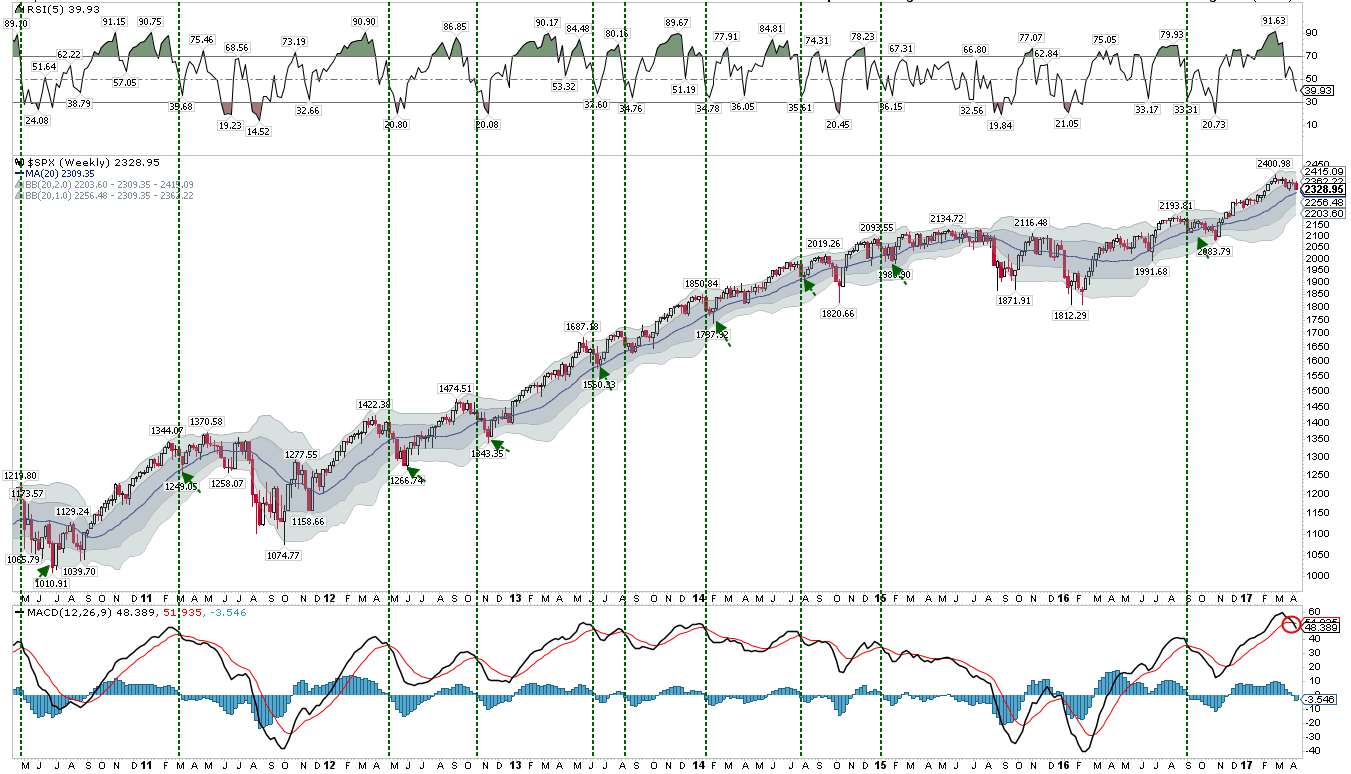
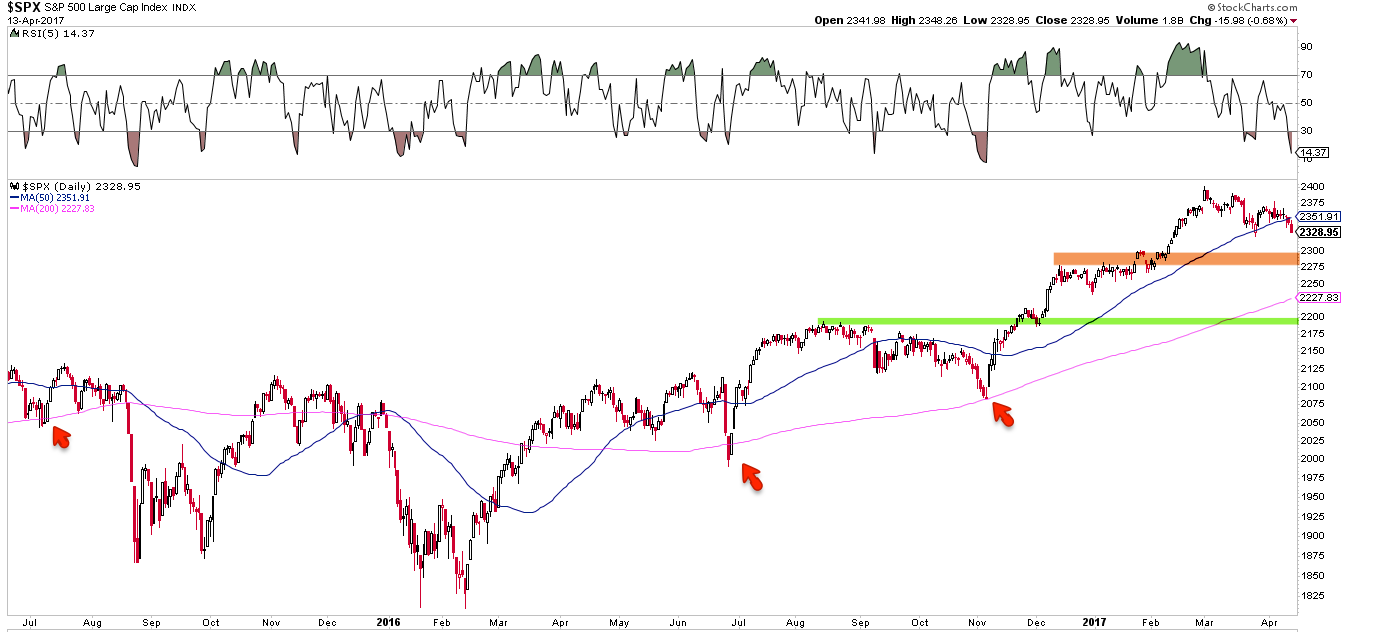
That said, it's a good guess that SPX has further downside ahead. The charts below are from last week: when SPX losses momentum (vertical lines), it then typically falls to its 20-wma or lower Bollinger (arrows), implying a move to 2300 to 2200, respectively (first chart). Those price levels correspond to strong support from last autumn and winter (second chart).
On the calendar this week: earnings reports start in earnest; housing starts and permits and industrial production are on Tuesday; and options expiration is on Friday.
© The Fat Pitch
http://fat-pitch.blogspot.com
Read more commentaries by The Fat Pitch