What is going to be the best performing asset class over the next 3-5 years? This is a question that “experts” frequently answer with a high level of conviction. In our view, it is dangerous for investors to overly rely on such predictions for two main reasons:
- The best asset is highly dependent on the economic climate; and
- Guessing how the economy is going to evolve is very difficult.
Dependence on the Economic Climate
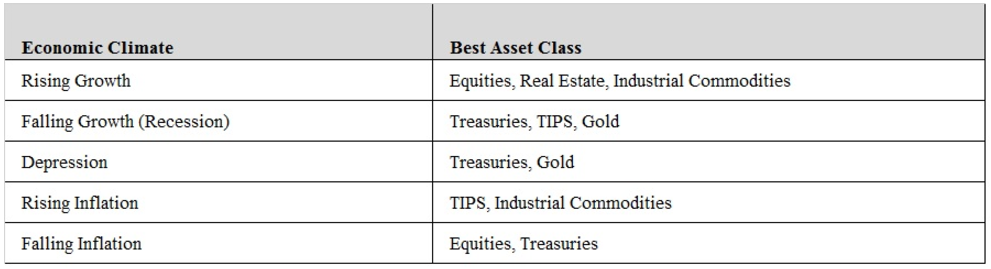
The economic environment largely explains asset class performance. The logic is straightforward and intuitive. The best asset class in an economic downturn is different from the best in an economic boom. Likewise, if inflation suddenly spikes then certain assets are biased to do well, while a fall in inflation benefits other market segments.
Table 1 provides a summary of the economic climate in which each major asset class tends to outperform.
Table 1: Economic Bias of Asset Classes

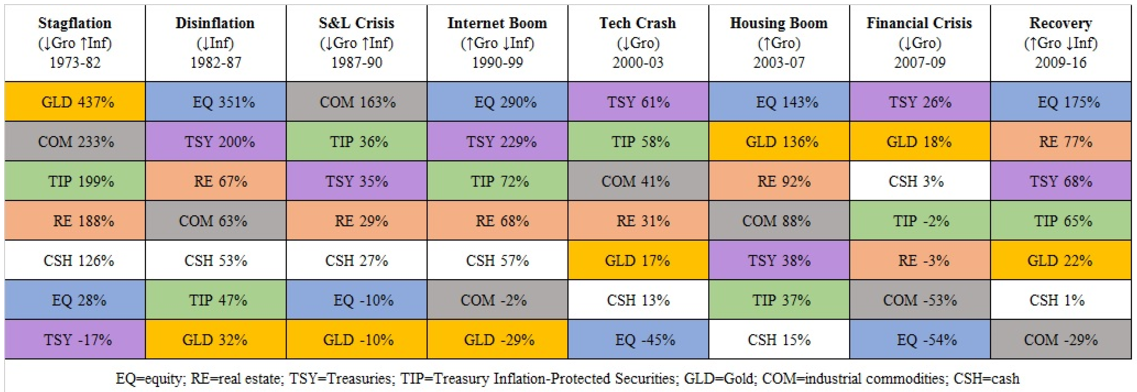
To prove the point with historical data, Table 2 shows cumulative asset class returns since 1973, broken down into distinct economic periods. The table also lists the dominant driver to help you connect the economic bias of each asset class to how it performed during the period (note that there are additional influences that also impact prices so the correlation won’t be perfect).
Table 2: Asset Class Performance in Different Economic Environments(1)
You can observe the relationship between asset class returns and economic outcomes, as well as the constant changes in leaders and laggards. Notice the wide swings in asset class returns as the environment changes. Often times the best asset in one environment becomes the worst in the subsequent environment (and vice versa). This highlights the danger of investing in those asset classes that have recently performed best. Sadly, human emotion leads most investors to adopt this exact approach.1
Difficulty in Predicting the Economic Environment
If we know which assets tend to perform best in certain economic climates, then why don’t we just invest according to our economic estimates? Surely, experts in the field should offer useful insight into the changing landscape.
Unfortunately, this is simply not the case. Guessing the economic environment that is likely to transpire over the next market cycle is extremely perplexing. Honestly ask yourself if you or anyone you followed expected interest rates to be this low or the economy to come precariously close to a second Great Depression? Probably not.
Note the wide range of duration of each environment in Table 2. Some climates lasted two years while others went on for nine years. The current period has lasted eight years. This sort of variation is common and adds to the trouble of timing the next turn, even if you know what the next environment will be (which you probably don’t).
Indeed, predicting outcomes is exceptionally challenging, even for professional, experienced and well-resourced forecasters like the International Monetary Fund (IMF). In 2016, The Economist did a study of the IMF’s accuracy in predicting GDP by looking at their semi-annual forecasts across 189 countries between 1999 and 2014.2 In 220 instances where the economy shrank following a positive year, the IMF failed to predict a single contraction.
Adding to the complication of anticipating market moves is the fact that simply knowing the economic environment is not enough. In order to profit from this foresight, your view would have to be different from the consensus. If the majority of investors expect a certain economic outcome, then asset class prices will discount this result (e.g., long term bond yields will be high if investors expect high inflation). It is economic surprises that materially move the needle. Note that the cycles presented in Table 2 were all unexpected economic turns that shocked the majority of investors and thereby resulted in massive price moves. We will cover this important topic in a future ARIS Insights.
The Conventional Portfolio
If these observations are true, then why do the vast majority of investors invest as if they know what the next investment environment will be? Most conventional portfolios own very little, if any, of the assets that tend to perform best during many potential economic outcomes as described in Table 1.
The majority of portfolios are invested in assets that are biased to perform well during a relatively small number of potential economic climates. The largest percentage of assets held in portfolios today is equities (which happens to be the best performing asset over the past eight years). This concentration means that portfolios are positioned for a strong growth and low inflation environment. It is as if everyone has very high conviction that the future will continue to look like the recent past. Certainly, recent strong returns have added to the comfort and complacency in maintaining an equity-oriented allocation. However, history has taught us that the economy frequently experiences sudden and dramatic changes, leaving investors exposed to painful losses. In fact, in just the past 17 years, we have seen the global equity market fall approximately 50% on two occasions.
Concentrating in a single asset class (typically equities) is one of the biggest mistakes that investors make. At least a portion of portfolios should be allocated to market segments that perform well in different environments simply because the future is unpredictable. Given the wide range of potential economic outcomes in today’s unique and uncertain times, we continue to believe that a balanced portfolio that includes these diversifying assets is sensible and prudent.
Important Information
PAST PERFORMANCE IS NOT AN INDICATION OF FUTURE RESULTS
Advanced Research Investment Solutions, LLC (“ARIS”) is an SEC-registered investment adviser that provides investment advisory services and investment consulting services to a select set of clients and pooled investment vehicles. None of ARIS’s services are intended to represent a complete investment program.
The views and opinions expressed in this publication are provided for illustrative purposes and general information only, and do not constitute specific tax, legal, or investment advice to, or recommendations for, any person. We suggest that you consult your financial or tax advisor, accountant or attorney with regard to your specific information.
The details contained here are for information purposes only and should not be considered as an offer, or solicitation, to deal in any of the investments mentioned herein. ARIS does not warrant the accuracy, adequacy or completeness of the information contained herein and expressly disclaims liability for errors or omissions in such information and materials. Different types of investments involve varying degrees of risk, including possible loss of the principal amount invested. Therefore, it should not be assumed that future performance of any specific investment or investment strategy (including the investments and/or investment strategies recommended and/or undertaken by ARIS), or any non-investment related content, will be profitable, equal any corresponding indicated historical performance level(s), be suitable for a client’s portfolio or individual situation, or prove successful. Nothing contained herein is intended to predict the performance of any investment. Any research or analysis used in the preparation of the information has been procured by ARIS for its own use and may have been acted on for its own purpose. Some of the information may contain projections or other forward looking statements regarding future events or future financial performance. These statements are only predictions, opinions or estimates made on a general basis and actual events or results may differ materially.
This information does not provide financial or investment advice and does not take into account the particular financial circumstances of individual investors. Before investing, investors should seek their own professional advice.
Neither ARIS nor any of its employees, affiliates or agents has given any consideration to nor have they or any of them made any investigation of the investment objectives, financial situation or particular need of the reader, any specific person or group of persons. Accordingly, no warranty whatsoever is given and no liability whatsoever is accepted for any loss arising whether directly or indirectly as a result of the reader, any person or group of persons acting on any information, opinion or estimate contained herein. ARIS reserves the right to make changes and corrections to any information at any time, without notice.
The information contained herein and the opinions expressed herein are those of ARIS as of the date of writing, are subject to change due to market conditions and without notice, and have not been approved or verified by the United States Securities and Exchange Commission (the “SEC”), the Financial Industry Regulatory Authority (“FINRA”), or by any state securities authority.
This publication is not intended for redistribution or public use without ARIS’s express written consent.
1 Data sources: Bloomberg, Bridgewater Associates, Federal Reserve Bank of St. Louis, Ibbotson, Roger G. 2016 SBBI Yearbook. Indices used: equities (MSCI World Index); real estate (NCREIF Index 12/31/77-12/31/16, FTSE NAREIT Index 12/31/72-12/31/77); Treasuries (Barclays US 20-30 Year STRPS Index 1/31/97-12/31/16, 190% of Barclays Long Treasury Index excess returns plus cash 1/31/73-1/31/97, Ibbotson: 190% of Long-term Government Bonds excess returns plus cash 12/31/72-1/31/73); TIPS (Barclays US Treasury Inflation Notes 10+ Yr. 6/30/00-12/31/16, 170% Barclays US Treasury Inflation Unhedged Index excess return plus cash 3/31/97-6/30/00, 140% Bridgewater TIPS simulated excess returns plus cash 12/31/72-3/31/97); gold (gold spot price); commodities (S&P GSCI Total Return Index); cash (Merrill Lynch 3-Mo. US Treasury Bill Index 12/31/77- 12/31/16, FRED 3-Mo. Treasury Bill 12/31/72-12/31/77). Note: in order to compare asset classes at a similar risk level (so that they have similar magnitude price moves), we are using long duration indices for both Treasuries and TIPS. Periods used: Stagflation 12/31/72-7/31/82; Disinflation 7/31/82-8/31/87; S&L Crisis 8/31/87-9/30/90; Internet Boom 9/30/90-12/31/99; Tech Crash 12/31/99-3/31/03; Housing Boom 3/31/03-10/31/07; Financial Crisis 10/31/07-2/28/09; Recovery 2/28/09-12/31/16.
Read more commentaries by Advanced Research Investment Solutions