Greetings this New Year from our new office facilities in Westborough, MA. We hope you will find time to stop in if you are in the area!
Our office is clearly not the only new development since we sent out our October Outlook. The United States has a new President, and a new political party controls the Executive Branch for the first time in eight years. The same political party holds the Executive Branch and both houses of the legislature for the first time in six years. We have a new Fed Funds target range of 0.50% to 0.75% after the FOMC raised rates by 25 basis points on December 14, only the second interest rate hike in over 10 years. There is, it seems, a somewhat different mood permeating the US markets since the election in November. Optimism has swept the Dow, S&P and NASDAQ, lifting broad equity indexes to new highs, while this same optimism has hit the bond market rather hard. In our view, this mood change may be based on assumptions which could whither somewhat as actual policies begin to form and political realities unfold in the New Year. We’ll discuss all these topics further-on in this month’s Outlook.
After our Market Outlook, we continue our discussion of Behavioral Finance which we began in October. As promised, this month we will review a handful of specific behavioral biases.
MARKET OUTLOOK
The S&P 500 and Dow broad indexes were up double-digits in 2016, very different from the prior year’s flat 1.38% (a return which amounted to less than its dividend yield).
Please remember how the year began. On January 7, last year, Money.cnn.com posted: “Dow Has Worst Four-Day Start to a Year on Record”. Marketwatch.com’s January 15th headline read: “US Stocks Post Worst 10-Day Start to a Year in History”. On January 16, the Financial Times’ (ft.com) headline confirmed: “Wall Street Makes Worst-Ever Start to a Year”. The media narrative seemed to be that recession was all but certain.
In October, we cited the “unloved” nature of this bull market. Suddenly, we find the anchors of CNBC on “Dow 20,000 Watch”. As we write, this absurd vigilance has been going on for the better part of three weeks in the media, with often breathless updates every 15 minutes or so. The anticipation is palpable, but the stakes could not be lower. Reiterating a point that we’ve made in this publication a few times; the level of the Dow, the S&P or any other index is meaningless—yet so much attention is paid to it. Index levels (like “Dow 20,000”) are simply the product of the formulaic construction of the underlying constituents. Index levels speak nothing about whether stocks are “expensive” or “cheap”. About the only thing we can glean from “Dow 20,000” is that the bull market is still on.
For a more nuanced and descriptive look at what market levels may be inferring we must turn to relative price multiples.
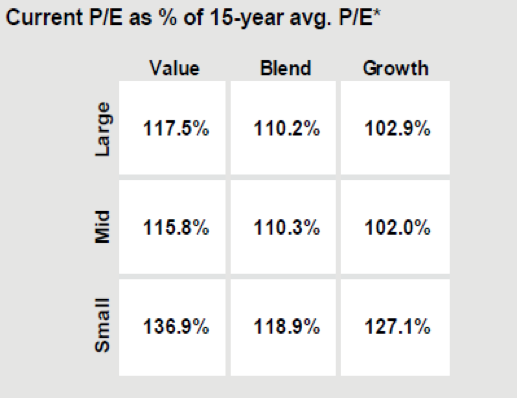
This chart is the December 30 update of the September 30 P/E chart we printed in our last issue. Our comments then: “[stocks] while not particularly expensive, have not been cheap, we are definitely seeing pockets in the market that can now be described as historically expensive. We do not apply this view to the market as a whole. So-called “value stocks” which tend to share high-dividend/low P/E ratio valuation and lower volatility characteristics now appear quite richly valued. As the chart to the right depicts, some areas of the “value” style are trading 115%-116% of their historical averages.”

As you can see from the updated chart, large-cap value stocks have edged up since then to 117.5% of their historic multiple. But notably, small cap value stocks went from 107.1% on Sept. 30 to 136.9% of their multiple in just 12 weeks! This is a nearly 28% multiple expansion, and is explained primarily by the fact that the small cap value stock universe (as defined by Russell) is about 1/3 financial companies. The real measure of an advancing stock market is in P/E expansion, and here CCR Wealth Management sees the true impact of US Presidential Election. Expanding P/E’s are generally a symptom of higher earnings expectations in the future.
In our post-election client portfolio reviews we have frequently mentioned Productivity, Policy, and Politics as the likely drivers of both return and risk in 2017. Productivity, as measured by GDP, has been solid here in the US, and the third quarter 3.50% GDP (after the third revision) can even be called mildly impressive given the subdued nature of this eight-year recovery. Policy on the other hand is a more complex topic. Economies have historically been guided and nudged by monetary policy and fiscal policy. To us, evidence suggests monetary policy has been exhausted as an effective stimulus in the US and abroad. While much of the stock market’s recovery since 2009 has been attributed to extraordinarily low interest rates for a prolonged period, there are dangers. Investors, particularly retirees, have been forced into larger equity allocations to achieve the required rate of return on their nest-eggs. Lifelong expectations of holding a less risky portfolio in retirement that distributes sufficient income have not been met because monetary policy both here and abroad has been left to singlehandedly support markets, tame unemployment and grow economies. Fiscal tools, such as tax reform or infrastructure investment have been largely left in the tool bag. Even in Europe, Mario Draghi introduced language after the ECB meeting last month that suggested a possible admission that such extreme monetary excursions may have run their course without fiscal reform. Having largely failed to meet their inflation goals, a policy of possibly extending QE was announced, but with tapered monthly bond purchases. Perhaps a trial balloon of sorts, the announcement seemed to sow some temporary chaos in European financial markets. It’s becoming clearer that without fiscal stimulus, the EU recovery will continue to flounder.
The run-up in equities (and interest rates) since the election is an anticipation of fiscal stimulus here in the US. The promise of fiscal stimulus as policy versus fiscal austerity will be welcome in many sectors of the economy, including financial, energy and healthcare. Fiscal stimulus in the form of infrastructure spending would also be welcome.
Lastly comes Politics, which dove-tails with both productivity and policy. While we see productivity and fiscal policy as being net positives for the US, we view politics as a bit of a wild card both here and abroad. Equity and bond returns, as well as volatility are likely to be defined by political rumblings around the world in 2017 in our view.
We will make a distinction here to acknowledge the history being made among the world’s developed democracies. We have, in the past, unequivocally discounted the outcome of electoral votes here in the US as great and predictable harbingers of the market’s direction. Generally, the choices that have been presented in recent decades have been somewhat left of center, or somewhat right of center. Change, however, came slowly due to our ingrained, constitutional system of checks and balances. We think it’s fair to say that while the “choices” presented during campaign cycles over the last few decades have been modest, actual governing policies more recently have challenged even our system of checks and balances. Our reading of both the election result and exit polls lead us to believe that populism won the day on November 8th, as it did in Britain on June 23rd. Populism is defined in the Encyclopedia Britannica as a “political program or movement that champions the common person, usually by favourable contrast with an elite. Populism usually combines elements of the left and the right, opposing large business and financial interests but also frequently being hostile to established socialist and labour parties”. We think exit polls after November clearly set this election result apart from the traditional and moderate toggling between “center-left” and “center-right”. So perhaps we must eat crow in the end, as markets have reacted clearly to this election result, and may be moved again in the months ahead by others.
DOMESTIC EQUITIES
We believe investors should be encouraged by the prospects of both corporate and individual tax reform and the promise of regulatory easing across sectors here in the US. But populism is not an economic platform so much as it is a cultural revolt. We see potentially countervailing forces of protectionism and rising tensions among trade partners as possible causes of significant market concern later in the year. We are most concerned that recent uses of “Executive Orders” not continue as precedent to pursue these counter-productive ends by the next administration. Equity markets in the US have rallied impressively since the election. Nearly half the S&P 500’s 2016 return is attributable to this eight week stretch. We must point out that though that not a single policy has been enacted yet, and as illustrated above—stock valuations are even more advanced than they were in September. A pause, or even mild retracement is a plausible scenario in the near term as Donald Trump’s campaign promises are reconciled with Congress. Furthermore, picking “winners and losers” will likely be more complicated than the simple narratives we have read about (“buy infrastructure”, “sell Mexico”) as the still strengthening US dollar will have an unpredictable impact on earnings.
Recent trends in equities which we believe have the most staying power include the strength in financial stocks, and the improvement in energy stocks. We believe healthcare (which has lagged the broader market since the election) is attractive, particularly biotech.
GLOBAL EQUITIES
Politics will remain a market force around the globe, and with populist sentiment running strong. We see continued opportunity for volatility to return, despite the optimism recent market moves have expressed. Just last month, Italian voters rejected then-Prime Minister Matteo Renzi’s constitutional bid to reform government. Our reading is that these reforms could have streamlined pro-growth policies in Italy’s future.
Several important European elections occur in 2017 in the Netherlands (March), France (April first round, May second round) and Germany (between August and October). Terrorism, immigration, and a general frustration with the EU governing body has fueled populist political parties and candidates in all these countries, and these elections all appear too close to call. The European economic union seems in an increasingly precarious position, given the clearly unpredictable nature of the electorate around the developed world these days (see “Brexit”, “Trump”). If the prospects of an unraveling EU appear closer with a Le Pen victory in France, a Wilder victory in the Netherlands, or a Merkel defeat in Germany, we would expect an increase in volatility in both Europe and around the globe. Also—let us not forget that Britain is scheduled to invoke Article 50 in March against the backdrop of all these elections, thus officially beginning the process of extricating themselves from Europe financially. This busy political calendar keeps us slightly underweight non-US equities in our investment models.
Summing up our view of global equities, we are bullish given the prospects of fiscal stimulus in the US—and perhaps more modestly abroad. But we think this up-side potential comes with fatter tails in the distribution probabilities of risk, with negative “surprises” keeping volatility alive in 2017. Investors often have short memories, and our counsel is not to complacently assume the market conditions of the last two months is a “new normal”.
FIXED INCOME
The Federal Reserve should be seen at the center of concentric rings in their influence on capital markets. The impact of Fed actions (interest rate changes) ripple outward, and mildly dissipate as it passes through different asset classes—from bonds first, to equities, then to real assets. The smallest rings in this metaphor, those closest to the center, represent the shortest-term government bonds. Short-term corporate bonds surround these (these assets are also referred to as “short duration”). Further out are longer term bonds—first government, then corporate. Rings even further out include equities (with different sectors and market caps occupying their own “rings”).
Please note that government bonds are always closest to the action of interest rate changes (relative to their corporate counterparts), and short duration bonds are closer to the center than longer-maturities. This is because government bonds are considered “risk-free” from credit concerns and interest rates hikes are their primary source of risk. Meanwhile longer term bonds are more “cushioned” from interest rate exposure because holders are compensated with higher interest payments. There is a limit to how valuable this compensation is sometimes.
These generalities hold true when the kinetic energy emanating from the center amounts to a ripple. What about a splash? Splashes are generally un-forecasted events which affect the market’s expectations of future interest rates. Janet Yellen, Ben Bernanke before her, and Alan Greenspan before him have all taken great pains in their public commentary to avoid overly vague language that could be open to widely divergent interpretations—or to shift market expectations in a slow and predictable vs. abrupt and chaotic manner. An example of the latter could be said to be Dr. Bernanke’s less than elegant introduction of the term “taper” to the quantitative easing policy in 2013. Bond yields immediately soared, and stocks dropped sharply. In a sense, this was a “splash” at the center, and in such cases the ripple turns into a wave.
As many know—it wasn’t just stocks that were affected by the fallout of the US Presidential election. Bond yields rose sharply (bond prices declined sharply). The market’s interpretation of the election was a positive for stocks for the reasons we’ve mentioned. However, the prospect of fiscal stimulus boosting economic output also brings about the prospect of higher inflation—and a more aggressive Fed. In early November, we attended a due-diligence meeting at the home office of one of our asset managers, which happens to be one of the largest bond management firms in the world. Their research (and a point of concern) showed that the general bond market was only pricing in about one rate-hike over the next 5 years, and only 6 over the next 10 years.
The bond market has “corrected” since the election to factor in higher growth. The “left tail risk” in the bond market remains the prospect that the Fed could hike rates more than once in 2017, or hike by more than 25 basis points (0.25%) at a time. In this scenario, ripples could become waves.
CCR Wealth Management’s strategic view of bond portfolio management when considering these risks remains centered on diversification, though with a more cautious view on “short duration” strategies. Short duration bond funds are generally designed to exhibit lower sensitivity to rising interest rates, while having a dampening effect on the overall bond portfolio volatility. This holds generally true during “ripple” environments. Our concern is that in “wave” environments, many investors may have underestimated the potential downside all assets, including short duration strategies, could exhibit.
Our final comment with respect to fixed income concerns municipal bonds. Over the last six weeks CCR Wealth Management has been deliberately increasing our allocation to municipal bonds, where appropriate. Municipals bonds were hammered after Trump won the election on the snap reasoning that lower tax rates make tax-free bonds less valuable. Candidate Donald Trump floated an across-the-board individual tax-rate reduction in the top marginal rate from 39.6% to 33%. Dan Solender, Lord Abbett Partner and Director of Municipal Bonds recently pointed out in a Market View column a comparable situation when George W. Bush was elected in 2000 on a platform of reducing tax rates.
“During 2000, the ratio of Municipal Market Data’s (MMD) ‘AAA” rated municipal bond yield to 30-year Treasuries averaged 96%. Over the second half of the year, when President Bush was elected, the ratio stayed around an average of 96%. In 2001, when tax rates were first lowered, the ratio dropped to an average of 93% during the first half of the year, then moved up to 94% over the second half”.
In other words, like today, municipal bonds dropped in price ahead of expected tax cuts. But instead, “in 2001 municipal bonds actually outperformed Treasuries while tax rates were falling.”
Also cited in the Market View was a Citi Research report which found that “between 1980 and December 2016, the top marginal tax-rate for municipals fluctuated in the range of 28%-70%. Yet the report found no correlation between municipal bond yields and the top marginal tax rate. This is likely because the average [effective] tax-rate for municipal holders has remained steady around 25%”. We believe the ingredients exist for a reversion to the mean in the municipal market, and the opportunity to add incremental return to bond portfolios could result.
BEHAVIORAL FINANCE
As you know, our market reviews strive to bring the reader a more in-depth understanding of the financial markets. In this light, we continue our ongoing conversation of emotional and cognitive biases. As advisors, we’ve seen the effects of biased decision-making over the years and how they can undermine successful long term investment plans. Market volatility in 2016 has certainly provided ample opportunity for our biases to derail investment strategies. Recalling a few specific themes discussed in October:
- According to the Dalbar Quantitative Analysis of Investor Behavior, the average annual return for most investors going back 20 years is 2.1%, underperforming even inflation. According to the study, the number one factor contributing to this return is psychological (behavioral biases).
- Traditional Finance studies how investors should act (self-interested, rational, risk averse)
- Behavioral Finance studies how investors actually do act (Prospect Theory, non-optimal, loss averse)
- Risk Aversion (traditional finance): Choosing an investment portfolio with the highest expected return per an expected risk level.
- Loss Aversion (Behavioral Finance: Prospect Theory): Conflating “loss” (an outcome, a terminal condition) with “risk” (a degree of fluctuation, a temporary condition) which can cause investors to engage in sub-optimal behavior such as selling winners, holding onto losers, evaluating gains and losses based on a reference point, selling low (consistently), and holding riskier portfolios than is otherwise appropriate.
- As human beings, we are unlikely to “cure” ourselves of behavioral biases, but being aware of their existence may improve our investment outcomes.
This list is very far from exhaustive. Most of the biases chosen for this discussion are actually issues we have encountered over the year first-hand. While we don’t like to admit it, investment professionals can also be subject to some of these same biases.
Individual behavioral biases can generally be placed into one of two categories, Cognitive or Emotional. Cognitive biases can themselves be subdivided as either “belief perseverance” or “processing errors”. Cognitive biases are also most commonly shared by individual investors and investment professionals. As the term suggests, cognitive biases have their origins in our ability to process sometimes complex information. Human beings after all are not computers. Our ability to compute and weigh new information properly and continually as it becomes available is limited by our individual experiences, expertise and the time we can devote to this important task.
-
I) COGNITIVE BIASES--“Belief Perseverance” behavior can be thought of as cognitive dissonance. They are psychological mechanisms used to “shield” investors from what may be an uncomfortable truth, or to avoid the cognitive costs of reassessing our base-case assumptions (i.e. “starting from scratch”).
Conservatism: Investors or analysts overweight their initial beliefs. New information, when it becomes available, is discounted. The consequences often result in updating views too slowly, which can, for example, lead to holding a security too long. An investor may decide to wait for a “price target” to be met rather than sell at a small gain (or loss) despite new information which may indicate attaining such a price target is improbable.
Home Bias: Investors tend to invest in what they themselves think they know best. This can lead to poorly diversified portfolios. An under-investment in non-US investments and an over-allocation to employer stock are often effects of Home Bias.
Confirmation Bias: Looking for or noticing data which confirms your beliefs, while disregarding or underweighting that which contradicts them. Consequences include considering only “positive” information. Confirmation Bias often results in under-diversified portfolios, or holding a disproportionate amount of an employer’s stock. Investors should seek out information which challenges their beliefs.
Representativeness: This is a bias whereby investors make an incorrect assumption about an investment, or the behavior of an asset class. There are several types of Representativeness. Among them are “Base-Rate Neglect” (stocks with recent bad news tend to be treated as if bad news will affect the stock indefinitely), and “Sample-Size Neglect” (incorrectly assuming a small sample size is representative of the population). Consequences of Representativeness include adopting views almost exclusively on new information (the opposite of Conservatism). This can often result in moving in and out of investments with an undue reliance on recent performance, resulting in excessive trading and inferior results. Recall from our October Outlook: “Your portfolio is like a bar of soap. The more you touch it—the smaller it gets!” We have occasionally published a periodic table of asset and sector returns over the years to illustrate their variability in this regard.
Hindsight Bias: Hindsight Bias is the perception that past events were more predictable than they were. This is an interesting behavior and can manifest in many ways. Selective memory emphasizes a seemingly “inevitable” result, rather than all the possibilities that existed at the time that did not occur. We, as investment professionals, should be cognizant of hindsight bias when choosing asset managers (or, for that matter, firing them). Also, poorly reasoned decisions with positive results may cause a false sense of confidence, and the inverse of this corollary is also true.
-
II) COGNITIVE BIASES--“Processing Errors” tend to be just that—errors. Some processing errors include:
Framing Bias: Framing Bias refers to our reaction to how data is presented. For example, answers to common risk tolerance questionnaires often vary depending on how the question is asked. Emphasizing potential gains in a question rather than potential losses may result in misidentified risk tolerances. Framing Bias can also focus investors on short-term pricing fluctuations. In many cases, investors should eliminate gains or losses already incurred from their reasoning, and focus on the future prospects only.
This bias can also affect our interpretation of how a CEO of a publicly traded company presents information in a conference call. The positives are almost always emphasized, while the negatives are usually glossed over. Analysts must often guard against becoming “infected” with management’s enthusiasm.
Availability Bias: People tend to take a heuristic approach to estimating the probability of an outcome based on how easily that outcome comes to mind. There are several sub-sets of availability bias, so we will focus on just two which seem to affect individual investors the most in our experience.
- a) Retrievability: In a University of Chicago study, people were given a list of ten names. The ten names included 5 famous men, and 5 non-famous women. When later asked questions about the list, respondents gave answers which emphasized what came to mind more quickly. There was a near-universal impression that there were more men on the list than women. Investors may misread situations because what comes first to mind may be an experience that does not aptly apply.
- b) Categorization: We tend to gather information in “perceived” relevant search sets, which can vastly reduce our options. An American listing famous football players and famous soccer players will likely alight on more football names, whereas the set of famous soccer players is much larger—and perhaps more globally relevant. In this vein, investors may ignore total return by focusing too much attention on dividend yield, for example.
Consequences of availability bias can include choosing an investment, advisor or mutual fund based on advertising rather than analysis, limiting the opportunity set. It can also lead to a failure to properly diversify.
Cognitive biases can often be mitigated by both investors and investment professionals through a methodical process of record keeping and review.
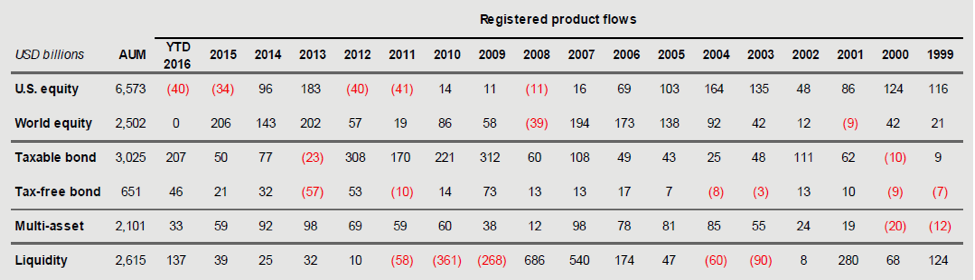
We leave you with one last graphic to illustrate the effects of behavioral biases on investment returns. As mentioned early-on in this Outlook, both the Dow and the S&P 500 turned in double-digit returns last year.
Our own Outlooks throughout the year eschewed the idea of a US recession, or a bear market in equities. Yet we fielded plenty of phone calls from clients ready to throw-in the towel, and sell out of their portfolios. Happily, we disuaded most clients from doing so. The table above, however, tells a different story about investor tendancies. This is known as a “fund-flows” table, and it captures the net in-flows and out-flows of money into all registered mutual funds and ETFs. 2016’s numbers are fairly indicative of a tendency to sell low. Equity mutual funds and ETFs experienced a net out-flow of $40 billion last year, and $34 billion in 2015. Recall that 2015 was a low-return year, and last year certainly had its bumps. Further more, bonds, which ended with a subdued return last year, received large net-positive inflows. The same anomally occurs in 2011 and 2012 after the flat return (in ’11) and a 10% correction (in ’12). Investors have a tencency to buy high, and sell low.
The biases we discussed in this issue have their roots in cognition. In most cases their effect on our investment returns can be mitigated through education, and through a more general admission to ourselves that they exist. Quite often, assiduous record keeping or notation of our decision justifications help reveal and correct recurring mistakes. Please be on the lookout for our Spring Outlook, where we will spend some time exploring Emotional Biases, which not only negatively impact our investment results, but are much more difficult to address.
© CCR Wealth Management
Read more commentaries by CCR Wealth Management