Whether you voted for him or not, we are all benefiting from the new Trump Bull Market. Isn't it great?
Maybe not. How can we tell if this is really the beginning of a new bull market?
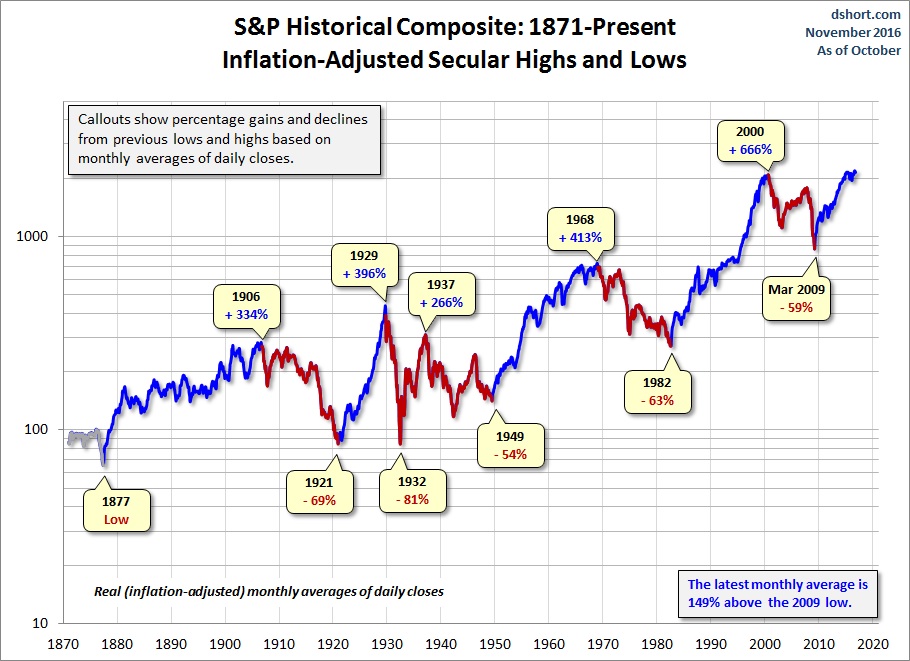
First of all, secular bull markets are rare. They are characterized by higher highs and higher lows. Since 1871, there have been only four secular bull markets, as seen in the chart below. The last bull market was from 1982 through 2000. The full cycle since 2009 isn't over yet—and the low of that year never came close to historic lows, so it wouldn't be considered a secular bull anyway.
Within a secular bull, there can be many pullbacks and rallies. For instance, the 1982-2000 bull market included the crash in 1987, the 1990 pullback and the 1994 pullback. Conversely, bear markets can have rallies that many refer to as bull markets. The rally from 2002 to 2007 is the perfect example of a bear market rally. It was a big rally, but still a rally within a bear.
So how do you know if a rising market is a new bull market, or if it is just a blow-off rally? There are five measures of value used by wise investors:
1. Price-Earnings Ratio (P/E Ratio)
Bottom line, corporate earnings are what investors pay for when they buy stock. How much are you willing to pay for $1 of earnings is the question. How much is justified? This is what the P/E ratio tells you. The higher the P/E, the more an investor is paying for $1 of earnings. Historically, the market's average P/E ratio has been around 15, according to data from Standard & Poor's.
Bull markets tend to start after a bear market that chased investors away. Investor sentiment is so bad that in order to entice investors back to the market, P/E ratios have to be extremely low. According to research by money management firm Comstock Partners, that would mean a P/E of around 8. Today's P/E for Standard & Poor's 500-stock index is about 26, more than three times higher than the typical new bull market level.
2. Dividend Yield
Although they're not required to, many companies pay dividends. This is another way to measure value. The higher the market's dividend yield, the better the value. Alternately, a low-yielding market tends to be indicative of an overvalued market. Historically, the S&P 500's average dividend yield has been around 4%. A typical new bull market has a yield of about 6%. Today's S&P 500 is yielding only about 2%.
3. Price-to-Cash Flow
Some investors and analysts believe that earnings and dividends are not reliable because they can be manipulated. Cash flow is much more difficult to manipulate. Cash flow measures money flowing into and out of a company. So it is not impacted by the same things that affect earnings and dividends. Typically, the price-to-cash flow ratio at the start of a bull market is about 5. Today, it is about 10.
4. Price-to-Sales Ratio
You don't have earnings, cash flow or dividends without sales. So measuring how the market is doing versus sales can be a very good indicator of the pulse of the market. Typically, bull markets start at a price-to-sales ratio of 0.60—meaning that for every $1 invested in the index, the investor gets $1.68 in sales. Today, the S&P 500's price-to-sales ratio is about 1.9. So for every $1 invested, the investor gets only 54 cents of sales.
5. Price-to Book-Value
This is the net asset value of a security or index. Why would anyone pay more than book value for a company? One good reason is future earnings. When buying a company, you are buying both the current assets, plus the future earnings. But book value is the starting point. According to Comstock's research, typically bull markets start with a price-to-book value of 1. So for every $1 an investor puts into the index, they are buying $1 of net assets. No future earnings are built into the price of the index. It is a very cheap price. Today, the S&P 500's price-to-book is around 2.7. So $1 of net assets of the index costs investors approximately $2.70.
Market and business cycles have the same repeating phases: the upswings and the downturns. Each may be different in its own particular way, but they are all the same in that they go up, and then they go down.
Today's market is overvalued on all of the measures mentioned above. To see each of these variables come back down to typical lows, where bull markets have started in the past, wouldn't surprise me in the least. And a wise investor should prepare for that time and be ready to act when it comes. Some moves to consider making:
- Reduce your positions in holdings with high P/E ratios.
- Raise cash to be deployed when values are better.
- If you can handle the risks, utilize inverse or bear-market strategies.
- Finally, have patience—cycles go up, and they come down. There is no reason to buy at such high valuations. Valuations always come back down.
Just because a market is moving up, it does not mean it is a new bull market. Trump may do a lot of things, but even he cannot revoke the business cycle. What has happened since the election is most likely a very emotionally charged rally that could run a bit further. But a new bull market? It is not in the numbers.
John Riley, registered Research Analyst and the Chief Investment Strategist at CIS, has been defending his clients from the surprises Wall Street misses since 1999.
Disclosure: Third party posts do not reflect the views of Cantella & Co Inc. or Cornerstone Investment Services, LLC. Any links to third party sites are believed to be reliable but have not been independently reviewed by Cantella & Co. Inc or Cornerstone Investment Services, LLC. Securities offered through Cantella & Co., Inc., Member FINRA/SIPC. Advisory Services offered through Cornerstone Investment Services, LLC's RIA. Please refer to my website for states in which I am registered.
© Cornerstone Investment Services
Read more commentaries by Cornerstone Investment Services