There are a variety of economic models that are supposed to predict the probabilities of recession.
While I don’t agree with the methodologies employed or probabilities of impending economic weakness as depicted by the following two models, I think the results of these models should be monitored.
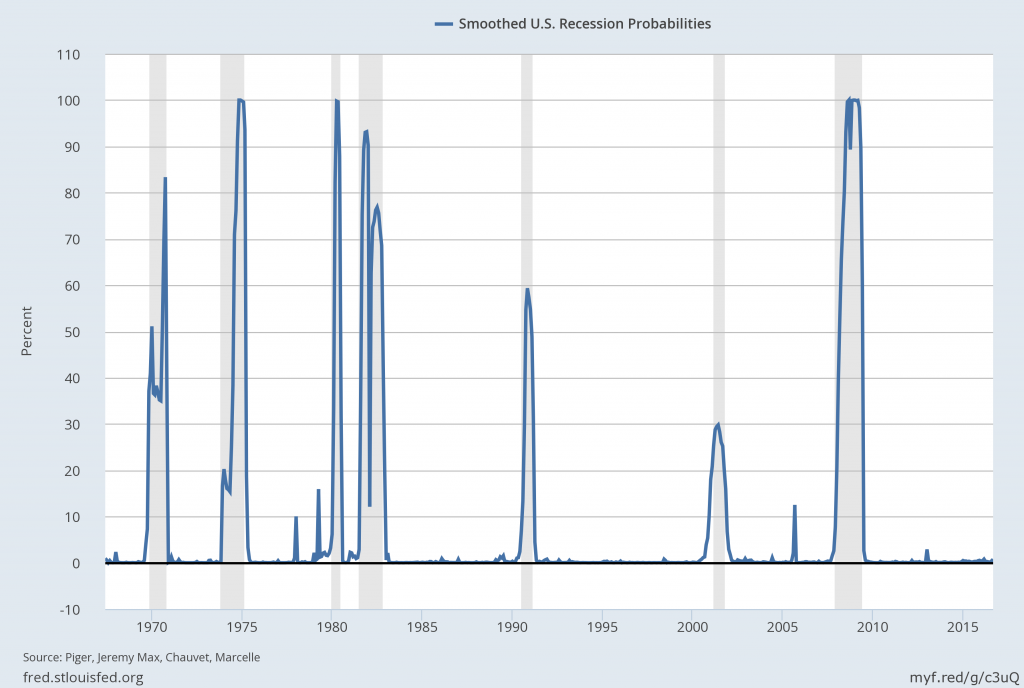
Please note that each of these models is updated regularly, and the results of these – as well as other recession models – can fluctuate significantly.
The first is the “Yield Curve as a Leading Indicator” from the New York Federal Reserve. I wrote a post concerning this measure on March 1, 2010, titled “The Yield Curve as a Leading Indicator.”
Currently (last updated December 6, 2016 using data through November) this “Yield Curve” model shows a 5.4934% probability of a recession in the United States twelve months ahead. For comparison purposes, it showed a 7.5585% probability through October, and a chart going back to 1960 is seen at the “Probability Of U.S. Recession Predicted by Treasury Spread.” (pdf)
The second model is from Marcelle Chauvet and Jeremy Piger. This model is described on the St. Louis Federal Reserve site (FRED) as follows:
Smoothed recession probabilities for the United States are obtained from a dynamic-factor markov-switching model applied to four monthly coincident variables: non-farm payroll employment, the index of industrial production, real personal income excluding transfer payments, and real manufacturing and trade sales. This model was originally developed in Chauvet, M., “An Economic Characterization of Business Cycle Dynamics with Factor Structure and Regime Switching,” International Economic Review, 1998, 39, 969-996. (http://faculty.ucr.edu/~chauvet/ier.pdf)