Investors first fell in love with American small cap stocks in the late 1970s when small companies became recognized as more nimble, fast growing, and more able to adapt to changes to technology than their bloated, plodding large competitors. Since their first great boom, US small caps have proven to have ups and downs, but continue to be the source of the great success stories in corporate America and have proven one of the most successful asset classes for active management to add value.1
So with this history, why have investors shunned allocations to international small cap stocks? While US small cap, international large cap, and even emerging markets have all attracted significant assets, international small cap in developed non-US markets remains largely uncharted territory. We believe there are a number of reasons that investors should consider an allocation to international small cap stocks, including:
- The size of the international small cap equity universe, which is largely untapped by active managers
- International small cap offers diversification to mainstream equity classes
- Exposure to non-dollar assets offers additional diversification especially if U.S. dollar weakens
- Inefficiency of international small cap market offers alpha potential for active managers
Reason 1: The Size of the International Small Cap Market
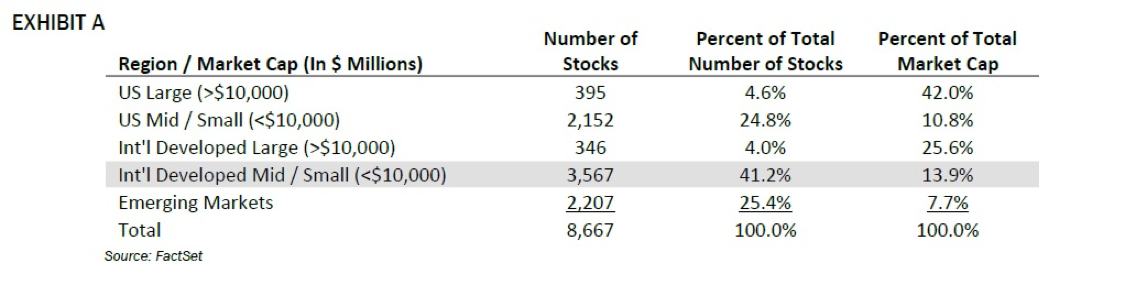
From a sheer size standpoint, we believe the non-U.S. small cap equity market is large enough to warrant interest by US investors. The table shown in Exhibit A below clearly demonstrates the dominance of the large cap US and international companies in terms of market capitalization. The combined market cap (by weight) of US and international large cap companies is about 65% of the entire universe, yet when measured as a percent of total number of companies, the large cap universes account for less than 10% of the total count.

International small and mid-cap companies represent over 40% of the number of companies around the globe and about 14% of the total capitalization of world equity markets. From a percent of market cap basis, they are larger than the emerging markets.
But more importantly – there are not many active managers focused on international small cap companies – we believe this offers some potential to exploit inefficiencies. The total assets under management (AUM) in the eVestment Alliance database for international small cap is approximately $98 billion (as of 12/31/2015), representing just 5% of the $1.9 trillion international small cap universe. Compare that to the US small cap market where eVestment Alliance indicates that $602 billion of AUM – almost a third of the available market cap ($2.0 trillion) - is being actively managed.2
The combination of these two factors: the size of the universe and the fact that only approximately 5% of the universe is covered by active managers suggests there are some opportunities to benefit from both inefficiencies and additional investment capital moving into this space. We explore the inefficiency argument more thoroughly under Reason 4.
Reason 2: International Small Caps Provide Diversification to Both International Large Cap Stocks and Domestic Small Cap Stocks
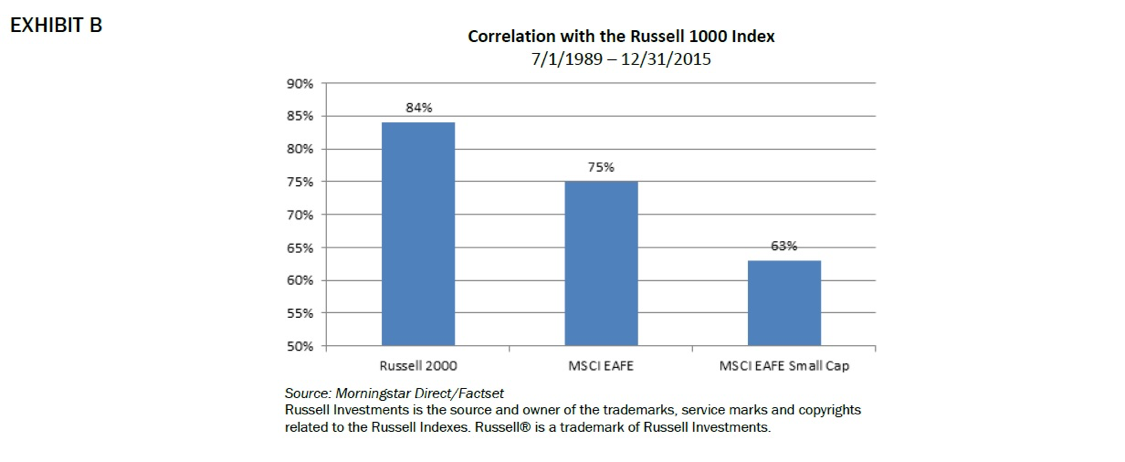
Small cap companies can offer diversification to large cap equity programs – especially since many large cap programs are benchmark-centric and therefore dominated by a small percentage of stocks relative to the investable universe. As the market cap table in Exhibit A above suggested – large cap indexes have high concentrations of individual companies. Additionally those large cap companies are typically global in nature themselves and, we would argue, much more linked to international markets and geo-political events than smaller companies (domestic or foreign). In fact, as of February 29, 2016, EAFE companies derived 58.3% of their revenues from foreign markets, while international small cap companies obtained only 36.5% of their revenues from foreign markets – providing more exposure to local market dynamics than EAFE companies. The correlation table in Exhibit B shows the added diversification benefit gained when an investor carves out an allocation to international small cap.
Reason 3: Exposure to Non-US Dollar Assets May Benefit Investors if the Dollar Weakens
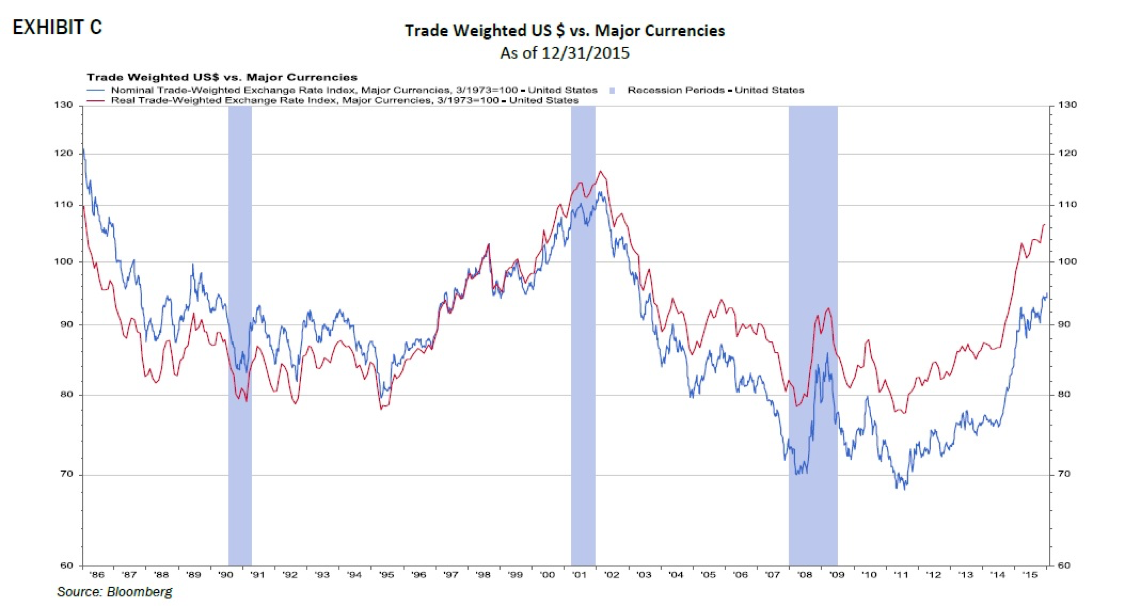
Perhaps this is more of an argument for all non-US dollar equity rather than just small cap. But assuming investors make an allocation to international small cap from somewhere other than their international large cap equity exposure, the additional international exposure could benefit an investment program if the dollar weakens. Of course, we do not know when that inflection point will occur (or whether it already has in early 2016), but as the graph in Exhibit C demonstrates, there is a clear cyclical pattern typically, i.e., once the currency starts to weaken (or strengthen), it tends to persist for a while.
In 2015, international small caps (+9.6%) were the best broad equity index of any (in $US terms) in spite of the 9.3% appreciation in the US dollar. While we do not know whether that trend will continue, we believe if we get the much awaited weakening in the US dollar, it should provide a nice tailwind for non-dollar assets.
Reason 4: With a Dearth of Active Managers Operating in the International Small Cap Equity Space, the Potential for Inefficiencies – and the Consequent Opportunity for Active Managers – Is Compelling
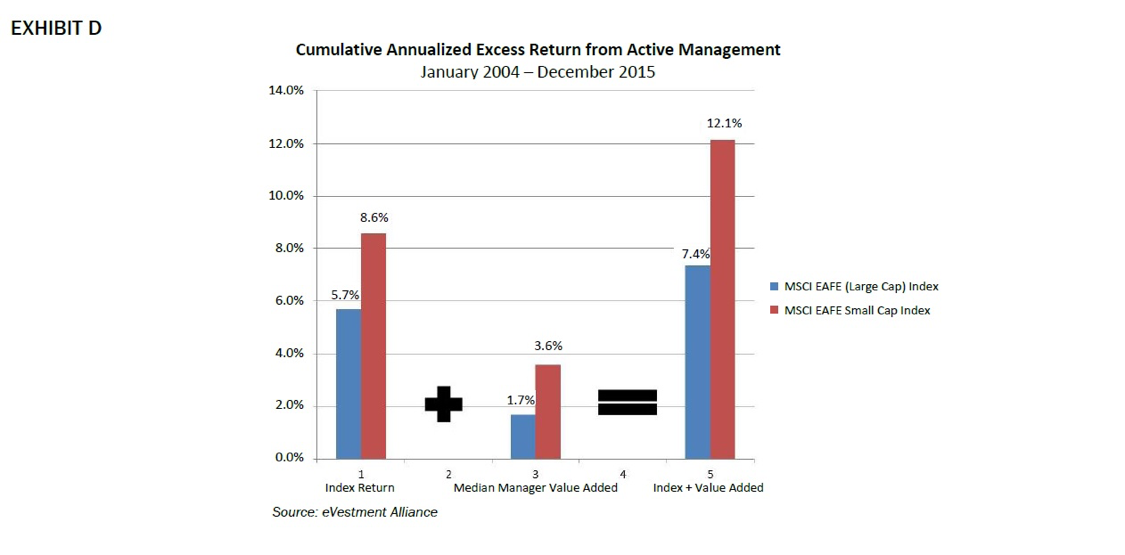
As we have discussed earlier, there are not many active managers focused on the international small company arena. However, it appears that the ones who are there do a respectable job of generating excess return versus passive alternatives. The chart below shows the median value added for international small cap managers versus international large cap managers. The index return is on the left – the takeaway is that at least in this time period (2004-2015), the median international small cap manager has been able to generate almost 2% per annum more incremental return than the median large cap international manager. So even if the index level return is similar for large and small cap international stocks, we believe the opportunity for active managers to generate incremental value added provides a strong argument for making the allocation to international small cap (and accepting the expected higher risk levels).
Food for Thought
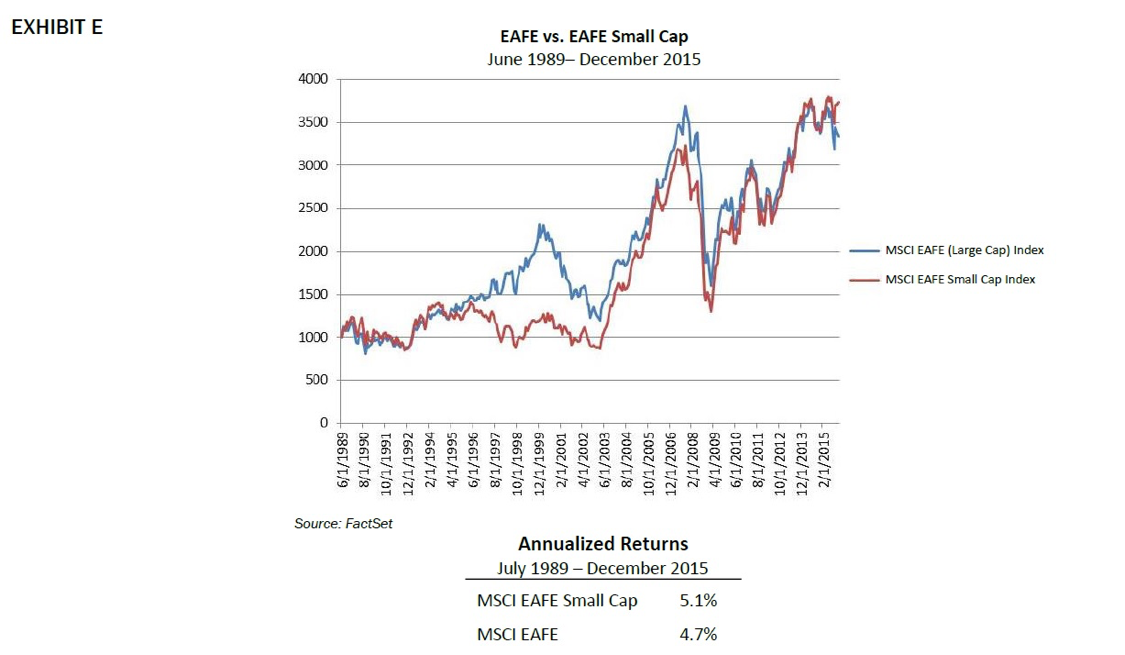
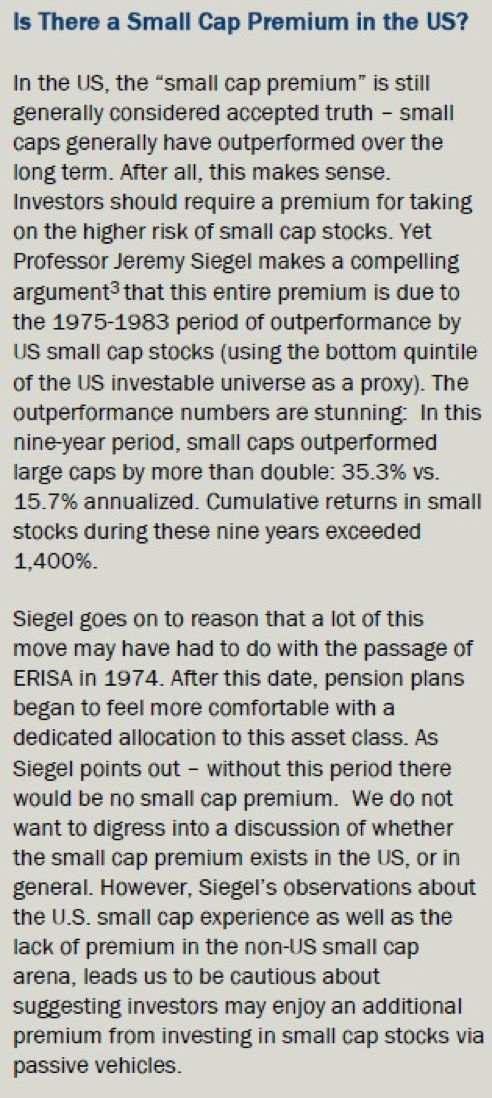
One of the arguments for international small cap investing that you may have expected to see on page one – higher returns than large cap stocks – is noticeably absent from the list. Historically, a primary argument for investing in (US) small cap has revolved around the premium returns offered by small cap stocks relative to their large cap counterparts. An abundant amount of academic research and white papers support this notion. It would seem to follow that this argument would hold true for international small cap as well. After all, the qualities that are observed in the US small cap universe that require higher premiums for investors – i.e., less liquidity, higher volatility and less access to capital should be similar in the international small cap market. Yet when we looked at the data from June 30, 1989 to December 31, 2015, as shown in Exhibit E, we saw a different pattern emerging for international small caps. (1989 was the first year MSCI EAFE small cap returns were available.) Granted this is “only” a 26.5 year period, but one would think that if there was a clear case for the small cap premium – it would be apparent over this long a period of time.
In the cumulative performance chart in Exhibit E, it is clear that there was only a nominal advantage from smaller international companies over this time frame. One interesting side note, over half of the annualized basis point differential of 0.4% was posted in 2015, when the MSCI EAFE Small Cap Index was up 9.6% vs. -0.8% for the MSCI EAFE (Large Cap) Index.
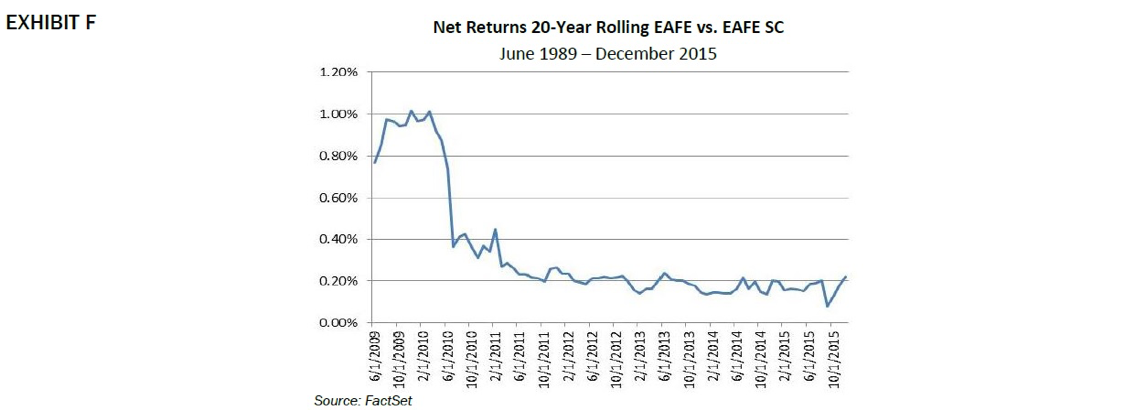
Recognizing that beginning and ending dates can have a significant impact on results, we examined the long-term data on a “rolling period” basis (Exhibit F). We looked at 78 twenty-year rolling periods (stepping by one month), which provides us with a more robust data set. We believe that twenty years is a reasonable period to assess whether there is in fact a premium for small cap stocks in the international arena.
As shown in Exhibit F, EAFE large cap outperforms EAFE Small Cap over every 20-year period – with the typical advantage being approximately 20 bps per year. Importantly, the data above refers to passive exposure only – active international small cap managers have been able to add more value than MSCI EAFE large cap managers.
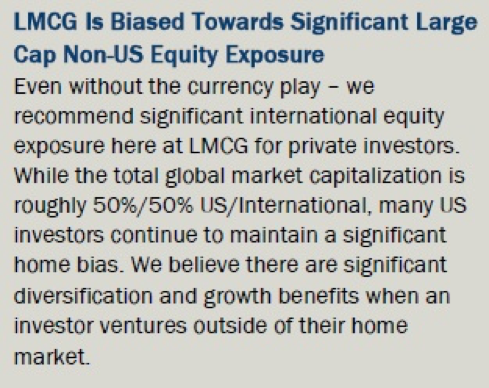
While our focus is on international small cap equities in this paper, the call-out box to the right raises some questions regarding the “conventional wisdom” that US small caps provide a premium versus their large cap counterparts.
Higher Risk from International Small Cap
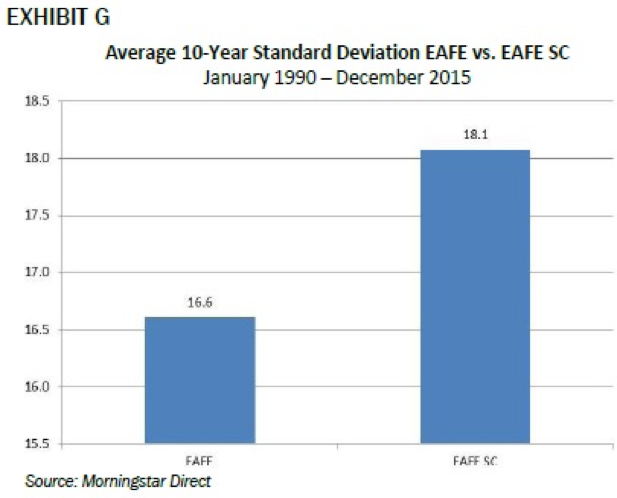
Investors evaluating a new allocation to international small cap should also be aware that international small cap equities have exhibited slightly higher standard deviation than their large cap counterparts. We looked at rolling ten-year periods (stepped one year apart) beginning in 1990, and as Exhibit G demonstrates, international small caps tend to be more volatile than their large cap counterparts.
Therefore, investors should expect to have a more volatile ride in this asset class. With this higher level of risk and a questionable return premium from passive exposure to international small cap companies, we are proponents of active management in this space.
…Some Closing Thoughts
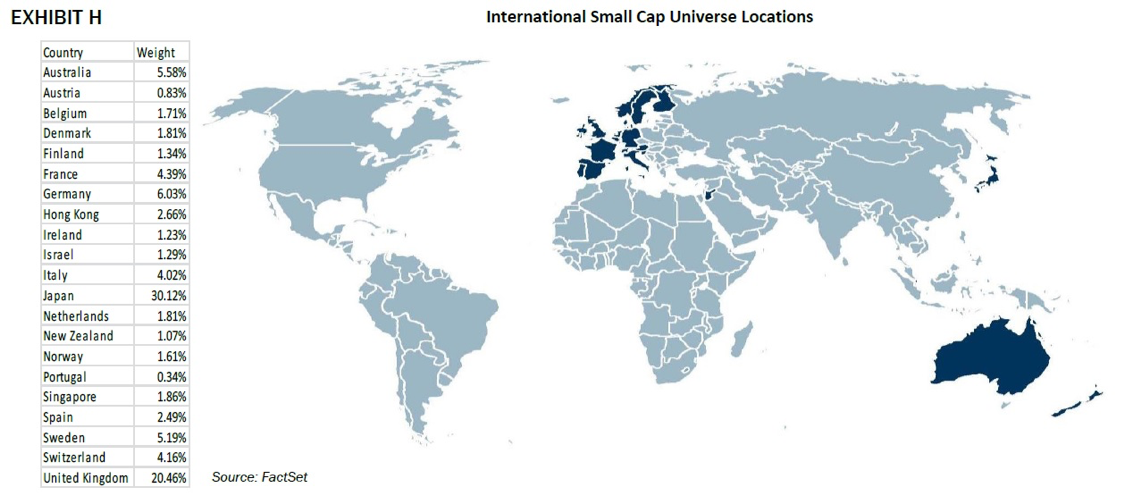
If the four reasons shown above help to answer the question why international small cap, the follow on question is likely to be how to invest in international small caps? We have made the argument that active management in this sector makes sense because of inefficiencies. But how to go about scouring over 3,000 companies located across hundreds of thousands of miles? The map in Exhibit H shows just how daunting this challenge is.
We believe that a proven quantitative methodology is the most appropriate way to manage an international small cap portfolio. LMCG utilizes a factor-based quantitative investment methodology to cull through thousands of securities – attempting to identify those companies with the highest likelihood of upside appreciation. Contrast this method with a stock picking fundamental research approach – an approach that is much more (human) resource intensive: Analysts traveling to see factories, meeting managements on site, interviewing suppliers and customers – all practices that are typically touted by fundamental managers – become virtually impossible without a huge investment in resources. Even with such an investment – the geographical area of research would likely be limited. Employing quantitative methods allows the opportunity set to be as broad as possible – and we believe the broader the opportunity set – the greater the potential value added.
Our quantitative models can quickly and efficiently cull through thousands of companies down to a more manageable group. However, we still build the portfolio one stock at a time.
Summary
In this paper, we have attempted to demonstrate why an allocation to international small cap equities makes sense in a US investor’s investment program. Hopefully, readers will agree that these reasons are compelling enough on a stand-alone basis.
On the demand side, will there be increased interest by institutional and individual investors in this asset class? That’s hard to say – but we would make a couple of observations that may fuel investors’ interest. First, the outlook for mainstream asset classes, especially fixed income, is challenging at best. Additionally, many market pundits have suggested that the next 5-10 years are going to be challenging for global (large cap) equities as economic growth estimates are uninspiring. This lack of a robust forecast for equities and fixed income, coupled with the “undiscovered” aspect of international small caps, could combine to create a solid tailwind for this asset class.
1 Evestment Alliance: Active Manager Returns, 2011-2015: 611 Small Cap Managers vs. 1,063 Large Cap Managers, as of 12/31/2015.
2 Evestment Alliance as of 12/31/2015: pulled on 3/18/2016.
3 Jeremy Siegel, Stocks for the Long Run, 2014.
© LMCG Investments
Read more commentaries by LMCG Investments