KEY TAKEAWAYS
- The structural and demographic problems that will drive the deficit higher over the next several decades remain in place, “but are receiving relatively little attention from policymakers and markets.”
- The longer policymakers wait to address them, the more difficult they become.
The U.S. presidential election is only ten weeks away, and one key topic has been largely absent on the campaign trail in this “unusual” election year: the deficit. While both Hillary Clinton and Donald Trump have floated plans to cut and/or reform taxes and make significant investment in the nation’s infrastructure (see our Weekly Economic Commentary from August 22, 2016, “Fiscal Policy — String Theory,” for more details), talk of the debt and deficit on the campaign trail has been overshadowed in this election, to put it kindly. We are hopeful that the three scheduled presidential debates, set for September 26, October 9, and October 19, 2016, may provide a forum for such a discussion, as they have in past election cycles. In this week’s commentary, we assess the current state of the deficit and debt as fiscal year (FY) 2016 draws to a close on September 30, 2016, and look ahead to the medium and long-term status of the deficit.
A LOOK BACK
According to a recent report by the nonpartisan Congressional Budget Office (CBO), the United States will likely run a $590 billion deficit in FY 2016, a $152 billion deterioration from the $438 billion deficit racked up in FY 2015. If the CBO is correct, FY 2016 would mark the first year since 2009 that the deficit has increased from the prior year. As a percent of nominal gross domestic product (GDP), the deficit in FY 2016 is expected to be 3.2%, up from 2.5% in FY 2015 [Figure 1], leaving the public debt-to-GDP ratio — a key metric for global financial markets to assess the creditworthiness of a country — at just under 77% [Figure 2].
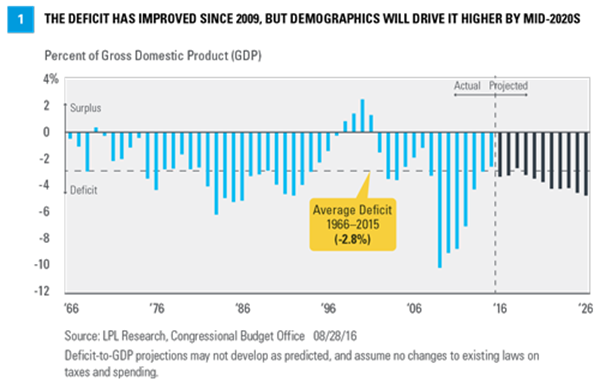
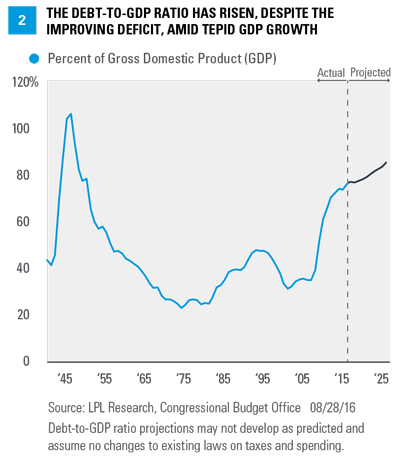
As recently as 2009, the federal deficit clocked in at $1.4 trillion, or nearly 10% of GDP; thus, the nation’s fiscal situation has improved dramatically in the past seven years, thanks to an improved economy and a combination of higher tax rates and limited spending increases driven by congressional actions like the sequester and the fiscal cliff. Some “one-time” items (e.g., the Troubled Asset Relief Program [TARP] and accounting related to Fannie Mae and Freddie Mac) also helped to reduce the deficit. But because the deficit — and the borrowing to finance the deficit — increased faster than the overall economy, the debt-to-GDP ratio deteriorated from around 52% in 2009 to just under 77% today.
A LOOK AHEAD
Looking ahead, the CBO expects (and we concur) that under current law, the deficit relative to GDP will shrink modestly over the next three fiscal years (2017, 2018, and 2019), leaving the debt-to-GDP ratio at about 77.5%, little changed from the FY 2016 reading of around 77%. But beginning in the early years of the 2020s, the CBO expects, absent any changes to existing tax and spending laws, that the deficit will begin to widen again. By 2024 the deficit is expected to hit $1 trillion, or 4% of GDP, pushing the all-important public debt-to-GDP ratio to nearly 83% of GDP [Figure 2]. By 2026, the last year forecast by CBO’s most recent Budget and Economic Outlook published earlier this month, the deficit will reach $1.2 trillion, 4.6% of GDP, pushing the debt-to-GDP ratio to nearly 86%.
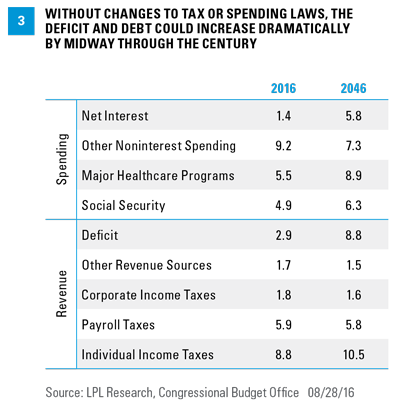
Beyond 2026, the situation deteriorates even further (again, absent changes to existing tax and spending laws). Once each year, the CBO publishes its long-term budget outlook. The most recent publication in July 2016 looked out through 2046. Again, assuming no changes to existing laws on taxes and spending, no recessions, and a very modest path for both short- and long-term interest rates, the CBO expects the deficit to reach 8.8% of GDP by 2046, driving the debt-to-GDP ratio to 141% of GDP. At that point, interest payments, which account for just 1.4% of GDP today, would reach 5.8%, and spending on the major entitlement programs (Social Security, Medicare, Medicaid, the Children’s Health Insurance Program), and the Affordable Care Act would represent over 15% of GDP, 50% higher than today [Figure 3]. The ballooning of these demographically related portions of the budget over the next few decades highlights the structural problems in the budget, despite the relatively benign backdrop today.
SHORT-TERM GAIN, LONG-TERM PAIN
As we wrote in our September 28, 2015 Weekly Economic Commentary, “Short-Term Gain, Long-Term Pain,” the good news is that the deficit, debt, and pace of federal spending are not on the market’s radar screen currently. The stable debt-to-GDP ratio over the remainder of the decade (as forecast by the CBO) also provides a window for Congress to address the underlying structural problems in the budget, which have been masked — and indeed overwhelmed — by the improving economy and the near-term spending constraints imposed by Congress on nondefense discretionary spending. Any action to address the underlying structural issues in the budget are unlikely until after the 2016 presidential and congressional elections, but recent history suggests that Congress may not act until a crisis is already underway. The biggest risk is that the recent improvement in the deficit (and relative stability in the debt-to-GDP ratio) allows complacency to set in among policymakers in Washington.
The structural and demographic problems that will drive the deficit over the next several decades remain in place, and the longer policymakers wait to address them, the more difficult they become — and the more painful the solution.
IMPORTANT DISCLOSURES
The opinions voiced in this material are for general information only and are not intended to provide or be construed as providing specific investment advice or recommendations for your clients. All performance referenced is historical and is no guarantee of future results.
Any economic forecasts set forth in the presentation may not develop as predicted and there can be no guarantee that strategies promoted will be successful.
Investing in stock includes numerous specific risks including: the fluctuation of dividend, loss of principal and potential illiquidity of the investment in a falling market.
Gross domestic product (GDP) is the monetary value of all the finished goods and services produced within a country’s borders in a specific time period, though GDP is usually calculated on an annual basis. It includes all of private and public consumption, government outlays, investments, and exports less imports that occur within a defined territory.
INDEX DESCRIPTIONS
The S&P 500 Index is a capitalization-weighted index of 500 stocks designed to measure performance of the broad domestic economy through changes in the aggregate market value of 500 stocks representing all major industries.


