Everyone knows that September is the cruelest month. But will the calendar rule the stock market in 2016? Spoiler alert… Probably not.
First some background. Since 1926, U.S. equities have been positive 60% of the time. The month of September, however, has been negative 60% of the time. When September is negative, the loss has averaged 4% with a standard deviation of 5%. It’s not uncommon, therefore, to witness a 5%-10% drawdown in September.
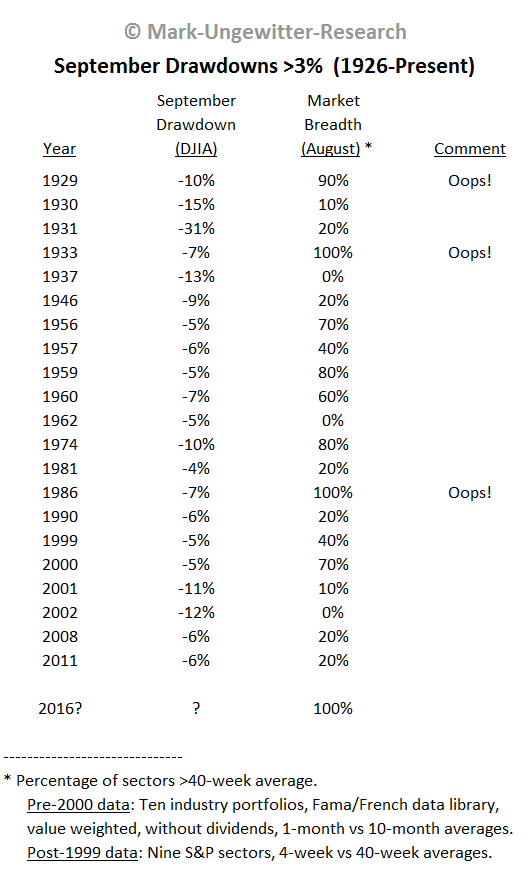
The Table below lists all Septembers with more than a 3% loss. The third column provides a measure of market breadth in the month ahead of the treacherous Septembers. When 100% of S&P sectors traded above their 40-week moving averages – as in August 2016 – only 3 out of 21 Septembers suffered big hits. Large September drawdowns, in other words, are normally foreshadowed by deteriorated market breadth.
What about the three exceptions? Is there any common thread? Yes, price was highly over-extended in each case. Though not shown below, year-to-date gains through August were 27% in 1929, 71% in 1933 and 23% in 1986. This year, the advance through August is only 6%, which is not an over-extended reading.
Bottom line? Context is important. There have been very few September crashes when the market is as healthy as it is today. And the exceptions occurred in highly over-extended markets, which is not the case in 2016.