The Genesis of Buy and Hold Theory
Over the past 35-40 years, the industry and media have told investors to invest passively, or to buy and hold. We believe this approach is flawed and hurting rather than helping people invest successfully. The passive, buy and hold concept was developed in response to the damage inflicted on investors and the mutual fund industry in the 1970s. The 1973-74 Bear Market caused many investors, who still had lingering memories of the Depression, to bail on their mutual fund and stock positions. Hard hit by massive liquidations, many mutual fund companies went bankrupt, and the survivors looked for new approaches to help keep investors invested through future bear market cycles.
Academics went back to the drawing board, and they developed the concept of buy and hold to help investors understand that they would likely sacrifice bull market returns if they tried to miss the bear market losses by moving to cash. Buy and hold theorists suggest that investors can’t successfully time the markets, and by trying to avoid the down days, investors will miss the few powerful up days that provide most of the return. They believe the positive returns generated during bull market uptrends will always be sufficient to allow investors to not only recover lost capital but to generate returns high enough to help them achieve their financial goals. But the devil is in the details, and as it turns out, investors who follow the “buy and hold” mantra also expose their capital to the markets biggest losing days, which have an even greater effect on return.
Best and Worst Quarters Analysis
The prevailing conventional investment wisdom suggests you would diminish performance dramatically by attempting to avoid losses, but our analysis in Chart 1 shows that if you can avoid the worst market declines you can also miss the best gains and still enhance return. Chart 1 shows that over the past 66 years $100,000 invested in the Dow Jones Industrial Average (DJIA) Index on a buy and hold basis would have grown to $8,706,856. However, by missing both the 10 best and worst quarters, the return would have improved to $12,159,898. Of course missing the 10 worst quarters while capturing the returns from the 10 best quarters would have produced the best result. We believe the important take away is preventing large losses is dramatically more important thanchasing returns.
Chart 1

|
The Human Equation - Why Investors Can Lose When They Try to Buy and Hold
We know today after three decades of experience that investors generally don’t buy and hold, and the assumptions they will are flawed. We believe individual investors are genetically predisposed to lose the buy and hold battle. When we invest, we all fight the “human factor”, our survival instincts and emotions. These instincts were honed hunting for food to survive. Today we don’t hunt for survival; instead, we work and invest our savings to provide the things we need when we can no longer work.
Money in today’s society is important to our basic survival, so when account values fall due to declining markets, our survival instincts kick-in triggering a fear response. Individuals’ risk tolerances vary, but fear will eventually trigger the need to “fight or flee”. It’s impossible to “fight the market” so the only remaining course of action is to flee, which often translates into selling low after money has already been lost. Not only do investors sell at or near market bottoms, but they also sit on the sidelines, missing the powerful relief rallies that would have helped them recover lost capital. Human greed causes investors to stay optimistic too long, believing that bull market trends won’t end, just as fear makes people stay overly pessimistic after losing capital, causing them to miss buying stocks when they are cheap.
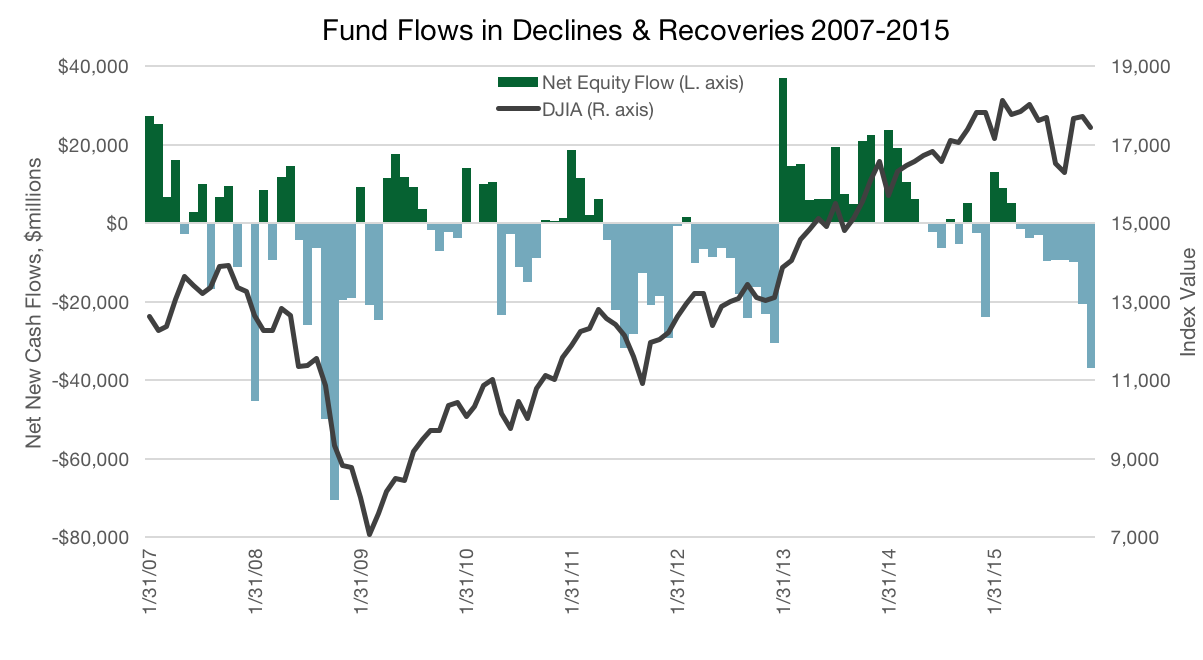
Investor behavior is illustrated in Chart 2, and the Investment Company Institute (ICI) mutual fund flow data over the past nine years indicates that investors do not stay invested, and they also fail to get back to fully invested quickly enough to catch the powerful market relief rallies that tend to occur within six months of the markets’ bottom. As the markets bottomed in March 9, 2009, the vast majority of investors had already moved to cash and were reluctant to believe that the risk of losing more capital had abated, so they continued selling. WBI believes a better investment approach to help investors be successful is to try to avoid big declines and big losses by actively managing the risk to capital.
Fund Flows Indicates Investors Didn’t Buy and Hold
Chart 2
|
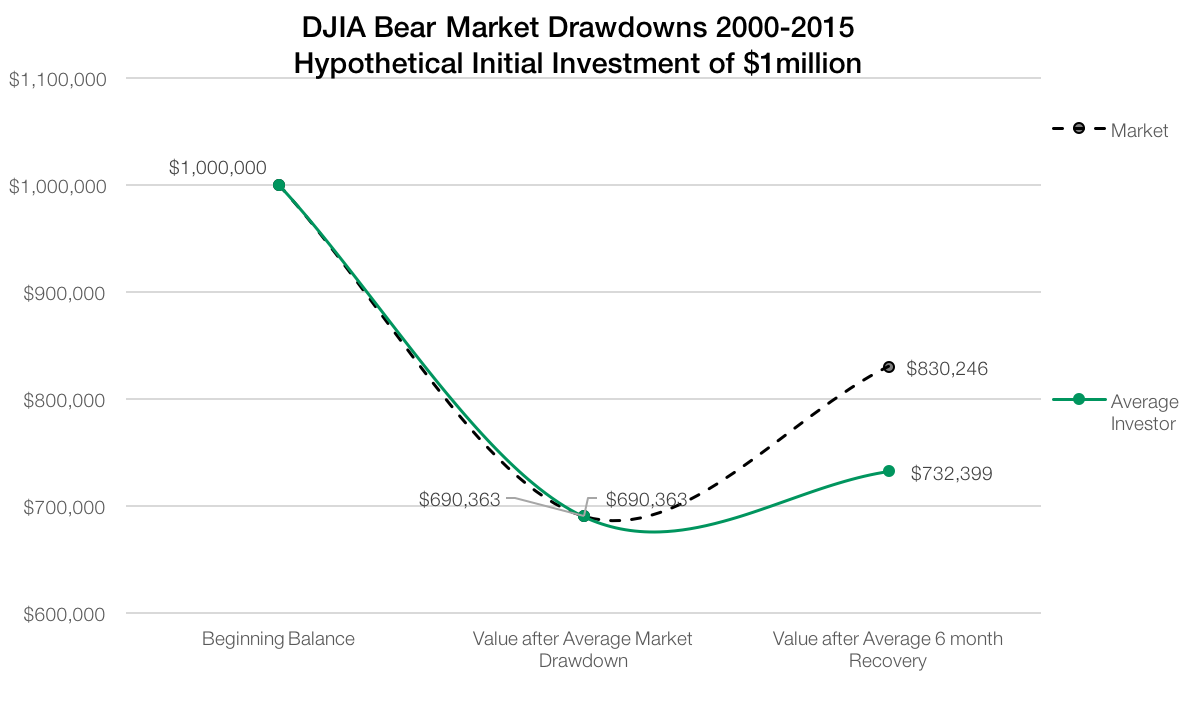
Chart 3 shows the effect of $1,000,000 hypothetically invested over the past 15 years, showing the results of bear market losses as indicated by the average of the three bear market drawdowns, followed by the average of the 6-month relief rally periods. It’s easy to see investors didn’t fare well relative to buy and hold. Bear markets can be brutal to investor capital. The average length of the bear trend was 16 months and the average depth was -30.96%. The average gain during the 6-month relief rally periods was 20.62%, but after taking into account investors’ selling trends highlighted in Chart 2, the average investor only enjoyed 6.09% return in relief rallies.
Investors Need to Find a Better Way to Invest
Chart 3
|
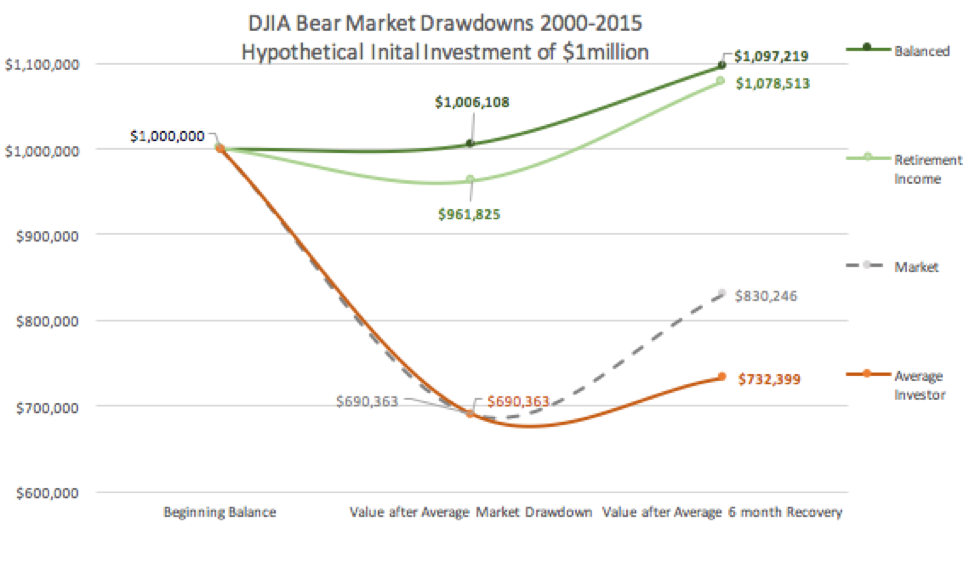
Chart 4
|
Bear markets are born when stocks become overvalued as fundamentals weaken and as bull market prices continue to rise. We believe increasing volatility is a key indicator that the end of the bull market is near. After stocks bottom, value reappears, and with cash to deploy WBI’s active, not passive, process attempts to buy low by getting reinvested in order to participate in the relief rallies that can be very powerful.
It’s time to stop the madness of believing that passive allocations with low-cost index products are the solution. We feel chasing index returns only looks like a good strategy during bull market runs. Unfortunately, this approach can also quickly turn into a disaster as investors’ capital is fully exposed to bear markets losses. It is a critical time for older investors that can’t afford looming bear market losses and the capital destruction that comes with it. We believe preserving capital is the most important factor in helping investors be more successful, and it has been WBI’s first priority since 1992.
|
Important Information
Past performance does not guarantee future results.
The views presented are that of Don Schreiber, Jr. and should not be construed as investment advice.
All economic and performance information is historical and not indicative of future results. This is not an offer to buy or sell any security. No security or strategy, including those referred to directly or indirectly in this document, is suitable for all accounts or profitable all of the time and there is always the possibility of loss. WBI Enhanced SMA® Program accounts are subject to investment risk, including the possible loss of principal amount invested. The ETFs used in WBI Enhanced SMA Program accounts may invest in other ETFs, mutual funds, and Exchange-Traded Notes (ETNs) which will subject the account to the additional expenses of each ETF, mutual fund, or ETN, as well as to the risk of owning the underlying securities held by each. Options on securities held in an ETF may be subject to greater fluctuations in value than an investment in the underlying securities. In addition, investment risks may include but are not limited to: market, economic, political, interest rate, currency exchange, leverage, liquidity, credit quality, model, portfolio turnover, trading and client specific restrictions. Moreover, you should not assume that any discussion or information provided here serves as the receipt of, or as a substitute for, personalized investment advice from WBI or from any other investment professional. To the extent that you have any questions regarding the applicability of any specific issue discussed to your individual situation, please consult with WBI or the professional advisor of your choosing. This information is compiled from sources believed to be reliable, accuracy cannot be guaranteed. Information pertaining to WBI’s advisory operations, services, and fees is set forth in WBI’s disclosure statement in Part 2A of Form ADV, a copy of which is available upon request.
WBI has an inherent conflict of interest in investing in or recommending affiliated ETFs to clients for the following reasons: 1) WBI and its affiliates receive management fees from affiliated ETFs. To avoid receiving two layers of management fees in those situations where clients invest in affiliated ETFs through SMA and Platform accounts, WBI will either: (i) waive the management fee charged at the account level; or (ii) credit the portion of the management fees paid by the affiliated ETFs to WBI and its affiliates with respect to an account’s investments in affiliated ETFs against the account-level advisory fees the particular SMA or Platform account owes WBI, and 2) WBI’s affiliated broker-dealer, Millington Securities, Inc., receives commissions and other compensation (including payment for order flow) for transactions effected on behalf of the affiliated ETFs. Any trades that WBI places through Millington will be subject to WBI’s duty of best execution and applicable law.
The Dow Jones Industrial Average Index (DJIA) is comprised of 30 large, publicly owned, U.S. based companies.
1Average Investor: The “Average Investor” return (also known as dollar-weighted return) measures how the average investor fared in a strategy over a period of time. “Average Investor” return incorporates the impact of cash inflows and outflows from purchases and sales as well as the growth in strategy assets. A strategy’s published “Total Return” (whether the strategy involves indexed products or actively-managed products) reflects a buy and hold strategy. But, not all investors buy and hold. Investors move their money in and out of strategies as they search for the best return. In contrast to total returns, “Average Investor” returns account for all cash flows into and out of the strategy to measure how the average investor performed over time. “Average Investor” return is calculated in a similar manner as internal rate of return. “Average Investor” return measures the compound growth rate in the value of all dollars invested in the strategy over the evaluation period. “Average Investor” return is the growth rate that will link the beginning total net assets plus all intermediate cash flows to the ending total net assets. Cash flow information for the “Average Investor” return calculations is obtained from the Investment Company Institute.
WBI’s Tactical Balanced and Retirement Income Strategies are two of five separately managed account strategies currently offered by WBI. Other strategies may have different results.
ICI makes no express or implied warranties or representations and shall have no liability whatsoever with respect to any ICI data contained herein. This report is not approved, endorsed, reviewed, or produced by ICI.


