International Economic Week in Review: China Sneezed and We All Caught A Cold, Edition
What’s behind the Chinese sell-off? It’s partly due to an expensive market. But equity markets are leading economic indicators, meaning a connection exists between the overall Chinese slowdown and its equity market. Last year, the OCED’s general economic assessment of the world economic environment offered the following explanation for Chinas slower growth:
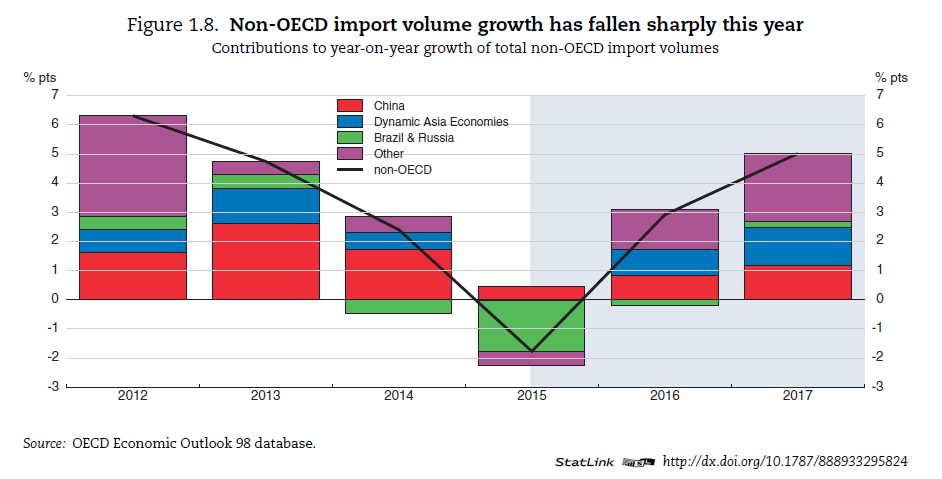
A key uncertainty stems from the unexpectedly sharp slowdown in world trade growth this year, to an estimated 2%. Over the past five decades there have been only five other years in which global trade growth has been 2% or less, all of which coincided with a marked downturn of global growth (Figure 1.7). In part, the current trade slowdown reflects weaker global GDP growth. But the slowdown has been more pronounced than might have been expected on the basis of past relationships with global output growth, even given the post-crisis decline in the elasticity of trade to output. In the early stages of the recovery, moderate trade growth largely reflected weak demand in the advanced economies, especially in the trade-intensive euro area (Ollivaud and Schwellnus, 2015). More recently, the weakness stems from the EMEs. A substantial proportion of the overall slowdown in global trade growth this year relative to 2014 is accounted for by a decline in import volumes in the non-OECD economies (Figure 1.2), reflecting both weaker demand growth and a reduction in import intensity. This has contributed to weaker external demand in the advanced economies. All told, the slowdown in non-OECD import demand this year and next, relative to earlier projections (OECD, 2015a), is likely to reduce OECD GDP growth by 0.4 percentage point per annum, all else equal.
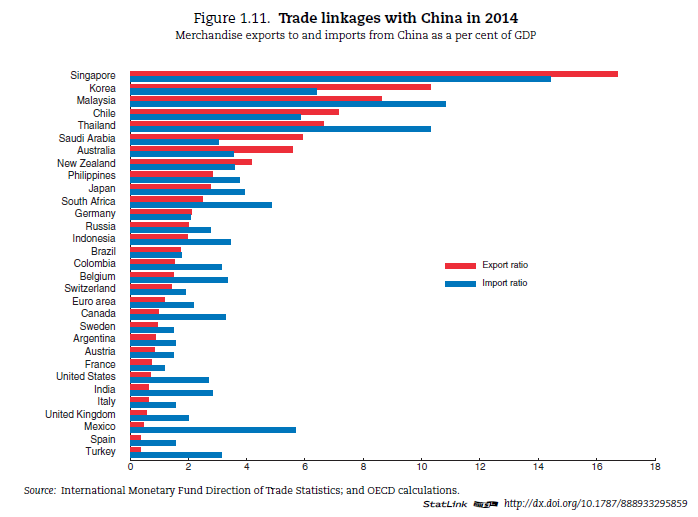
The report next notes that in 2015 Brazilian and Russian imports decreased by 10% and 20%, respectively. Chinese imports account for about 1/3 of the drop. And the Chinese decrease in imports has negatively impacted two regions: Asian trading counter parties and southern hemisphere countries such as South Africa and New Zealand. The following graphs show the drop in overall exports and the net impact on specific countries:
The Bank of England kept rates at .5%. Their press release contained the following two paragraphs:
The outlook for inflation in the medium term reflects the balance between the persistence of the dampening influence of factors such as the past appreciation of sterling and subdued world export prices, and prospective further increases in domestic cost growth. The MPC’s objective is to return inflation to the target sustainably, without an overshoot once those persistent disinflationary forces have waned. Given that, the MPC intends to set monetary policy to ensure that growth is sufficient to absorb remaining spare capacity in a manner that returns inflation to the target in around two years and keeps it there in the absence of further shocks.
.....
Domestically, the most recent data suggest that, after faster growth over the previous two years, output growth was steady during 2015 at rates a little below pre-crisis norms. Although indicators of private domestic spending appear healthy, business surveys imply that the near-term outlook for aggregate activity is slightly weaker than in the MPC’s November central projection. Productivity growth appears to have recovered somewhat over 2015, but the underlying supply capacity of the economy, and therefore the degree of inflationary pressure resulting from a given pace of demand growth, remain difficult to judge. Despite continued reductions in the rate of unemployment, pay growth remains restrained and appears to have dipped slightly in the most recent data. Overall, while domestic cost growth over the past year has been below that necessary for inflation to return sustainably to the 2% target, its pace can be expected to increase over time.
The first paragraph presents a nuanced view of inflation, arguing the headline CPI number is the result of a strong currency, weaker emerging economies and domestic price pressures. The bank concludes they intend for their policy to return inflation to the 2% level within two years. Yet in the second paragraph, the bank acknowledges domestic supply is difficult to gauge, adding a fair amount of wiggle room to the first paragraph’s policy proscription. This leads to two conclusions. First, a central bank is no longer arguing that oil prices are the sole reason for low prices, as has been the norm throughout the major central banks for the last year. Instead, there are a variety of factors creating this situation. Second, and perhaps most importantly, the BOE acknowledges their analysis could be wrong. The only other release was the production number, which showed a .7% M/M decline in production and .4% M/M drop in manufacturing.
The ECB released their latest meeting minutes, which contained the following analysis of the EU economy:
Turning to the euro area, real GDP had increased, quarter on quarter, by 0.3% in the third quarter of 2015. While no breakdown was available as yet, existing information pointed to a continued positive contribution from domestic demand, with private consumption growth as the main driver. Industrial production (excluding construction) had declined further in September, by 0.3% month on month. ….. Looking ahead, private consumption should remain the key driver of the economic recovery, on the back of higher disposable income growth, while investment growth should also gain momentum, in line with available survey-based information.
Labour market conditions had continued to improve gradually. Employment had risen by 0.3%, quarter on quarter, in the second quarter of 2015. The unemployment rate had declined further to 10.7% in October, around 1½ percentage points below its 12.1% peak in May 2013.
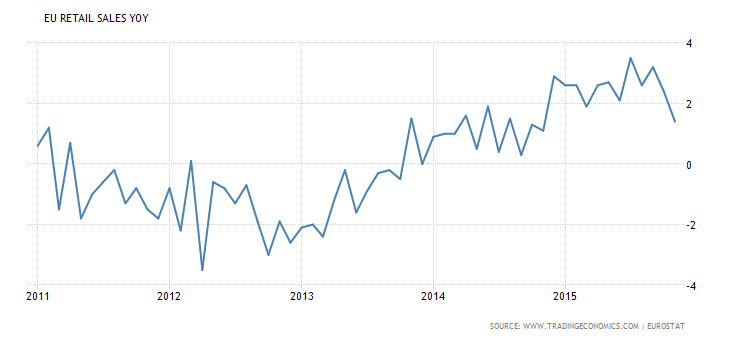
The following chart of retail shows they grew at a solid pace for most of the year. They did dip to a 1.4% Y/Y in their latest reading. But as of now, that could simply be statistical noise:
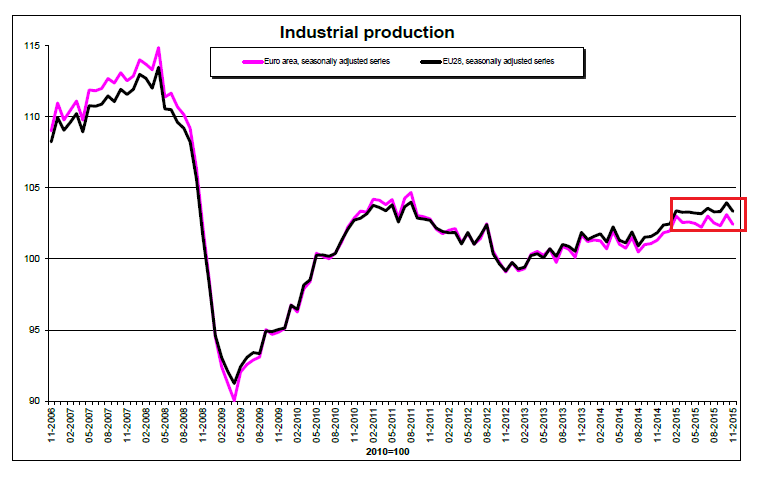
Industrial production is a slightly different story. While the Y/Y rate is higher, overall IP has moved sideways for the last year:
And while the following chart of DPI and spending is slightly dated, it does show the basis for the ECBs statement about DPI:
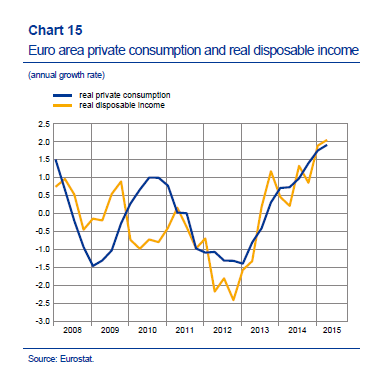
Overall, the EU region appears to be in fairly good shape.
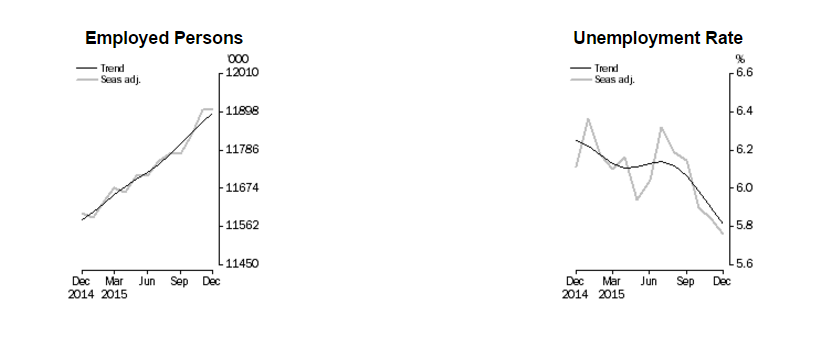
The only information from Australia was the employment report, which showed a .1% decrease in the unemployment rate to 5.8%. The participation rate increased slightly while the employment/population ratio rose a full .1%. Here are the relevant charts from the release:
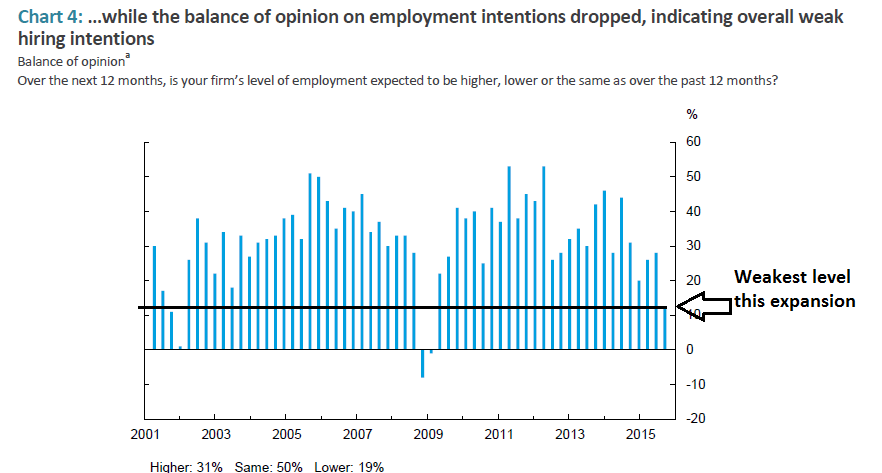
The Bank of Canada released their business outlook survey this week. The contents showed a weak business environment. Hiring was at the lowest level since 2009 and investment plans were at the lowest level since the recession. The following charts provide the context:
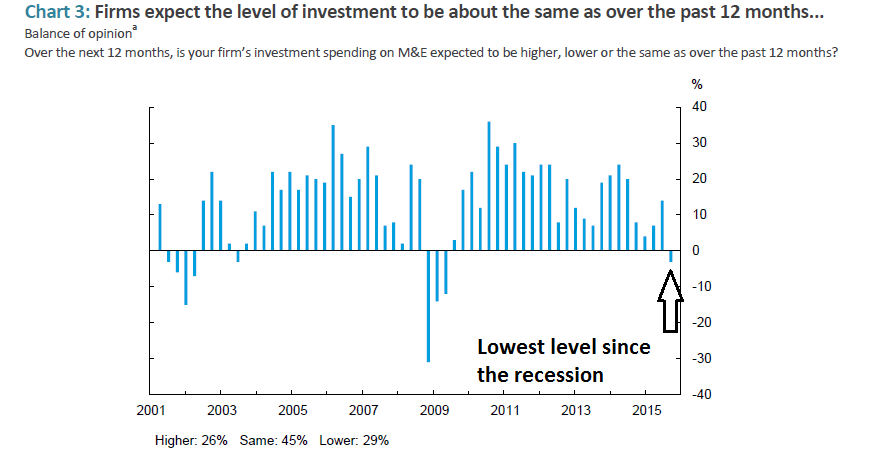
Additionally, industry has a large amount of spare capacity. And while the problems started in the energy sector, the negative impact is widening. The report was very negative. Housing starts dropped 49,000 to 173,000. However, this data series is very volatile. And because the report was for December, it’s highly likely weather related issues held the number down.


