Summary
The year-old sideways movement in U.S. equities is either a consolidation or a top. Narrow breadth is signaling caution.
The multi-decade bull market in U.S. bonds remains intact, but watch for signs of long-term reversal.
Gold must stage a very impressive rally to establish a positive long-term outlook.
Oil’s 18-month rout seems nearly exhausted. A 70% crash is not unusual… just a case of “oil being oil.”.
Extreme divergences between U.S. and non-U.S. equities are a stand-out feature in today’s market landscape.
In the spirit of year-end prognostication, here's my annual review of long-term trends and behavioral tendencies that are likely to influence key markets in 2016.
U.S. Equities
- U.S. equities entered a secular bull market in 2013, breaking out above a 13-year range in dollar terms and staging a bona-fide reversal in gold terms.
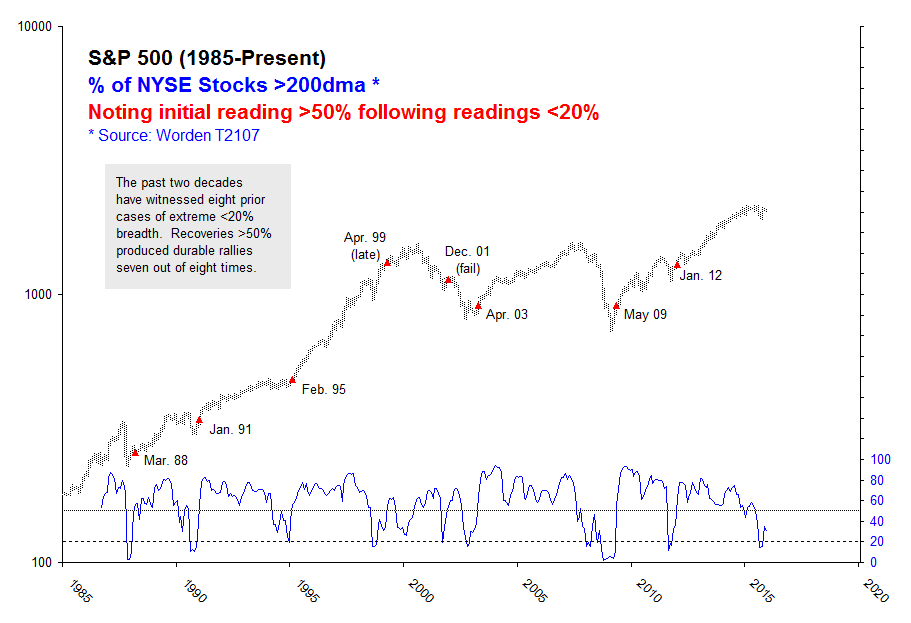
- The bull market, however, is stretched in price, time and valuation… and breadth narrowed conspicuously in 2015, raising a cautionary flag for the year ahead.
- The sideways action since December 2014 is either a consolidation or a top. While the presumption of trend is continuation, investors should be asking: "What would falsify this premise?"
Figure 1. S&P 500 and Dow/Gold ratio
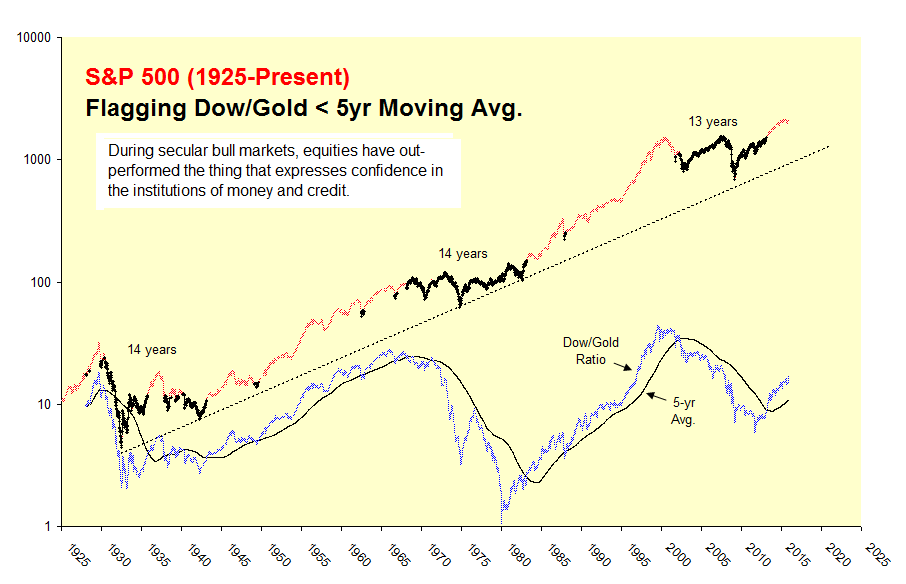
Figure 2. The market is stretched in price and time
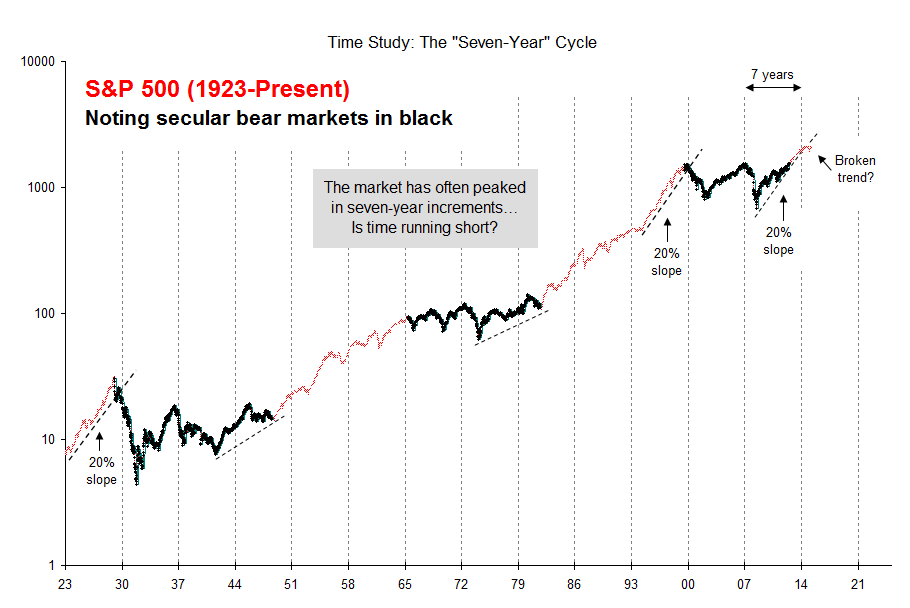
Figure 3. Valuation is also stretched… but within the range of modern experience
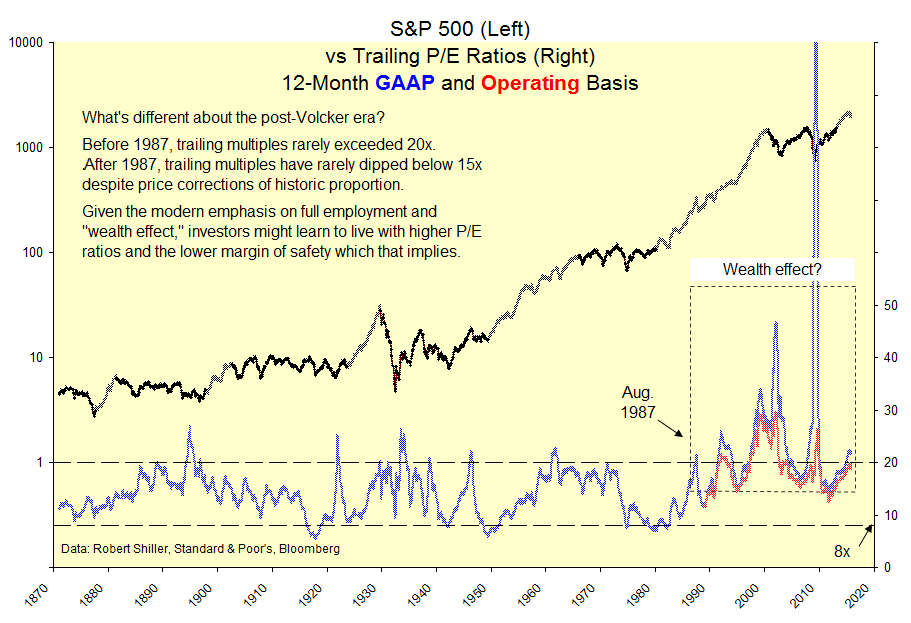
Figure 4. Will collapsing commodity prices clobber U.S. earnings?
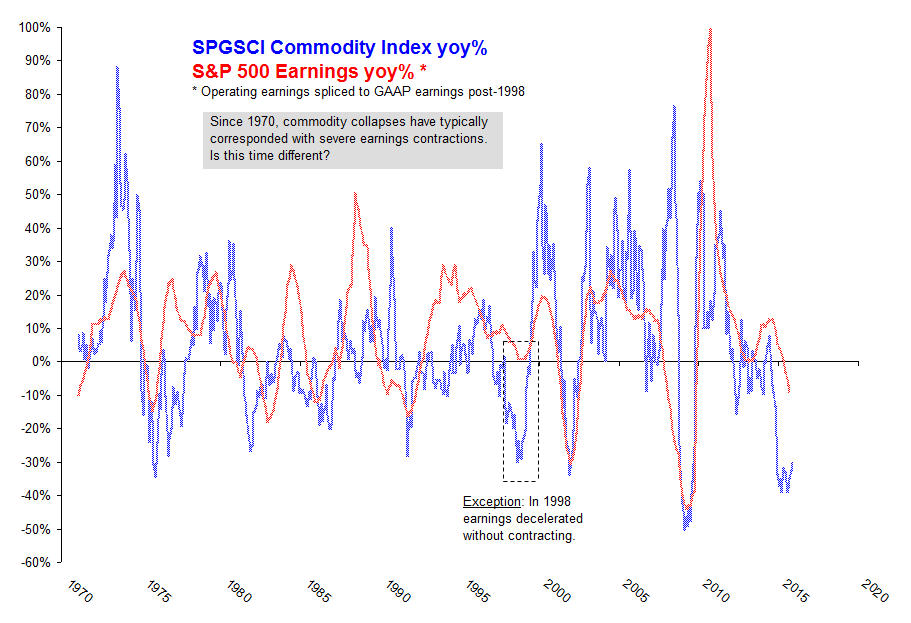
Figure 5. Breadth narrowed conspicuously in 2015
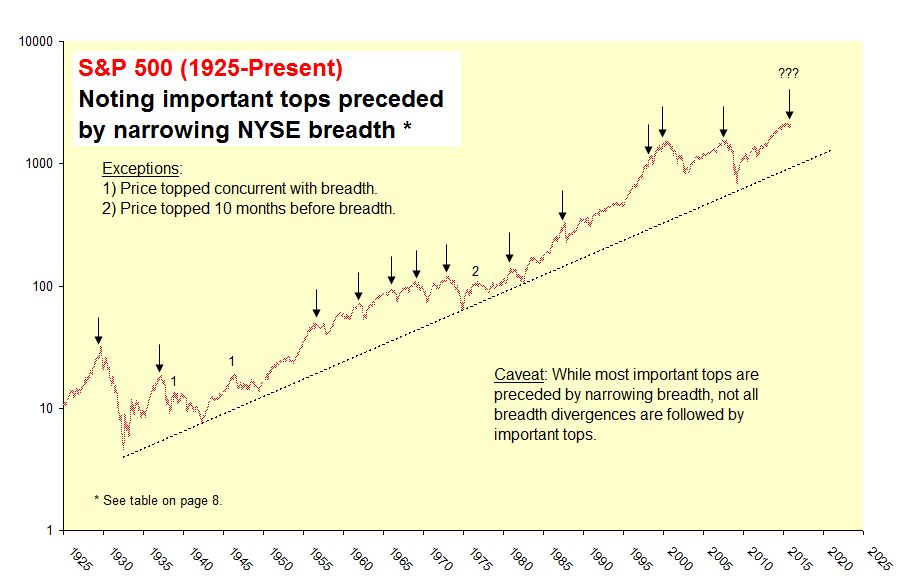
Figure 6. Important tops are normally preceded by narrowing breadth
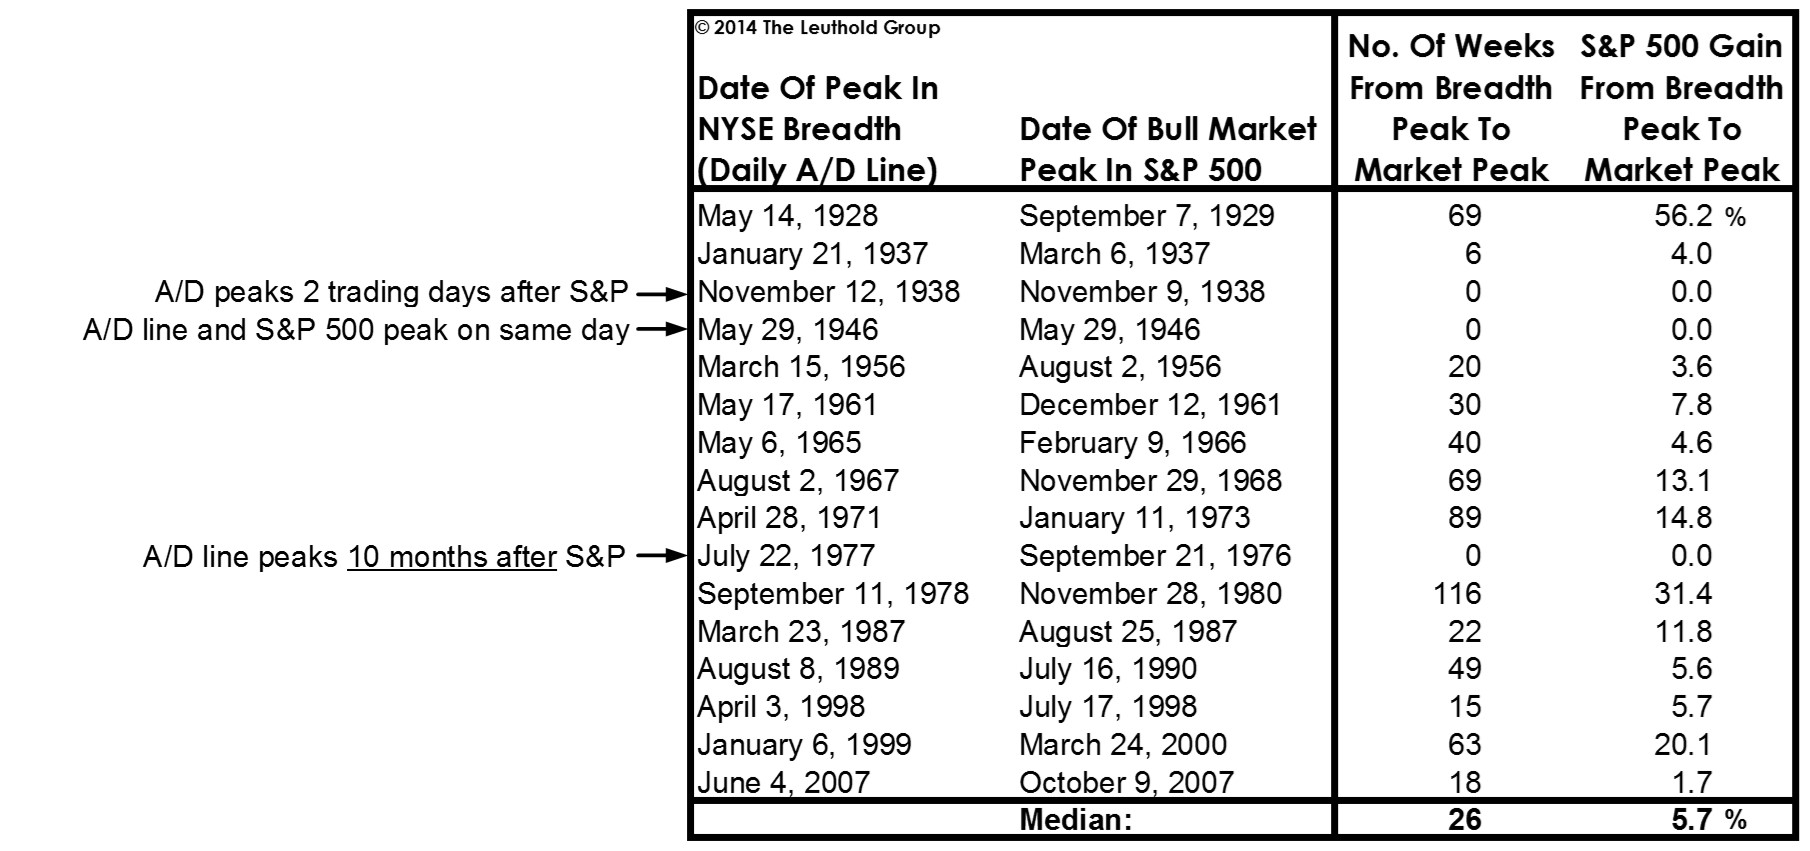
Figure 7. The S&P 500 peaked in July 2015, twelve weeks after a well-defined top in NYSE breadth
U.S. Equities: "A line in the sand"
- Divergent breadth has raised a cautionary flag.
- The sideways price action since December 2014 is either a consolidation or a top.
- While the presumption of trend is continuation, investors should be asking: "What would falsify this premise?"
- A break below SPX 1820 (a level first tested in October 2014), would cement the bear case.
- Early warnings might include a critical loss of momentum or a breakdown in financial stocks relative to the broad market.
Figure 8. Line in the sand? The "Coppock curve" has signaled most disasters of the past century
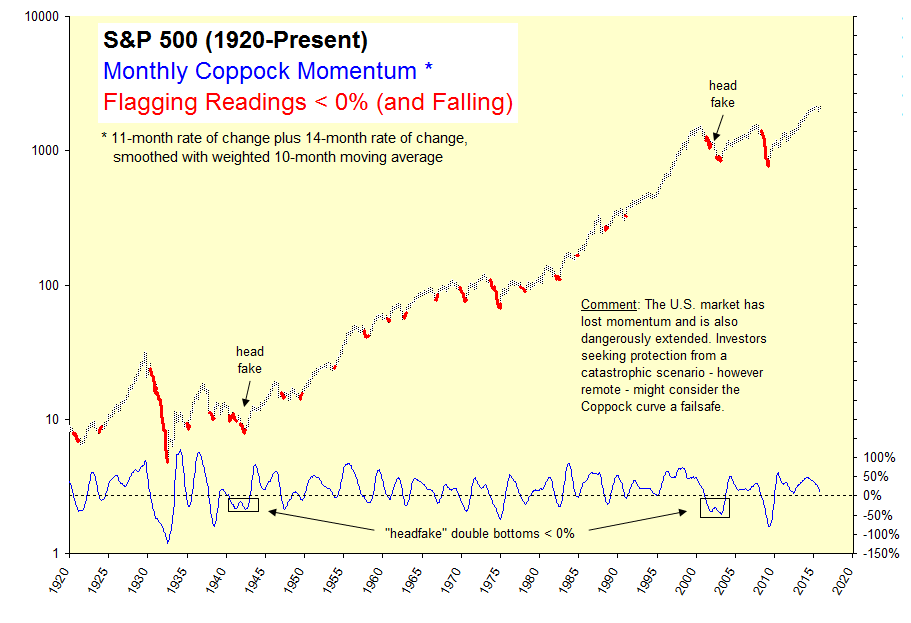
Figure 9. The financial sector often provides early warning
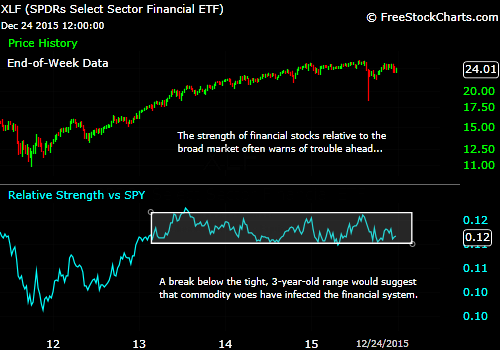
Figure 10. And what might corroborate the bull-market thesis?
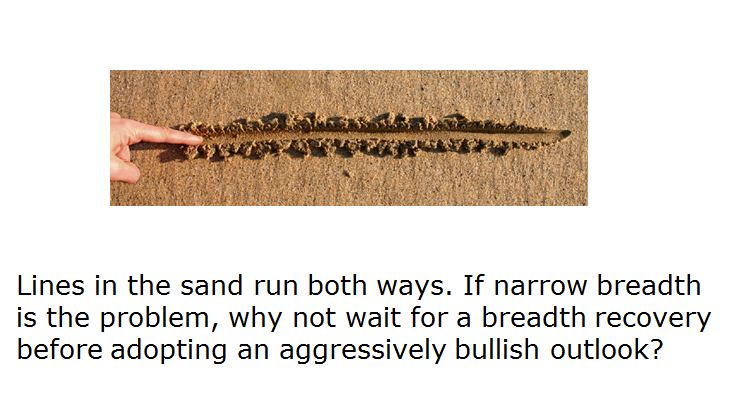
Figure 11. Breadth recoveries signal durable rallies
U.S. Bonds
- The multi-decade bull market in long-term government bonds remains intact, with no definitive "change of character" to signal a major trend reversal.
- 30's may have reached a secular trough near 2.5% yield, a level which has been tested repeatedly since December 2008. A move above 4.0% would support this view.
- 10's have been contained by an apparent "repression channel" since mid-2008. A move above 3.1% might provide an early sign of long-term reversal.
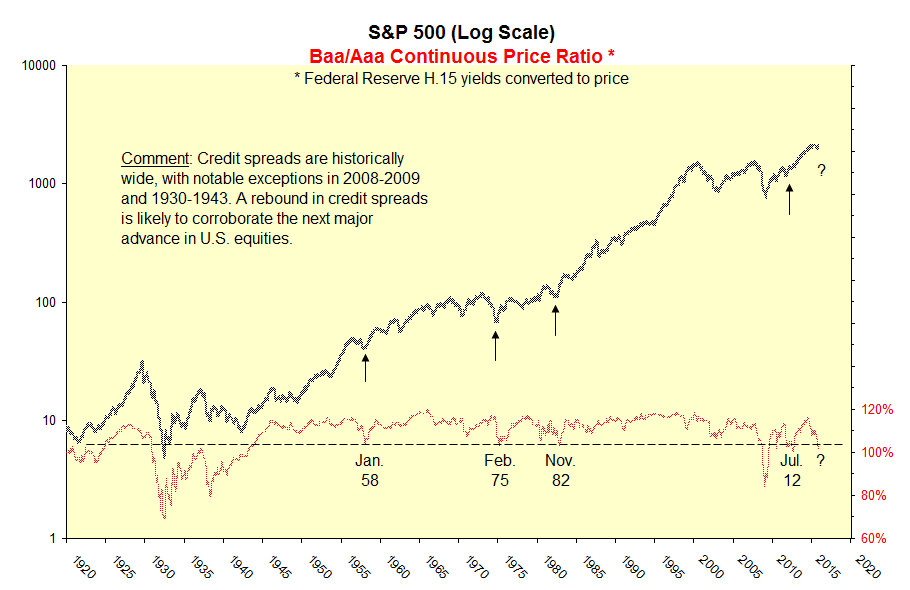
- Credit spreads are historically wide, but could gap wider. Reversals from historically wide readings have corroborated stock-market bottoms.
Figure 12. Are 30's building a base?
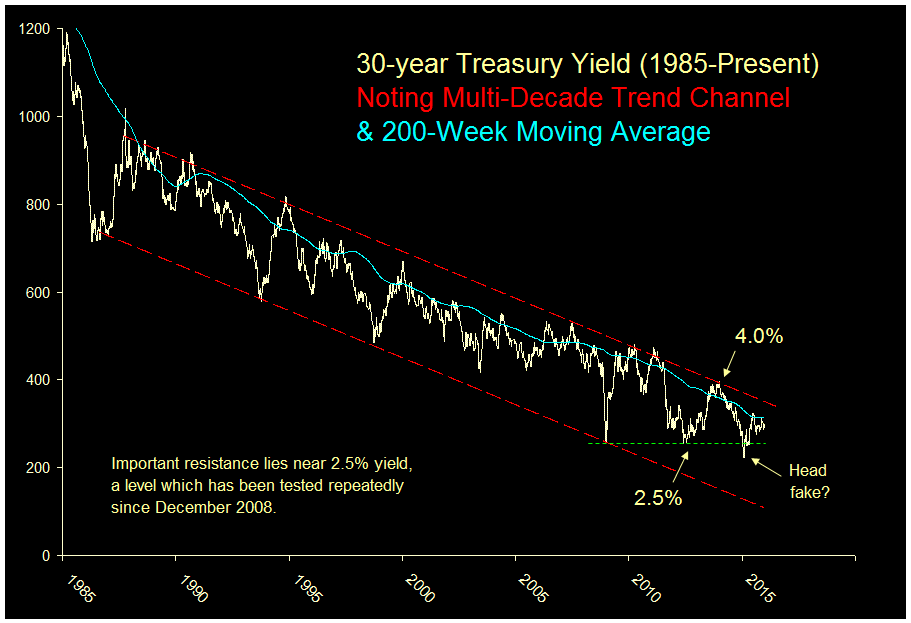
Figure 13. Are 10's the "canary in the cave"?
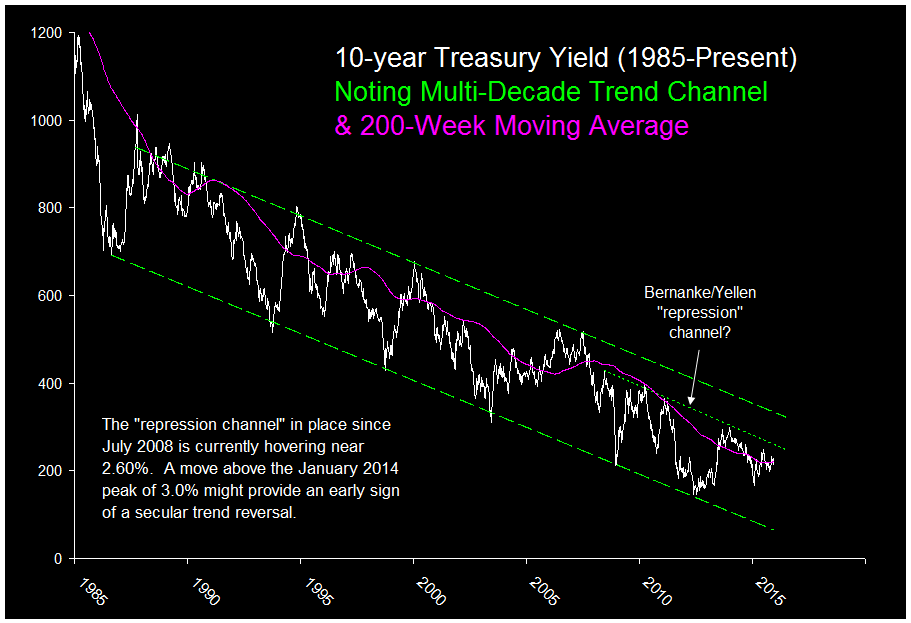
Figure 14. Inter-market study: S&P 500 versus credit spreads
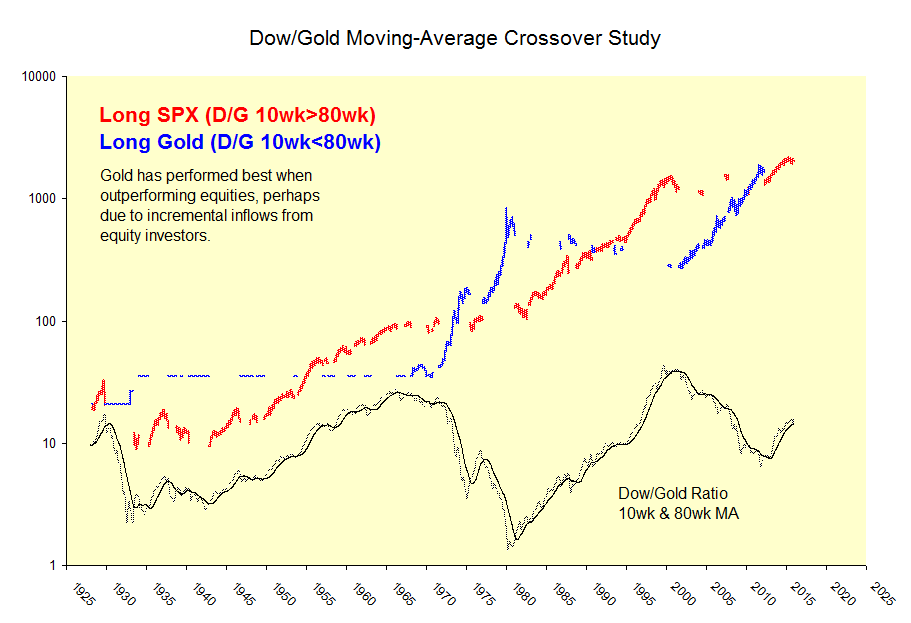
Gold
- After a bruising four-year decline, gold is near long-term support of about $1000/oz.
- While one might expect a counter-trend rally from this vicinity, gold is far from triggering a major buy signal.
- There should be plenty of opportunity to own gold after a bull market is confirmed. It's okay to be late to the party.
- Dusting off our long-term charts, three indicators are likely to confirm the next major advance: 1) positive monthly momentum; 2) 12-month highs in all three currencies; and 3) relative strength versus equities.
Figure 15. The long-term trend remains bearish for now
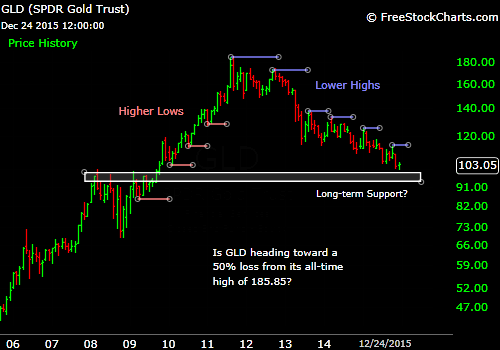
Figure 16. Buy gold when Coppock momentum exceeds zero
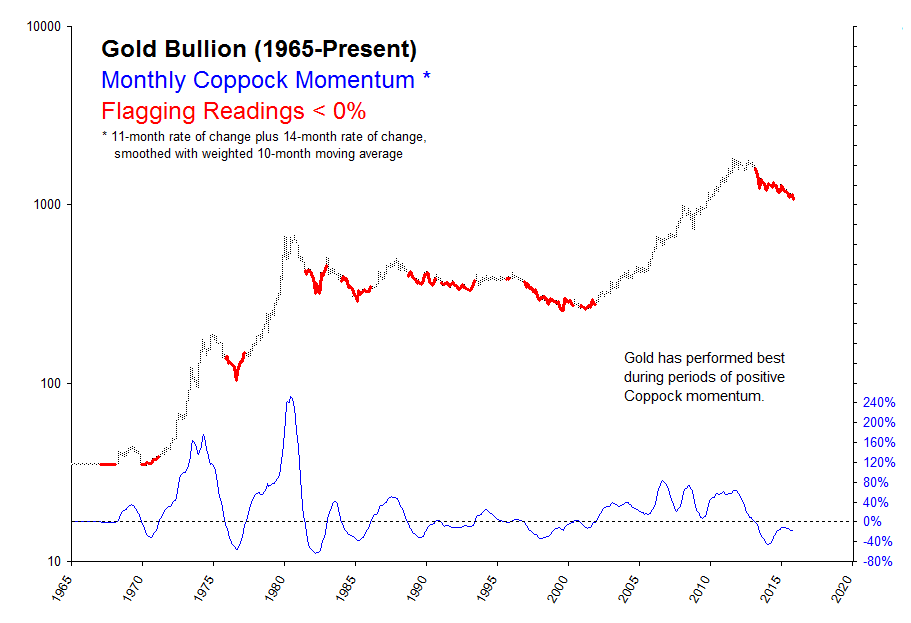
Figure 17. Buy gold after multiple observations of 12-month highs in all major currencies
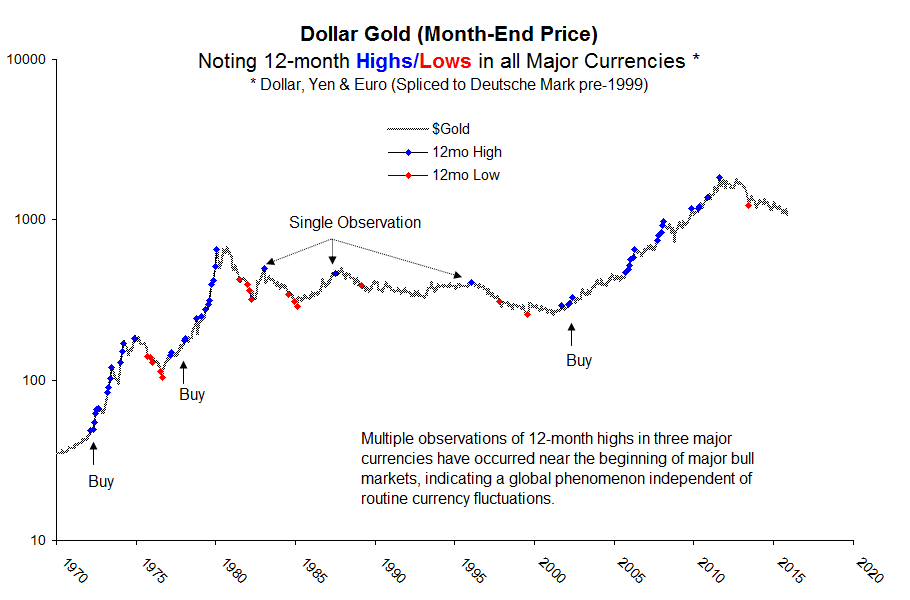
Figure 18. Buy gold when equities are under-performing gold
Crude Oil
- Oil has plummeted for 18 months, almost non-stop, as frantic pumping by debt-laden producers has contributed to a world-wide glut.
- "The final lows in declines like the ones in oil and the energy sector are usually created by some sort of forced selling." -Walter Deemer, 12/12/14
- The rout seems nearly exhausted, with price testing the 2009 bottom near $33 as well as two important tops from the 1980's and 1990's.
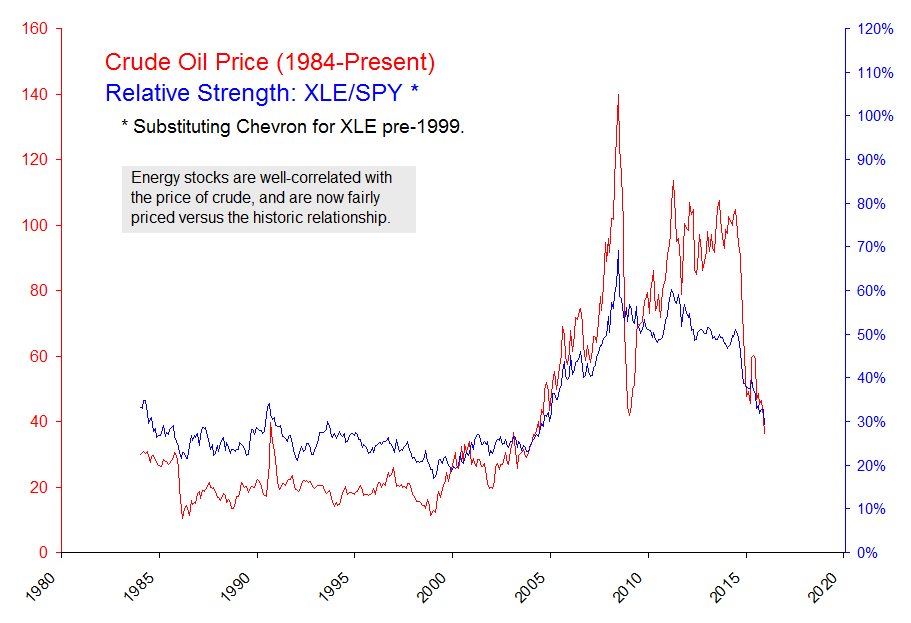
- Energy stocks are well-correlated with the price of crude, and are now fairly priced versus the historic relationship.
Figure 19. The oil rout seems nearly exhausted
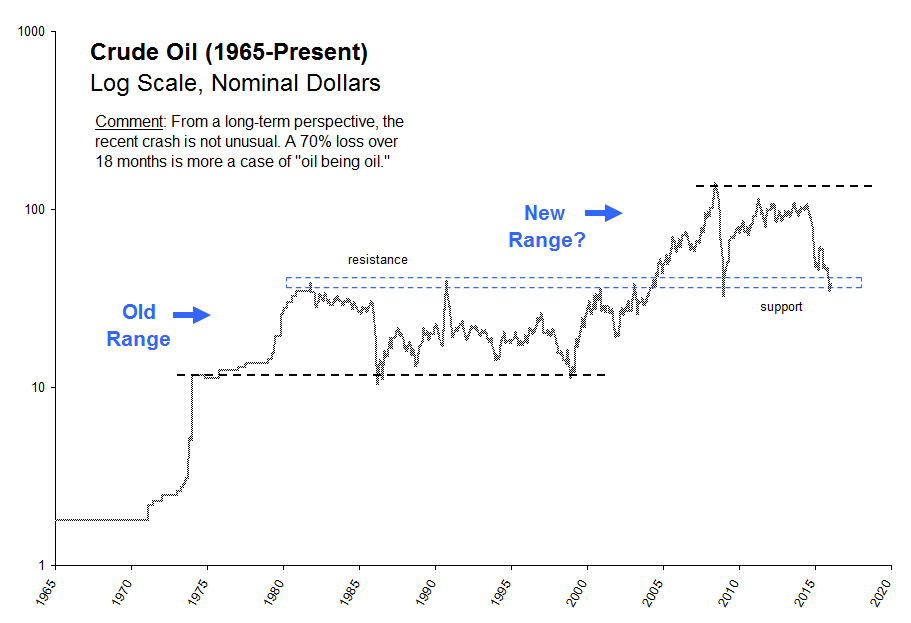
Figure 20. Energy stocks versus crude oil
Focus: Global Equities
- One of today's most glaring inter-market divergences is the relative performance of U.S. versus non-U.S. equities.
- For dollar-based investors, non-U.S. stocks have underperformed U.S. stocks by a whopping 50% over the past five years.
- Non-U.S. markets have traded sideways for five years in what is either a giant topping process or a giant base-building process. The eventual resolution of this pattern is likely to set the long-term trend.
- Technical conditions continue to favor the U.S., but extreme valuation divergences suggest the possibility of a sea change.
Figure 21. In contrast with US equities, the rest of the world is trading sideways
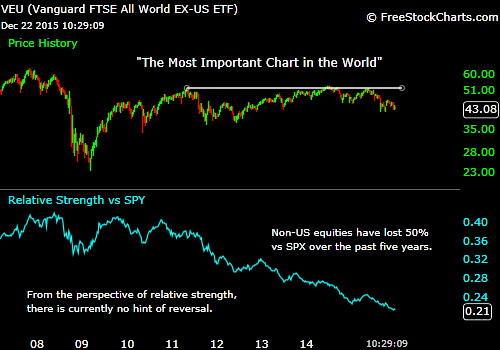
Figure 22. Europe, developed-Pacific, and emerging-market indices are all trading sideways
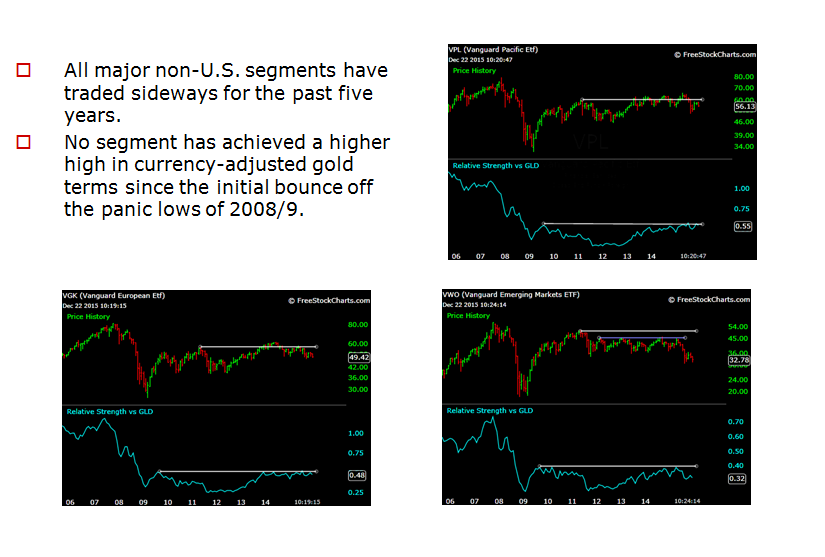
Figure 23. Valuation divergences are extreme… suggesting the possibility of a sea change
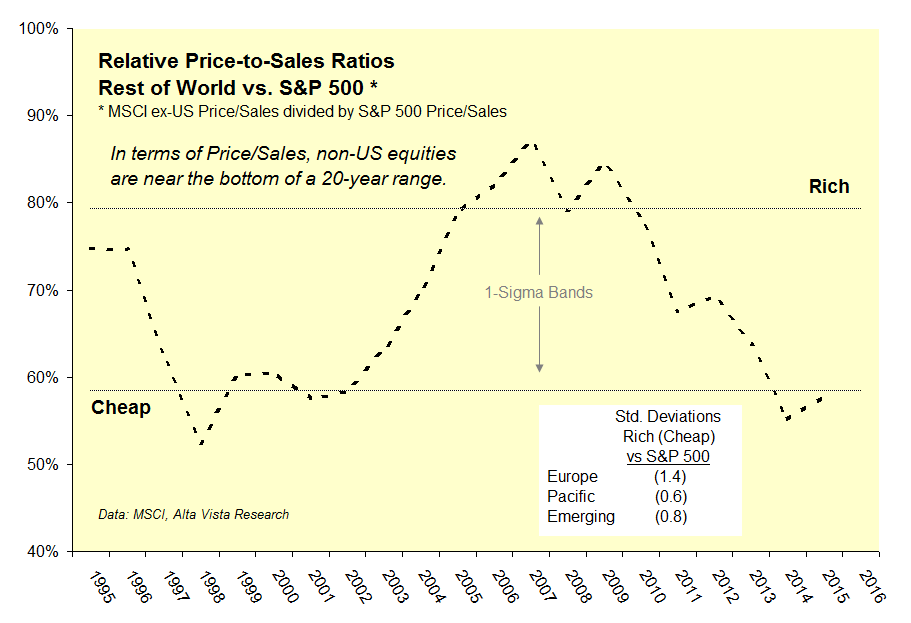
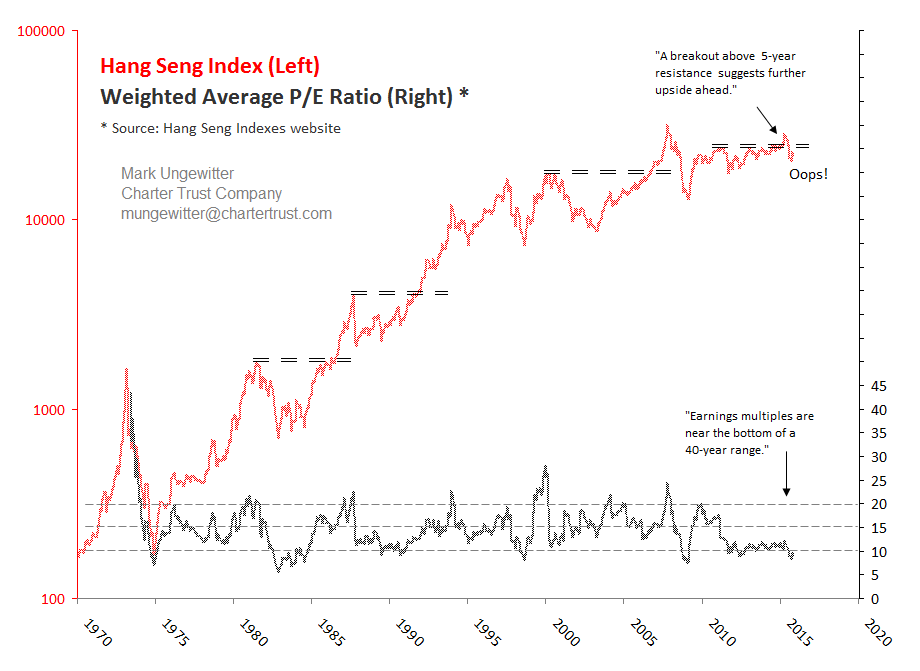
Figure 24. Blooper of the year… China "breakout" becomes fake out
Wrap...
- The year-old sideways in U.S. equities is either a consolidation or a top. Narrow breadth is signaling caution.
- The multi-decade bull market in U.S. bonds remains intact, but watch for signs of long-term reversal.
- Gold must stage a very impressive rally to establish a positive long-term outlook.
- Oil's 18-month rout seems nearly exhausted. A 70% crash is not unusual… just a case of "oil being oil."
- Extreme divergences between U.S. and non-U.S. equities are a stand-out feature in today's market landscape.
© Charter Trust Company


