US Bond Market Week in Review: A Look at the Coincident, Leading and Long Leading Indicators
The Fed wouldn’t have raised rates if they didn’t have confidence that the US economy would be able to handle higher rates. So, let’s take a look at coincident, leading and long leading data to get an idea for the strength of the US economy now, but, more importantly, in the next 12-18 months.
Let’s start with the coincident indicators:
First of all, a big hat tip to Doug Short for the graph. Two are in great shape: establishment jobs and income. So long as the economy continues to create jobs at the 200,000-250,000 rate, we should be in solid shape. However, there are two weaker numbers: real sales are down in 6 of the last 12 months, and industrial production declined in 9 of the last 12 months. That leads nicely to this table from the Conference Board of leading indicators:
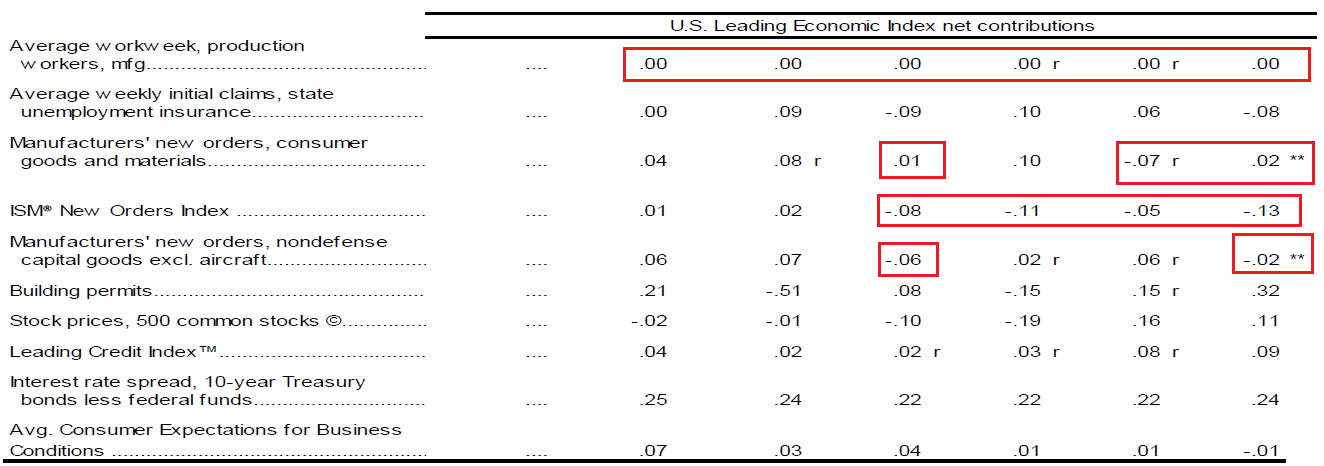
The average workweek of production workers has added 0 to the LEIs for the last six months. And various types of new orders of industrial goods have been weak for the last 3-4 months. The following tables from the St. Louis FRED system put the industrial weakness in sharper relief:
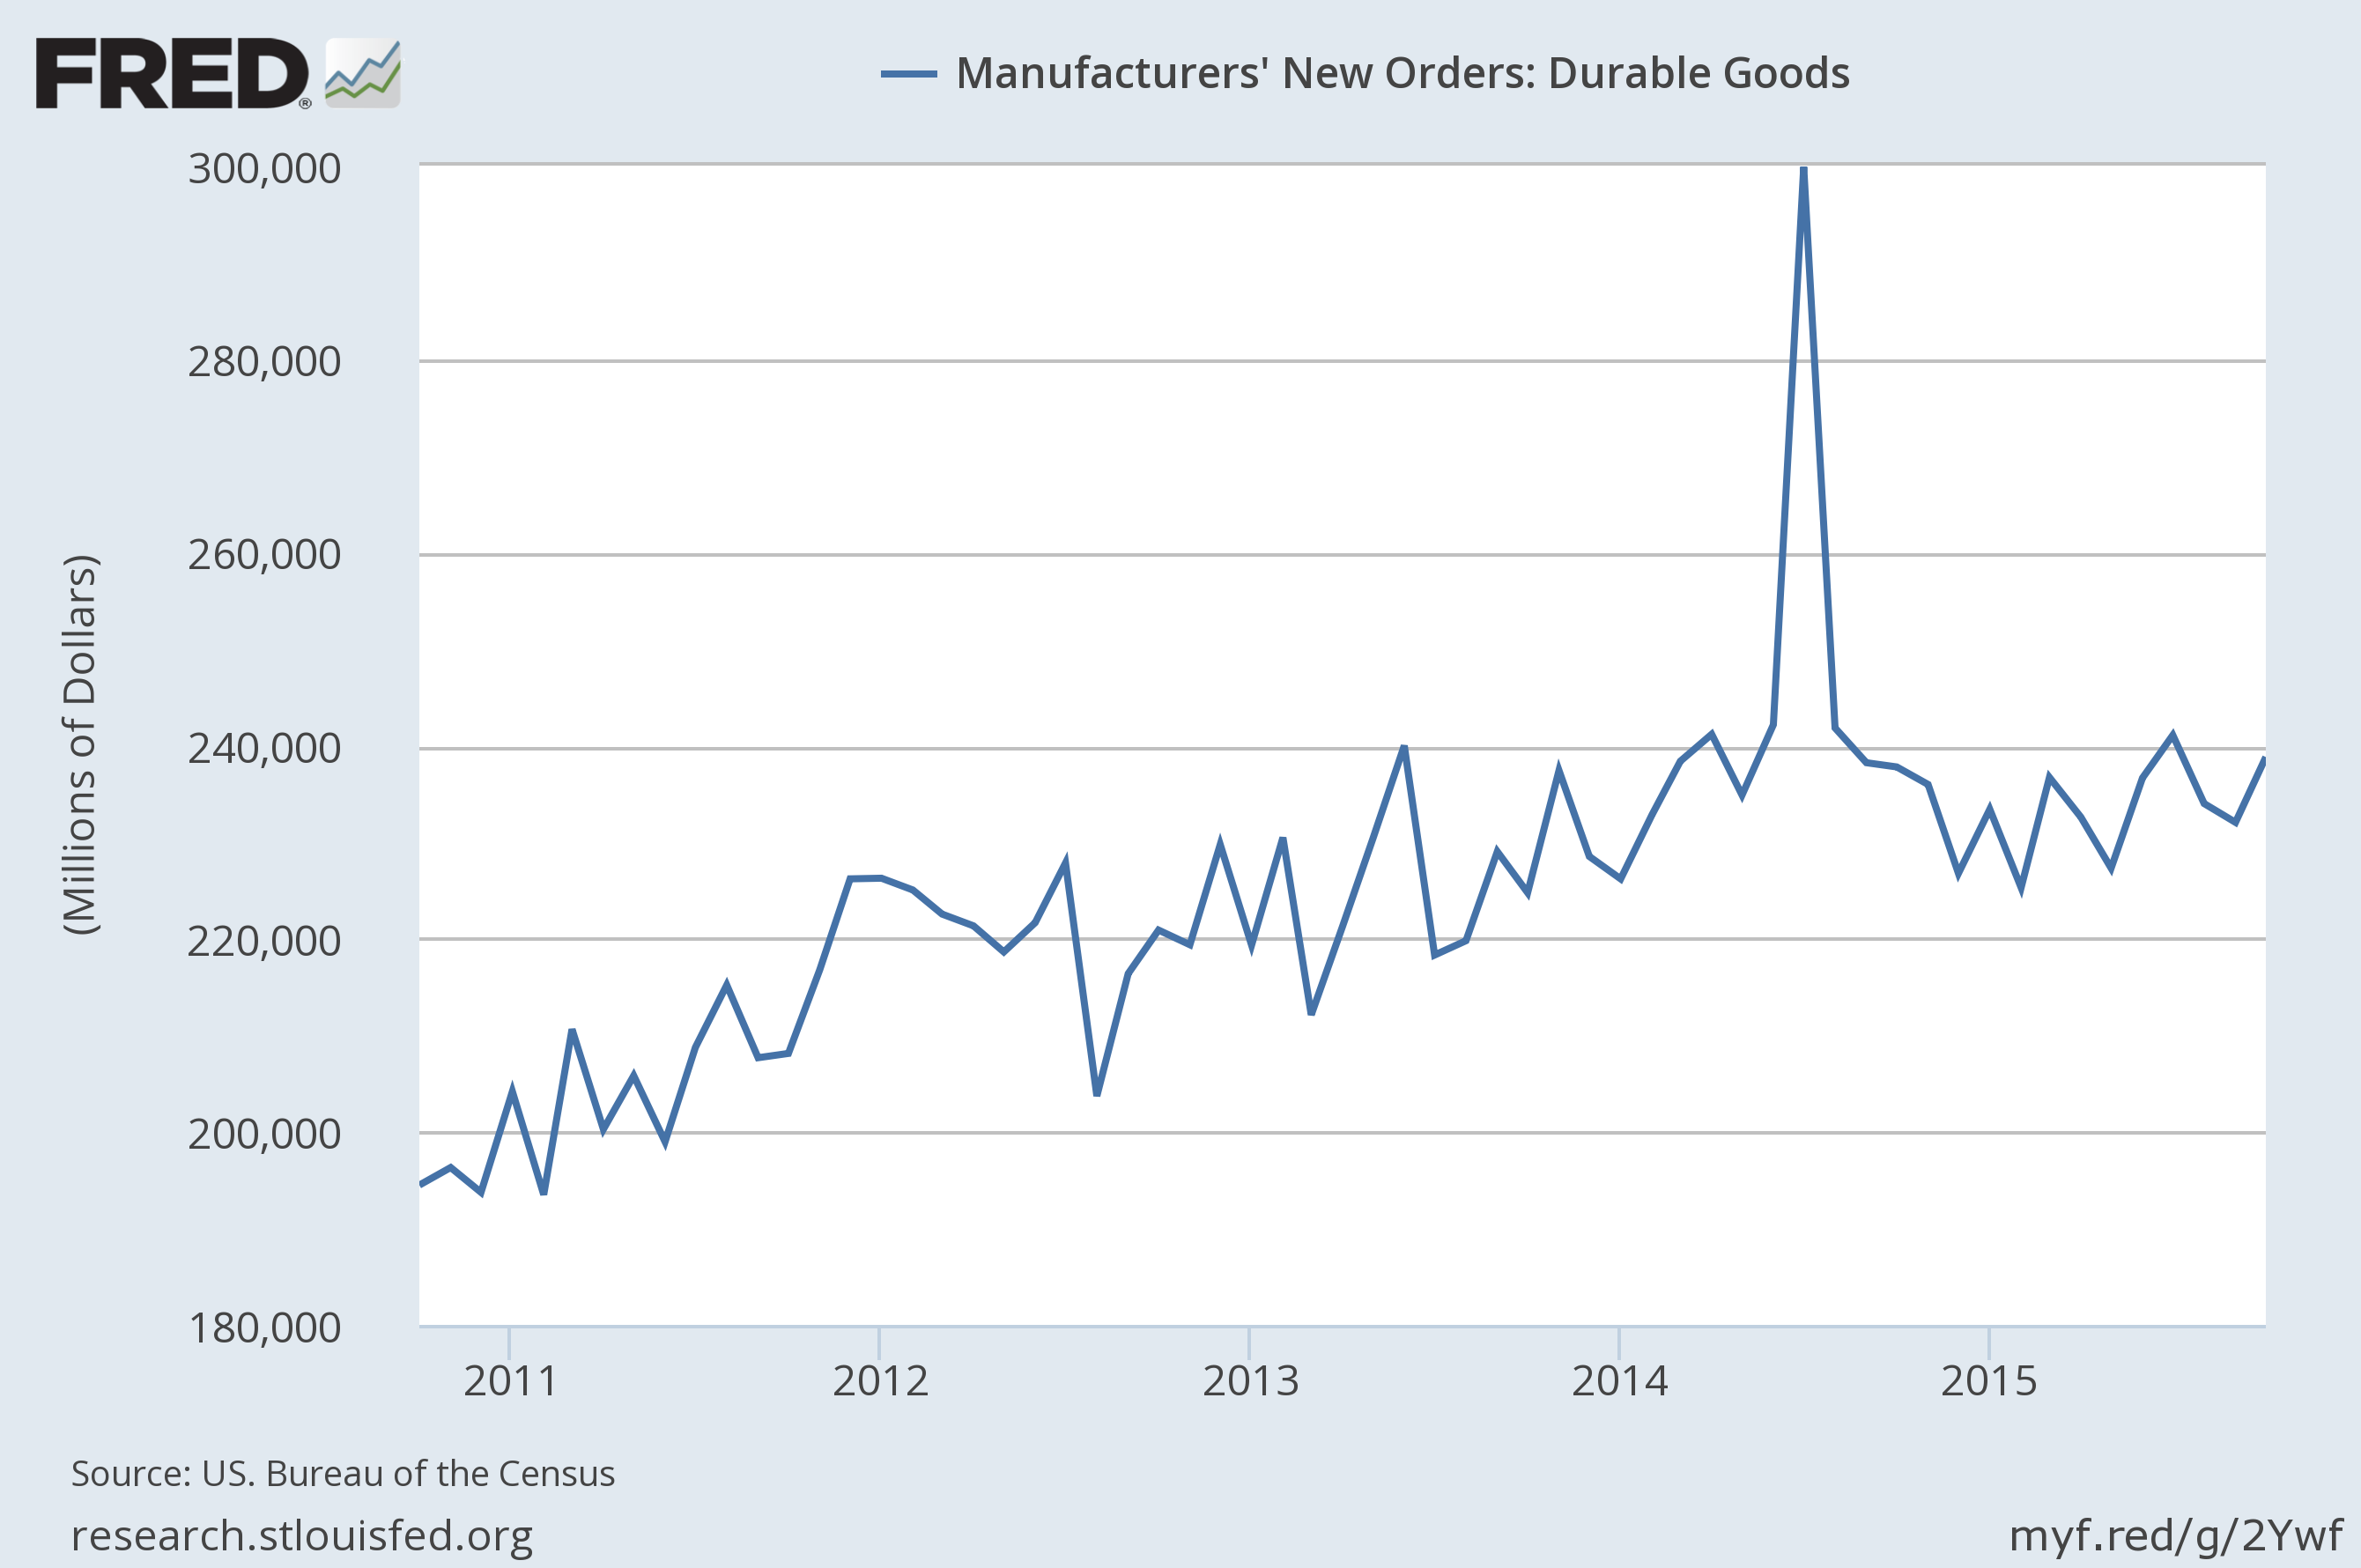
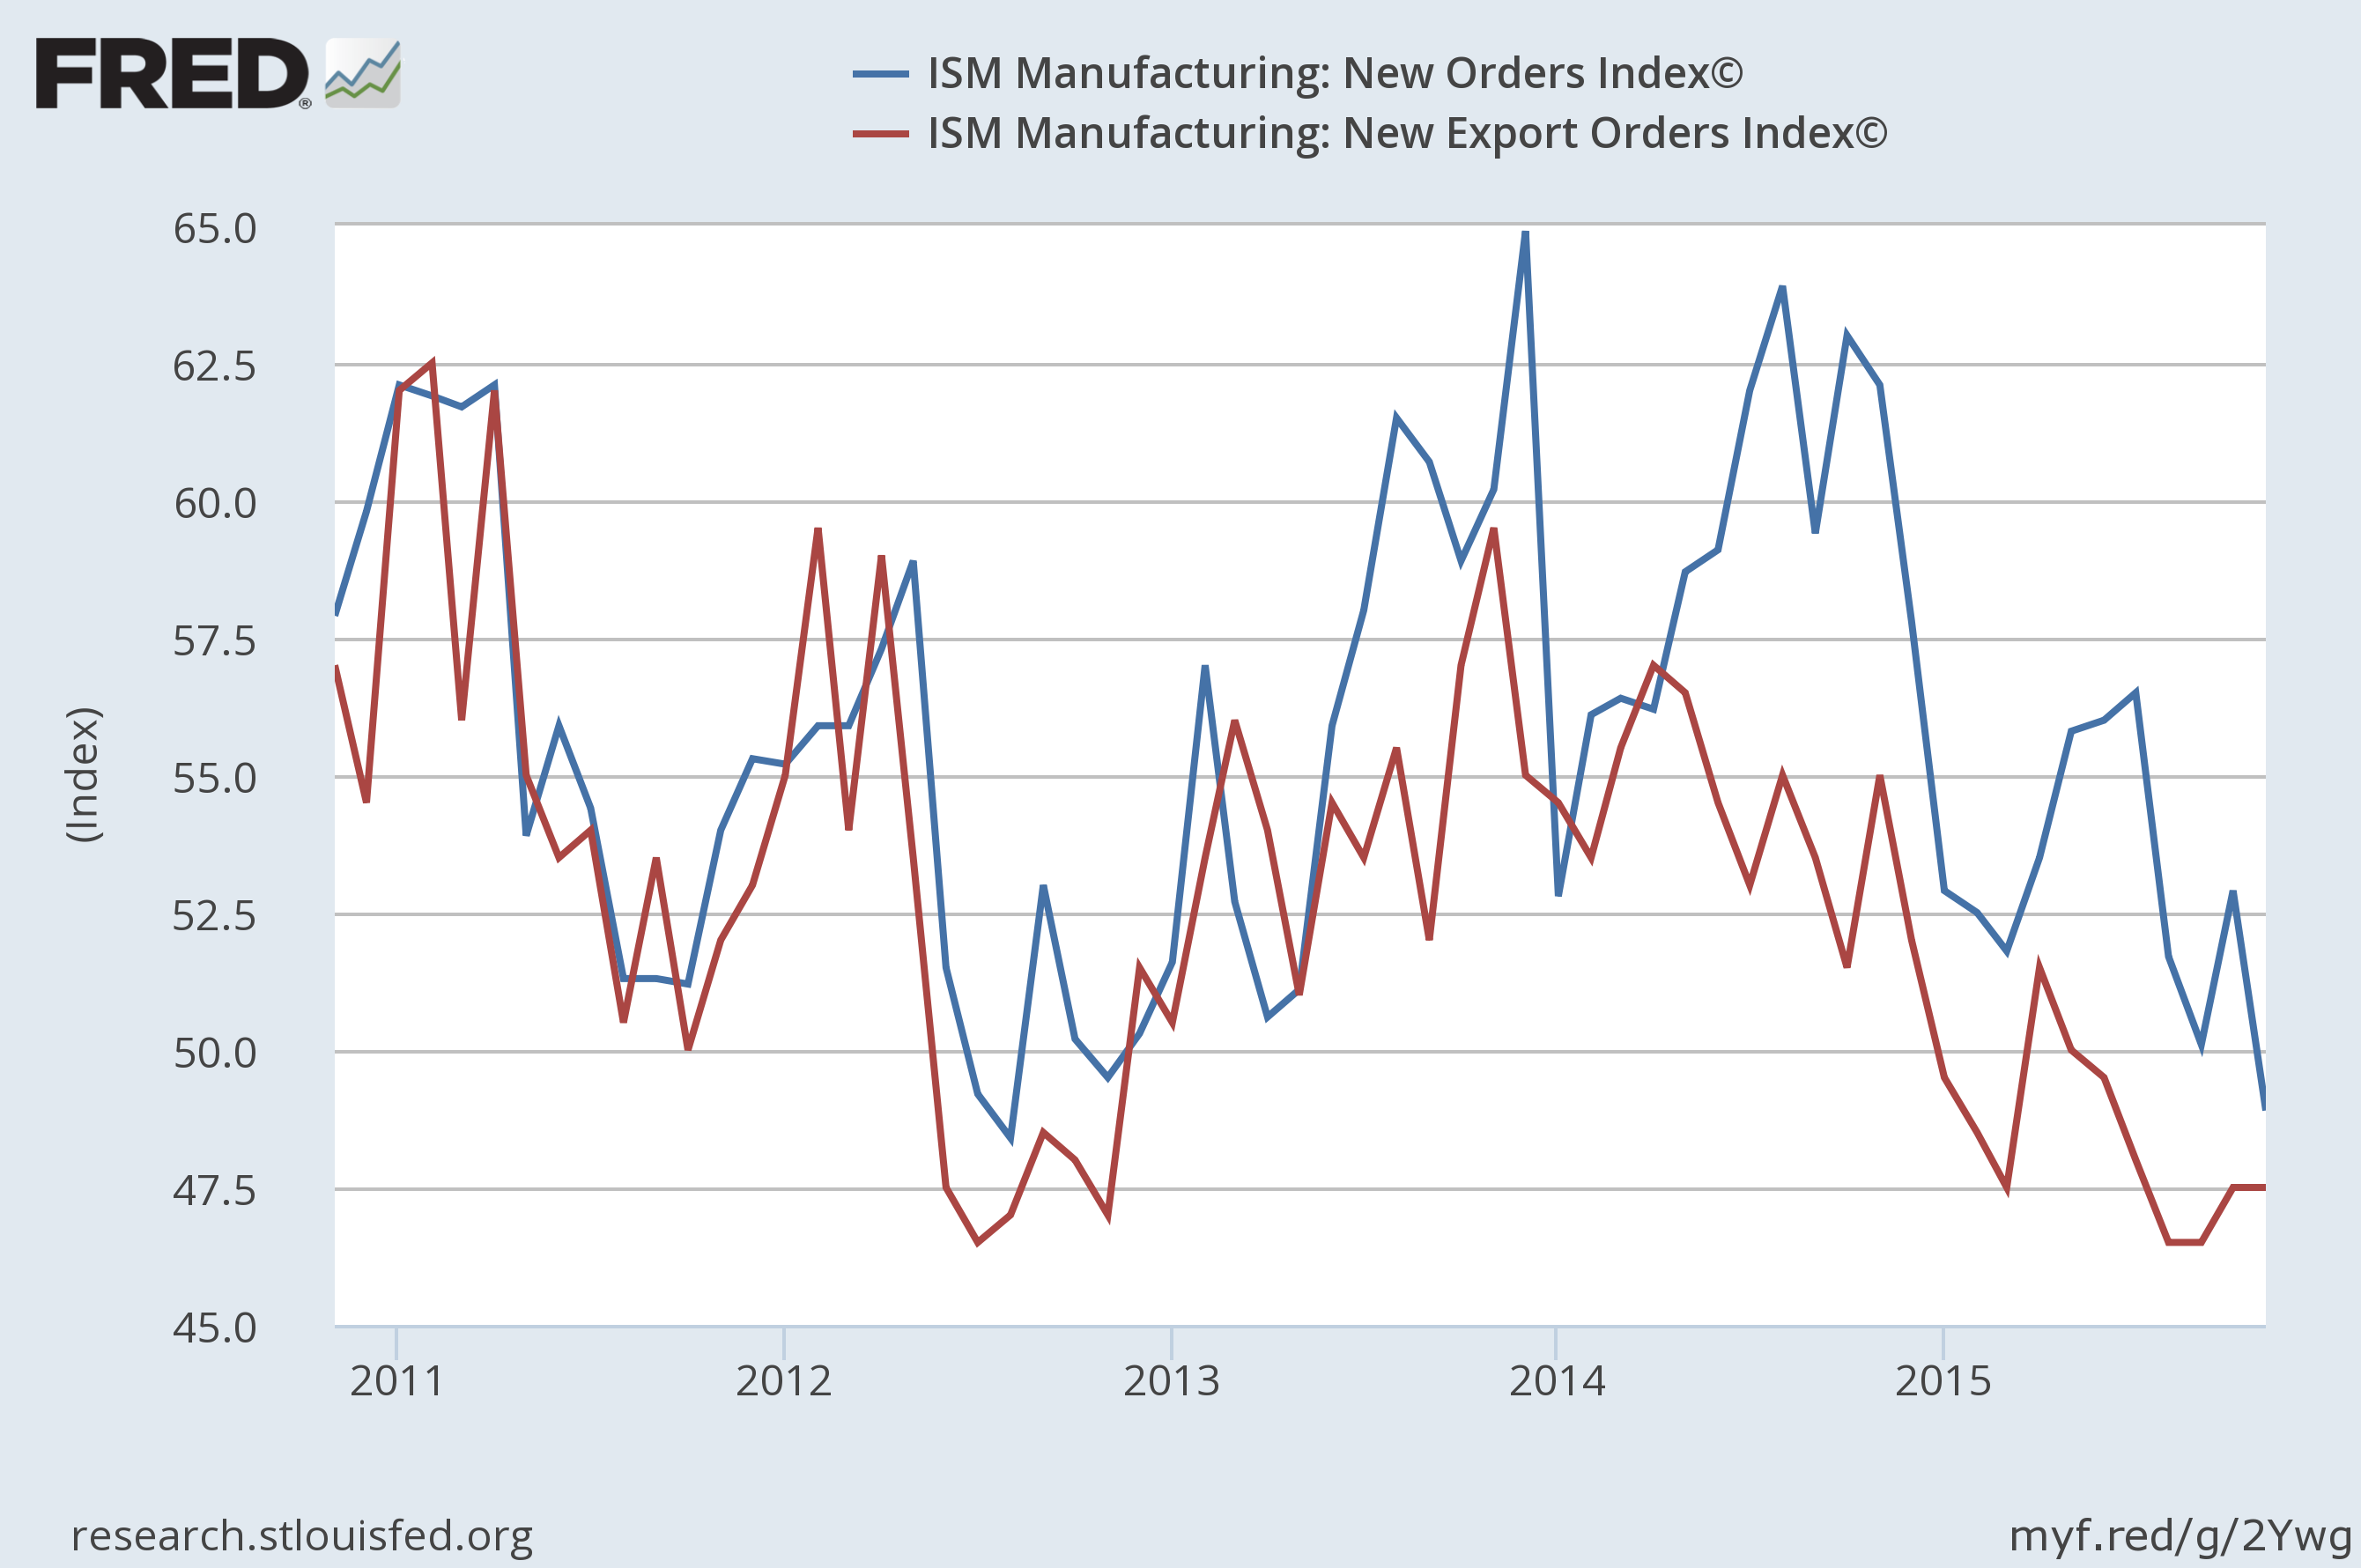
The top graph shows new orders for durable goods which has moved sideways for the last few years, save for one large spike. The bottom graph shows the ISM index for new orders and new export orders. Both recently fell below 50, indicating a contraction. Three inter-related events caused the weak industrial production and the decline in new orders: oil’s price decline, the strong dollar and weaker emerging market economies. None of these events will correct anytime soon, meaning weaker IP and new orders are with us for the foreseeable future. The real question going forward is will this weakness bleed into other areas of the economy? So far, it hasn’t. But that is something we’ll have to keep a close eye on.
Now let’s turn to the four long leading indicators, starting with the best news, which comes from the housing sector:
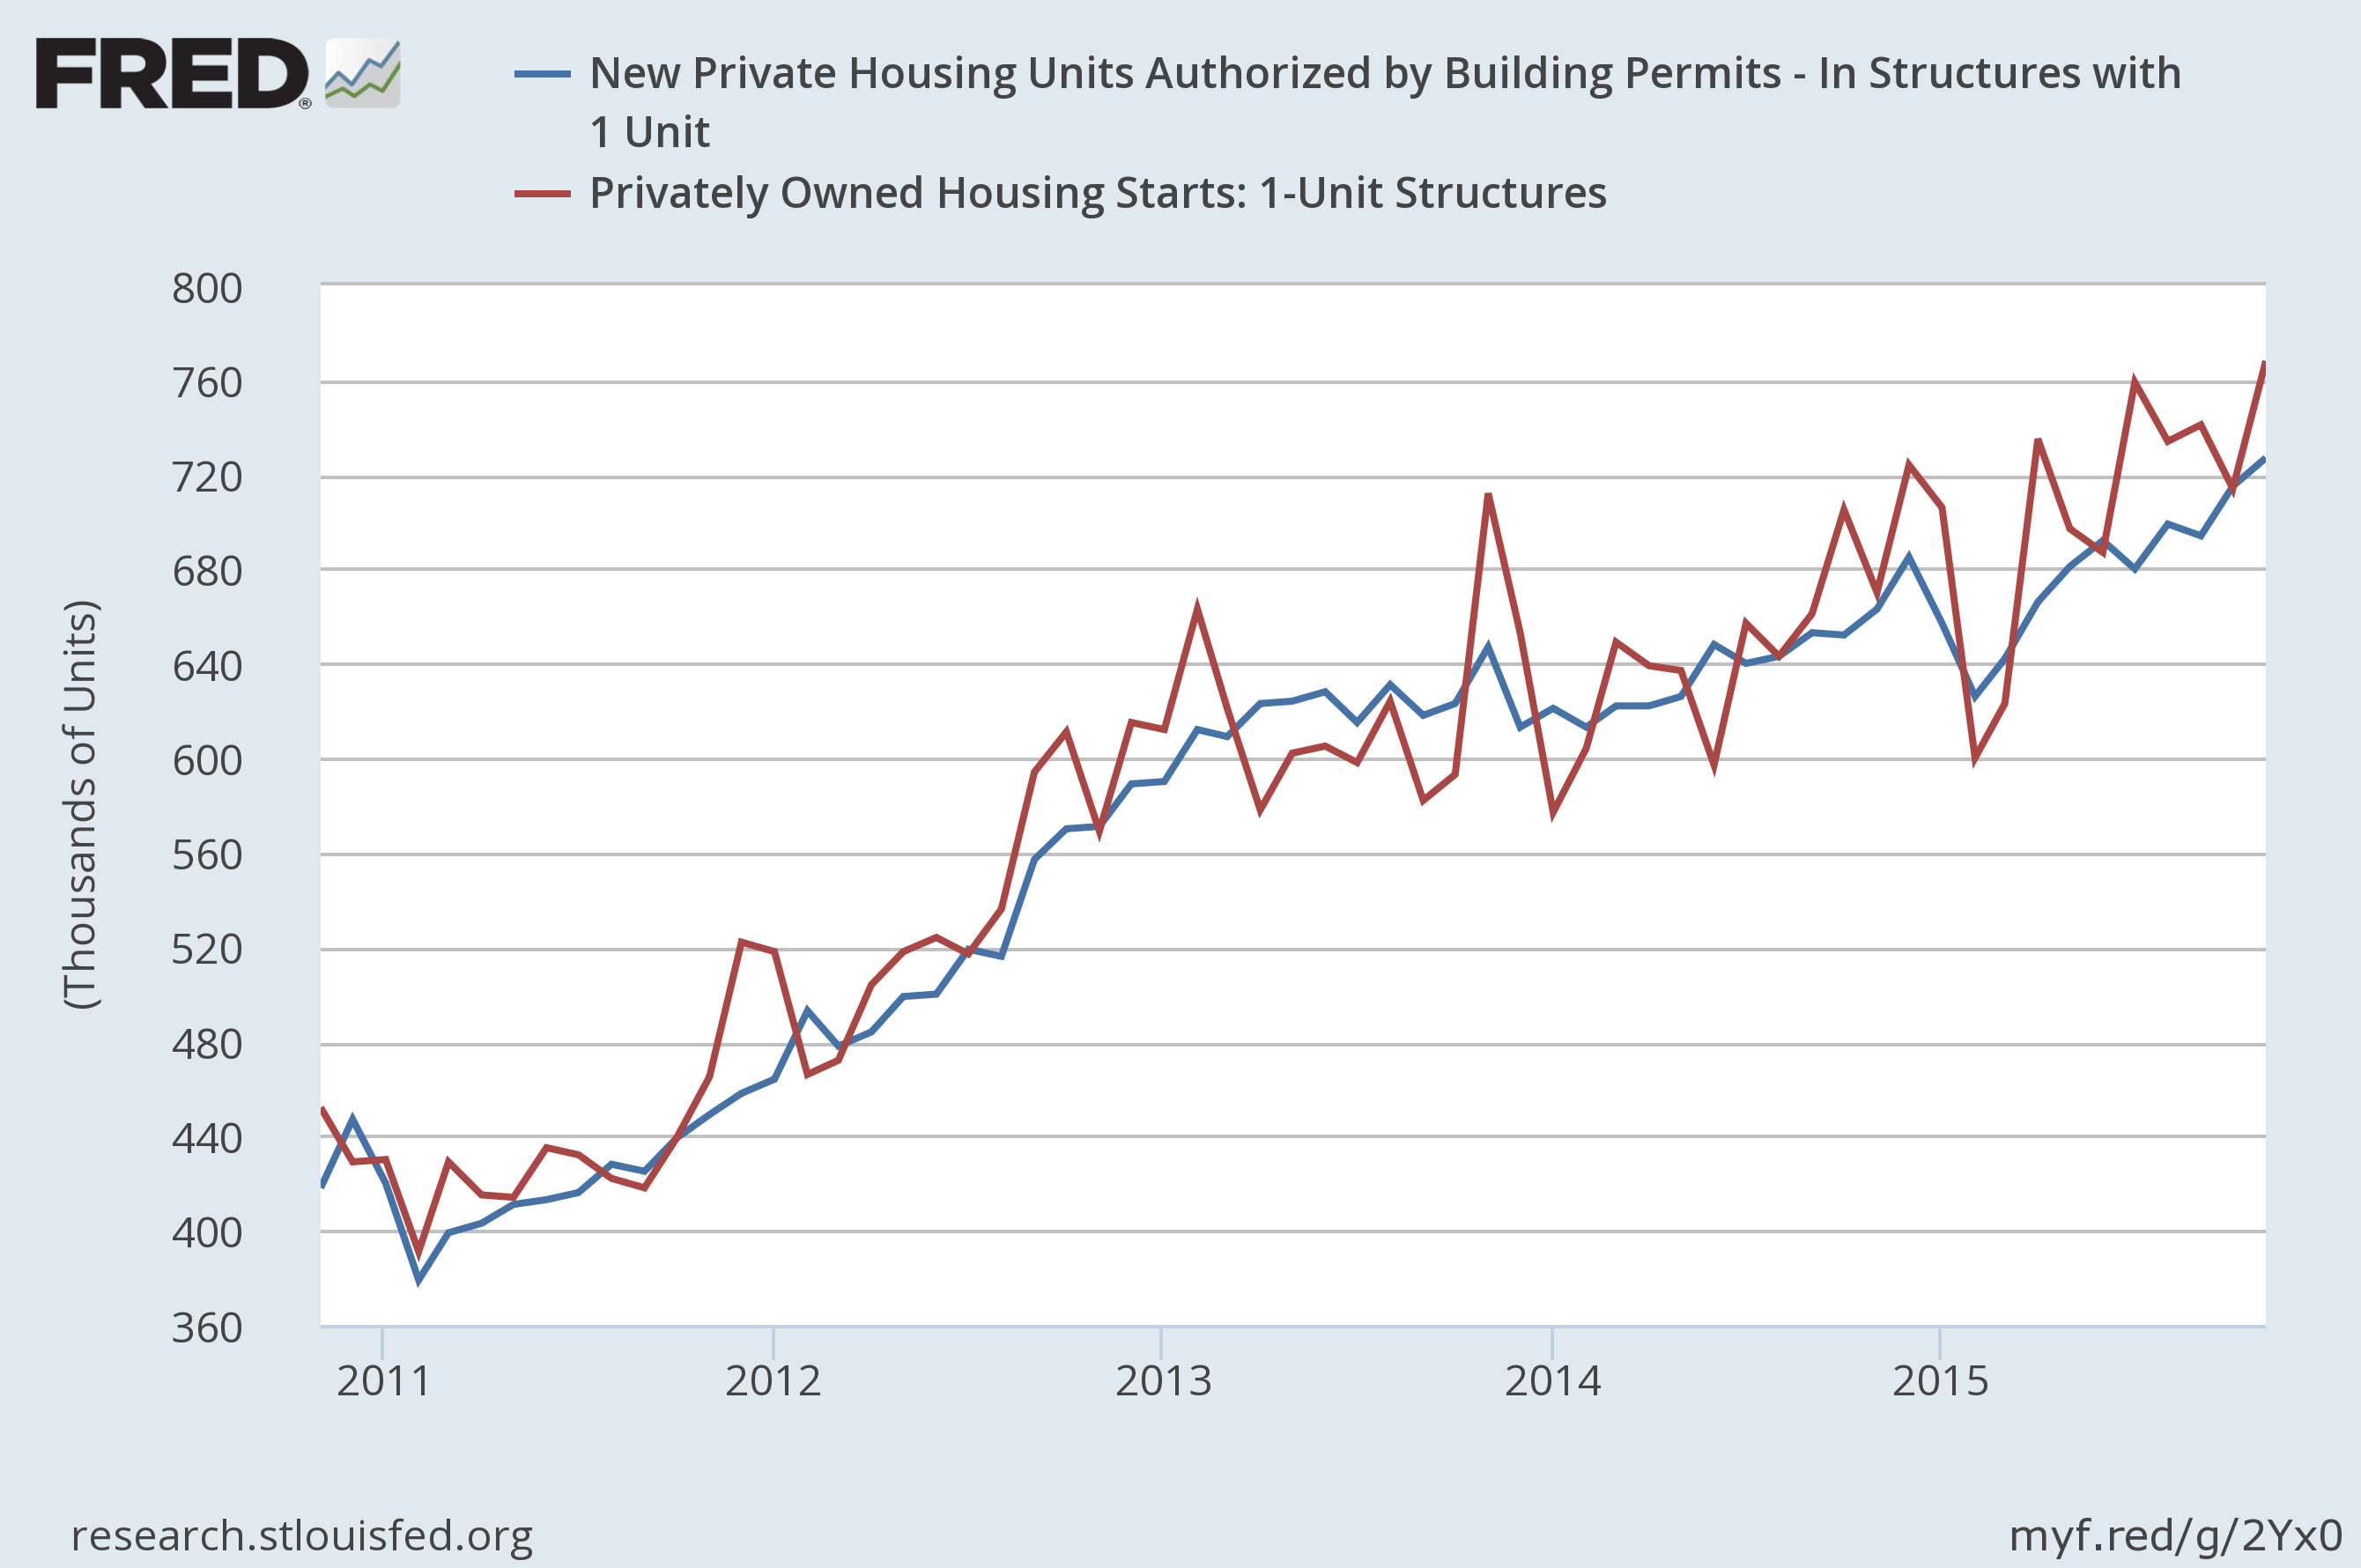
Permits and starts for 1-unit structures are in a clear 3-year uptrend. Most importantly, they’ve increased over the last year. As professor Leamer noted, “Housing IS the Business Cycle.” So long as it remains strong, there’s a solid possibility of continued expansion, even if it’s moderate. In addition:

The money supply is expanding. Like housing, so long as M2 expands, there’s a solid reason to expect, at worst, a moderate expansion.
Now let’s turn to the bad news, starting with bond yields:
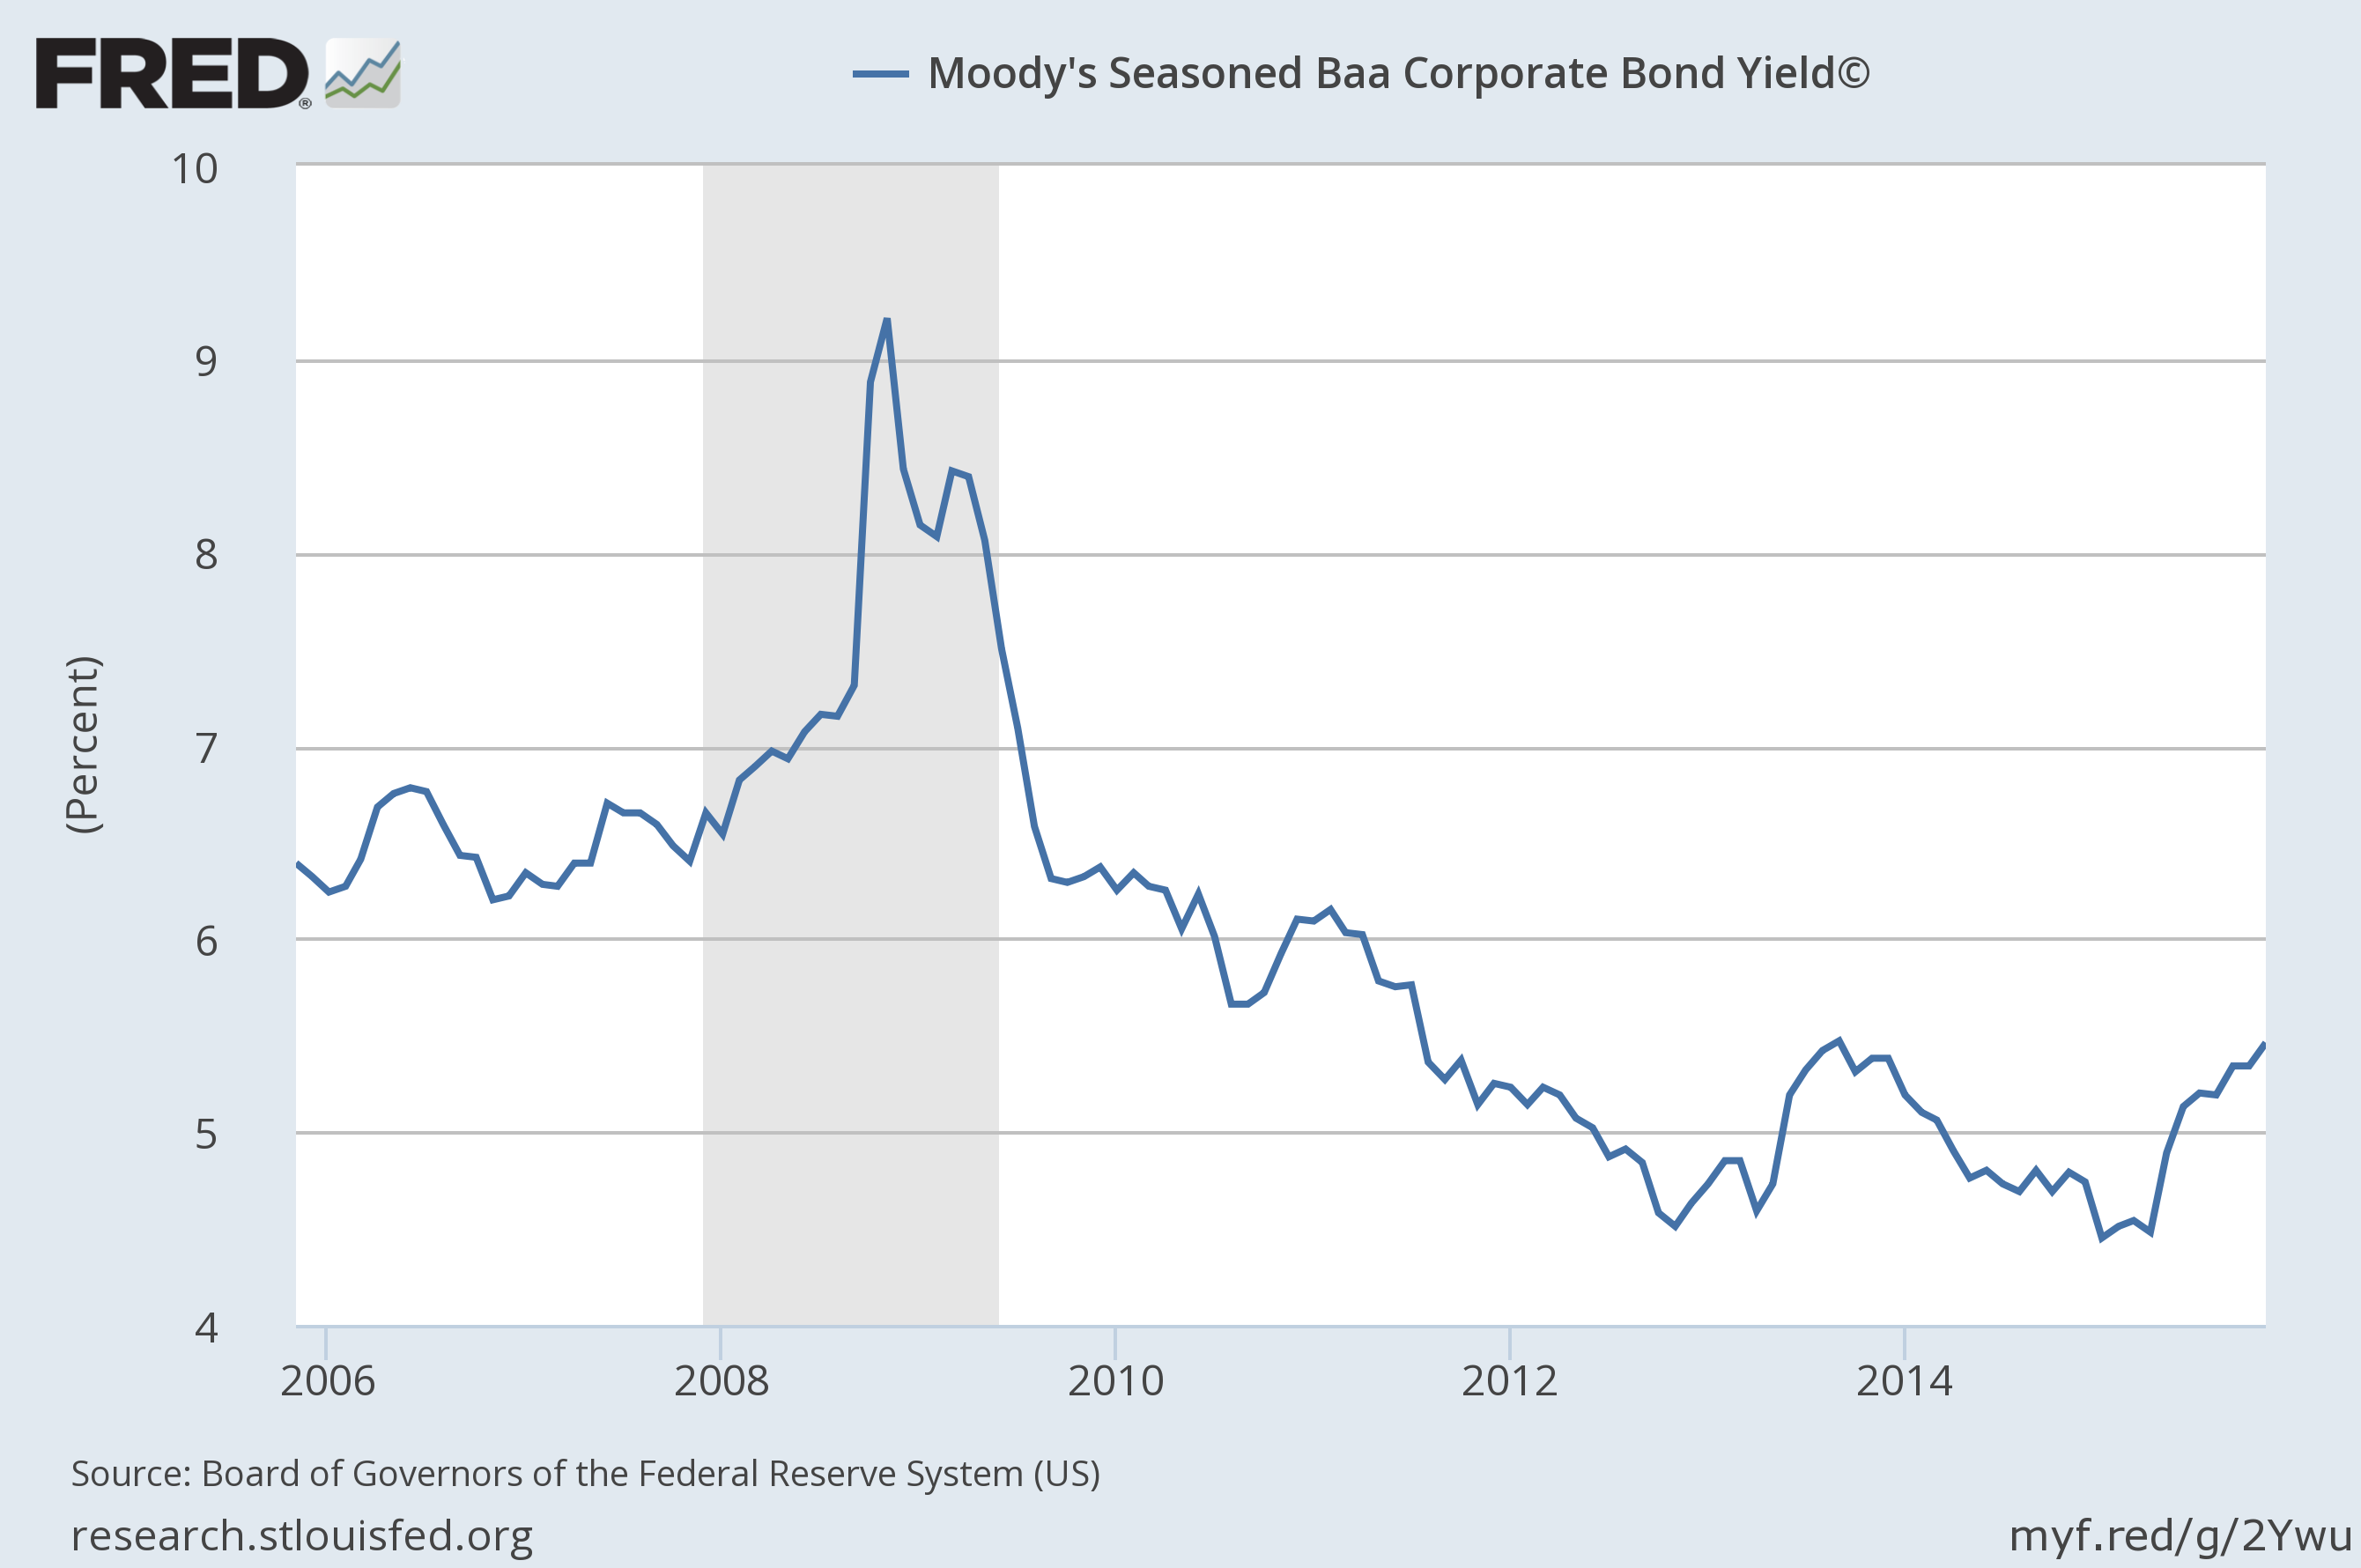
While junk bond yields have blown out recently, there’s a reason they’re not used as a long-leading indicator: they’re a bit too sensitive to economic vacillations. However, Baa’s are a bit less sensitive. And they’re showing some weakness. Yields are now near levels last seen at the end of 2013. This is partly the result of a heavily indebted fracking sector getting hit by lower oil prices. But regardless of the cause, there is weakness in lower-grade credits. And that could potentially cause problems in the intermediate and long term.
And finally, there are corporate profits:

Regardless of which measure is used, they’ve weak. And that’s not good.
Conclusion: Overall, the US economic environment is one of weaker, but positive, growth. But there are important areas of concern emerging. The manufacturing sector has taken a hit thanks to a strong dollar, weak oil and slowing emerging economies. The oil slowdown has led to an increase in lower-rated credit problems. And weaker overseas economies plus a strong dollar are slowing corporate revenue growth. These combined area so weakness led some commentators – myself included – to argue the Fed’s rate hike was ill-advised.
(c) Hale Stewart
http://community.xe.com/blog/xe-market-analysis


