International Economic Week in Review: Year End Look as the EU, UK and Canada, Edition
Euro Area
Let’s begin with President Draghi’s description of the EU region that he made during his latest monetary policy press conference:
Let me now explain our assessment in greater detail, starting with the economic analysis. Euro area real GDP increased by 0.3%, quarter on quarter, in the third quarter of 2015, following a rise of 0.4% in the previous quarter, most likely on account of a continued positive contribution from consumption alongside more muted developments in investment and exports.
The good news is simple: over the past six quarters, the pace of EU GDP growth consistently increased:
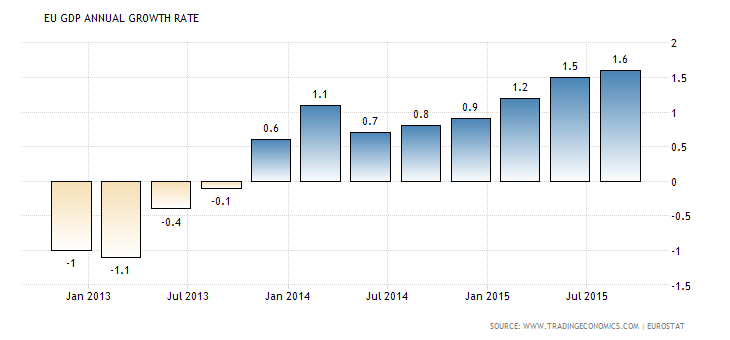
Y/Y GDP growth increased from .7% in 2Q14 to 1.6% in 3Q15. The service and manufacturing PMIs point to continued growth:
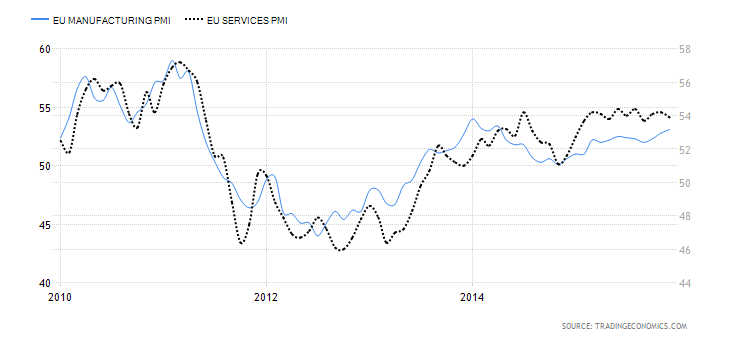
The manufacturing PMI (blue line) and service PMI (dotted black line) continually printed above 50 for 2015, indicating continued expansion.
And, as Draghi pointed out, consumer spending is largely responsible for that growth:
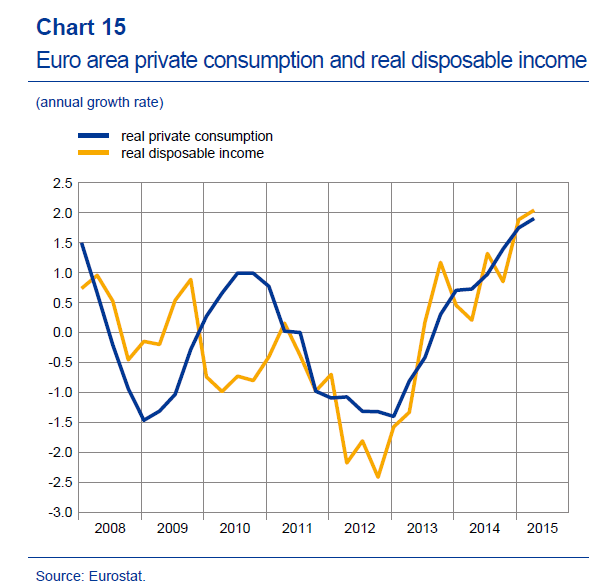
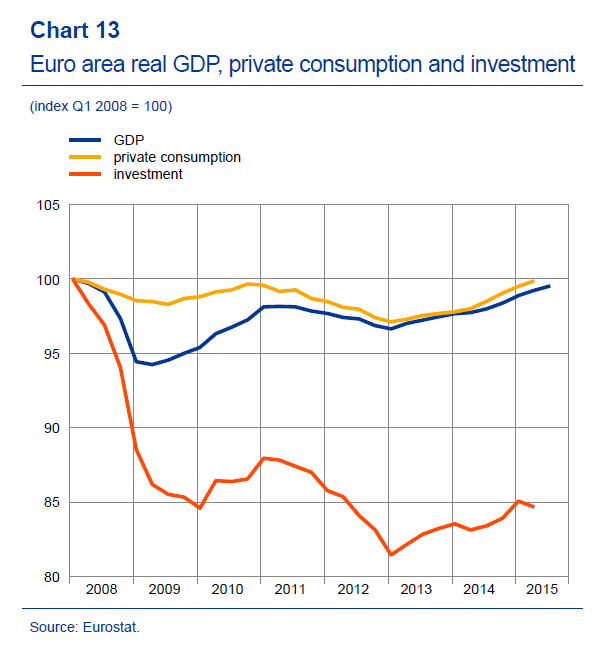
The top chart shows that since 4Q12 consumer spending rose with income. The bottom chart shows the approximate levels of consumer spending and investment since the recession’s end. Private consumption fluctuated slightly below the 100 level for the last 6 years. In contrast, investment dropped sharply until the beginning of 2013 and remains 15% below its pre-recession peak. Its current level remains far below its end-of-recession levels. The following chart explains investment’s weakness:
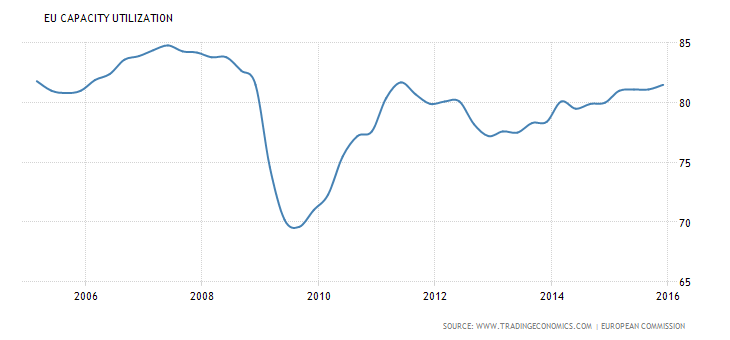
Capacity utilization peaked near 85% before the recession. After the crash, it fluctuated around the 80% level, indicating EU industry has a fair amount of spare capacity to use before adding new investment.
Two large problems remains, however: high unemployment and weak inflation:
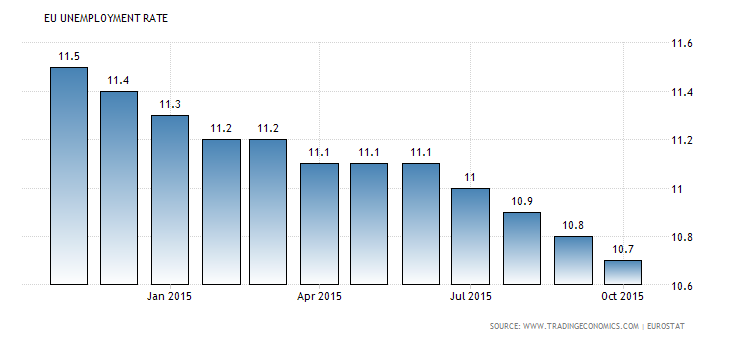
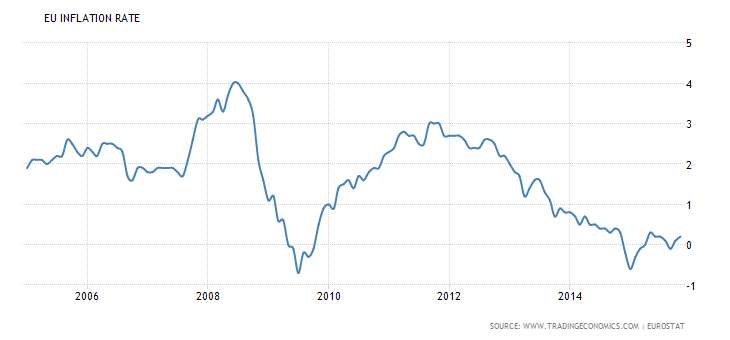
Unemployment (top chart) decreased from 11.5% in 11/14 to 10.7% in 10.15. Inflation (bottom chart) remains stubbornly weak at just above 0%. These two numbers remain the biggest thorn in the EU’s side.
Overall, the EU is in a solid position for 2016. Markit reported manufacturing and service numbers higher than 50 for the last 12 months, which indicates business should continue expanding moderately in the near future. Unemployment continues to decline while consumption increases. And the OECD’s EU LEIs are rising.
Canada
Bank of Canada Deputy Governor Timothy Lane gave a speech in early 2015 where he explained the net negative impact of low oil prices on Canada:
The most immediate impact will be positive: a boost to consumers’ disposable incomes and spending. Lower oil prices will also benefit many sectors, such as manufacturing, by reducing production costs. Our latest Business Outlook Survey, which was published yesterday, showed that more firms than in previous surveys are anticipating declines in their input costs, thanks in good part to cheaper oil and cheaper commodities in general.
The positive effect on the world economy and the resulting stronger growth would also be positive for Canada. A buoyant global economy would increase Canada’s non-energy exports, boost confidence and lead to improved business investment.
However, these gains will be more than reversed over time as lower incomes in the oil patch and along the supply chain spill over to the rest of the economy. The decline in Canada’s terms of trade will also reduce the country’s wealth.
The lower prices, if they are expected to persist, will significantly discourage investment and exploration in the oil sector. As I mentioned earlier, we are already seeing signs of this.
Lower oil prices are also typically accompanied by a weaker Canadian dollar, and this time is no exception. The dollar’s depreciation by over 10 per cent against the U.S. dollar in the past six months will help cushion the economy from the impact of lower oil prices.
Despite the mitigating factors I enumerated, lower oil prices are likely, on the whole, to be bad for Canada. Estimating the magnitude of that overall impact requires carefully analyzing the interplay between the various effects as they work through the economy. That is what we are doing as we prepare next week’s forecast.
Lane argues the decline in investment and commensurate lower business incomes associated will be higher than the increases from consumer spending. The data confirms this analysis:
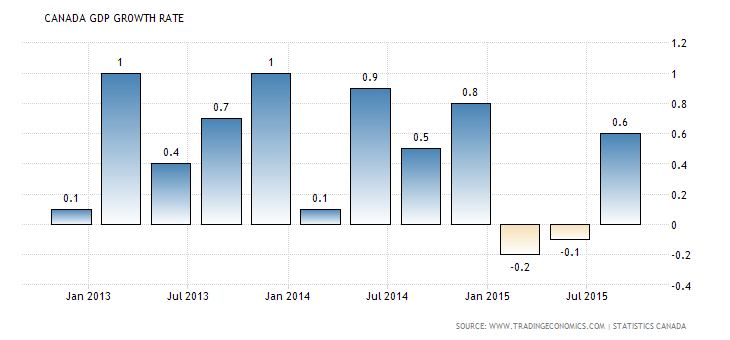
Canada experienced a technical recession in 1H15.
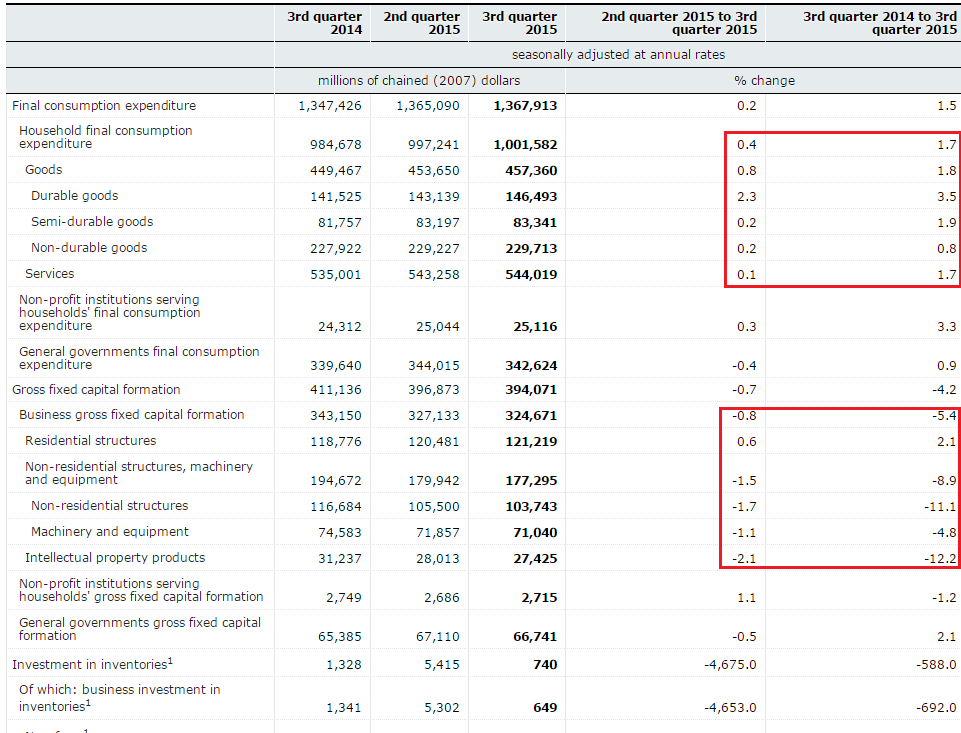
Households are still spending. However, the 3Q Y/Y rate was a weaker than desired 1.7%.
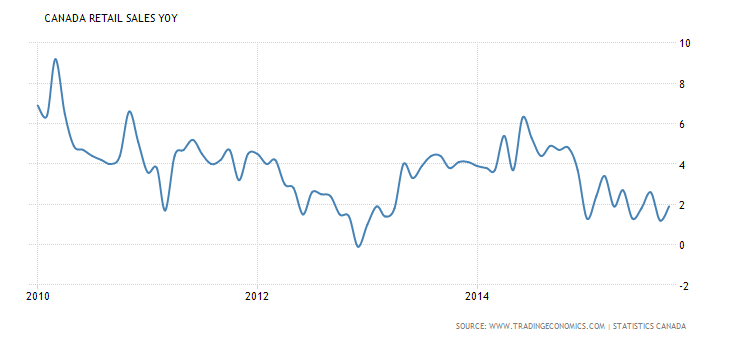
And while retail sales continue to expand, their pace declined from ~4% for 2013-2014 to their current pace of ~2%.
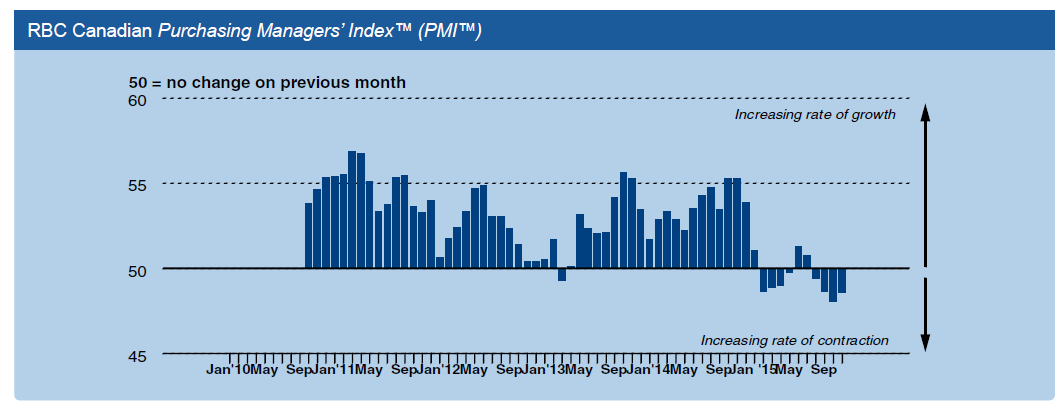
Business is hurting, however. Capacity utilization dropped off in the 1H15. This led to a decrease in investment: non-residential structures spending contracted 1.7% Q/Q and 11.1% Y/Y while fixed capital investment dropped 1.1% Q/Q and 4.8% Y/Y (see table above). The RBC manufacturing PMI reflects this overall weakness:
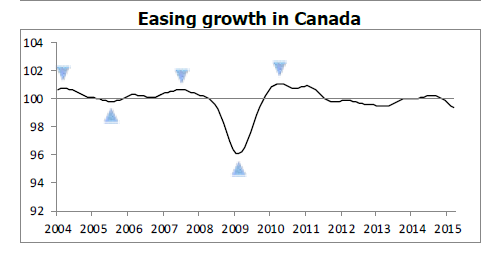
And with oil projected to remain weak for the next 6-12 months, there is little reason to expect a meaningful pick-up anytime soon. The weak reading from the OECD’s Canadian LEIs support this conclusion:
UK
Recently published minutes from the BOE provide the following overview of the UK economy
There had been little news during the month about the pace and composition of the UK expansion, with robust private domestic demand having continued to counter-balance subdued external demand. GDP was estimated to have grown by 0.5% in 2015 Q3, unchanged from the initial estimate. Bank staff continued to expect an upward revision over time to 0.6%. There had been little news in the output split, with robust services and energy output more than offsetting outright falls in the construction and manufacturing sectors. The estimated expenditure composition of growth had been broadly similar to that incorporated in the November Inflation Report. Private consumption growth had been firm, at 0.7%. Business investment growth was estimated to have been a little higher than expected at 2.2%, while housing investment had been notably weaker – although estimates of both were highly uncertain at that stage in the data cycle. Net trade was estimated to have reduced GDP growth by 1.5 percentage points in Q3, unwinding the similar-sized positive contribution in Q2. But the ONS had indicated that the pattern of trade growth was likely to be revised to a smoother profile in due course, as previously flagged concerns with the trade data were addressed.
The following graphs from the ONS provide an explanation of the BOE’s statements:
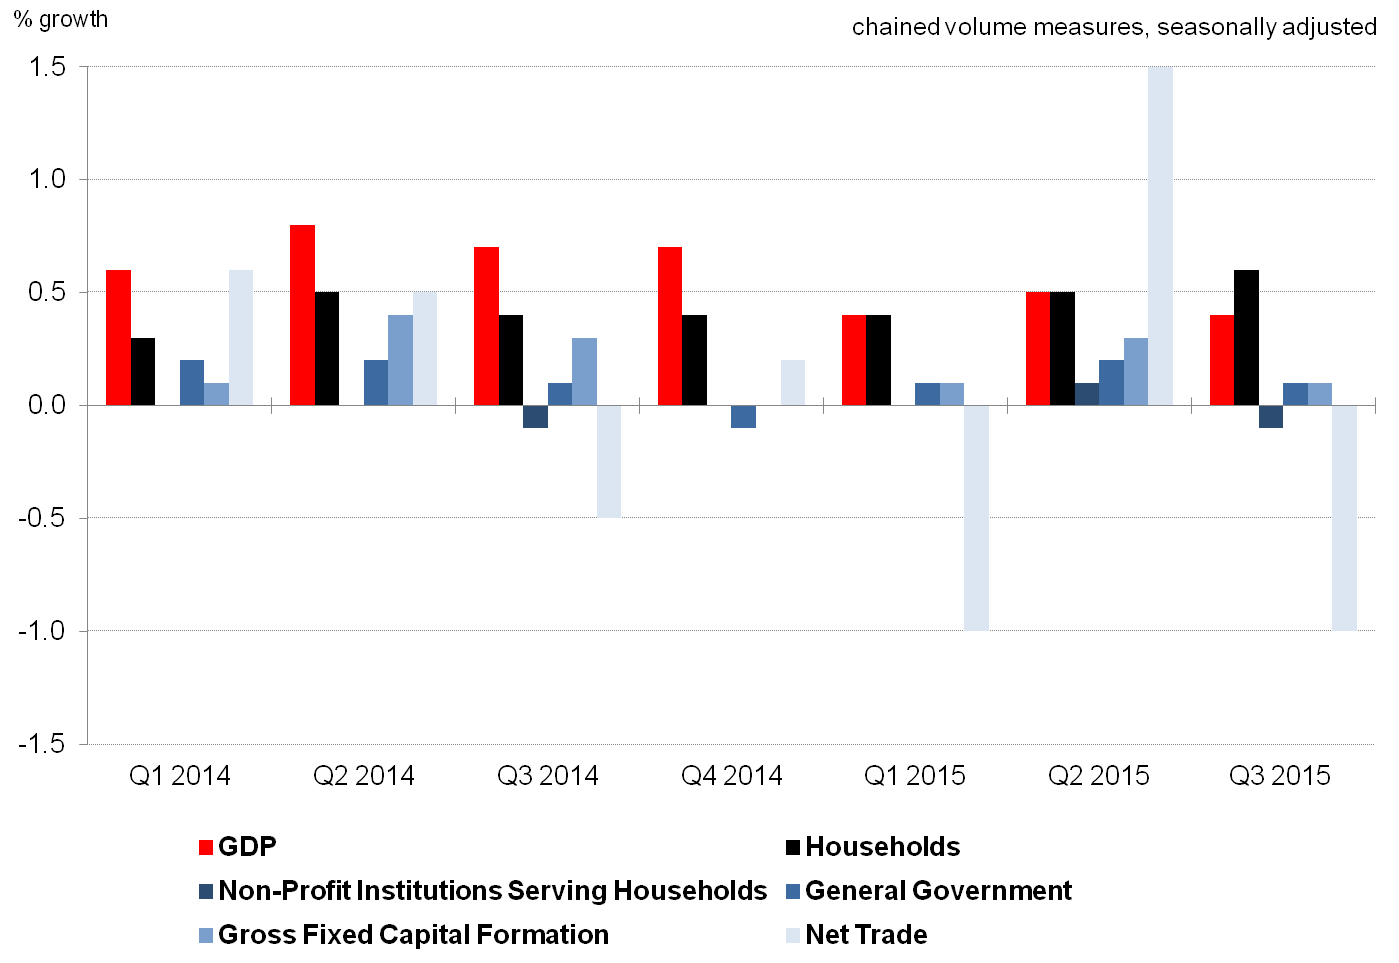
The above graph shows the quarterly GDP growth along with its components. The black bar represents household spending which has consistently contributed to GDP growth. Total investment (the fifth bar from the left in each quarter), however, has been weak. And net trade has meaningfully subtracted from growth during several quarters.
Let’s turn to PCEs and investment:
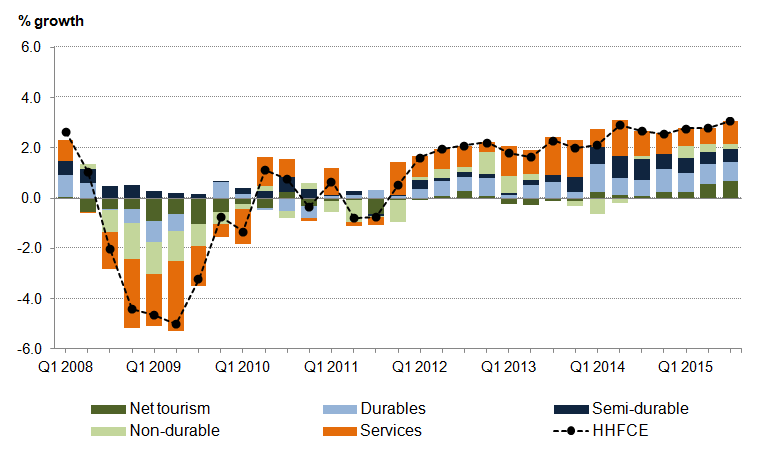
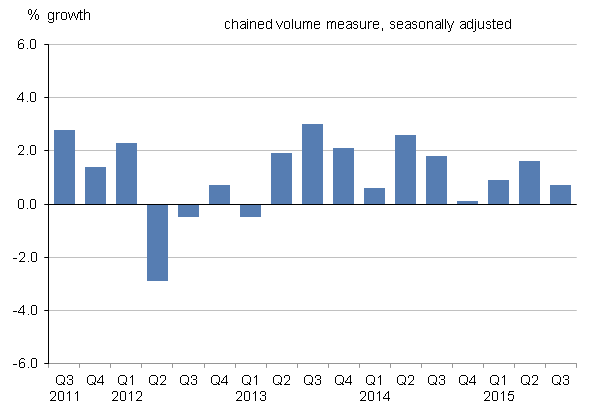
The top chart shows PCEs for the last five years. They’ve consistently grown between 2%-2.5%. The bottom chart shows business investment. It, too, has been positive. But its contribution to growth declined in the last four quarters.
2016, however, is less certain. While both service and manufacturing PMIs continue to show moderate expansion, the Conference Board’s and OECD-s LEIs are showing weakness, largely due to negative contributions from the manufacturing sector. Weak emerging economies and the strong sterling are tamping down global demand. So long as domestic demand remains strong, this shouldn’t lead to a decline in GDP. But industrial weakness is never a good development and should be monitored.
(c) Hale Stewart
http://community.xe.com/blog/xe-market-analysis