Highlights:
- Stocks Move Into Correction Phase – First Since 2011
- Valuations Start to Improve
- Investor Skepticism on the Rise
- Breadth Has Broken Down
Breadth turned bearish in August, and with it the overall weight of the evidence moved from neutral to arguing for more caution. This came as the trading range environment seen earlier in the year morphed into the first 10% correction experienced by the S&P 500 since 2011. While the proximate cause of the sell-off was a China-related challenge to central bank credibility, deteriorating breadth, excessively high valuations, and generally poor investor liquidity were all contributing factors. Even as the popular averages established narrow trading ranges in the first seven months of 2015, rally participation within the indexes was faltering. As the selling unfolded in August, downside momentum built up and we finally saw some evidence of fear and panic from investors. A panic low was established and downside momentum appeared to be halted as the support/resistance parameters for a consolidation phase came into focus.
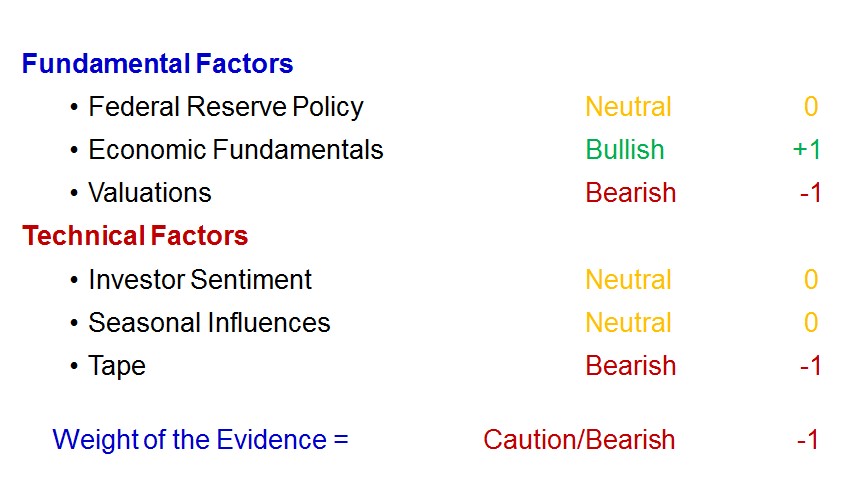
At this point, cycle lows for the popular averages may well be in place. This is not yet supported by the weight of the evidence, however. Simply put, risks remain elevated and it is too early to sound an all clear. We have seen some evidence of fear and panic, but investors remain plagued by poor liquidity. History suggests that a re-test of August lows prior to substantially higher highs is more likely than not. The good news is that such a re-test could provide a chance for bullish breadth divergences to emerge. Improving seasonal patterns and the prospect of better clarity from the Fed could provide tailwinds for stocks in the year’s final quarter.
After moving within a historically tight range for over nine months, the pressure from downward momentum and deteriorating breadth proved overwhelming. Support on the S&P 500 near 2040 gave way and the first 10% correction since 2011 quickly emerged. After an initial bounce off the lows, history suggests a consolidation phase and re-test of the lows is most likely. This would be constructive if it helps keep skepticism high and allows for the emergence of bullish breadth divergences.
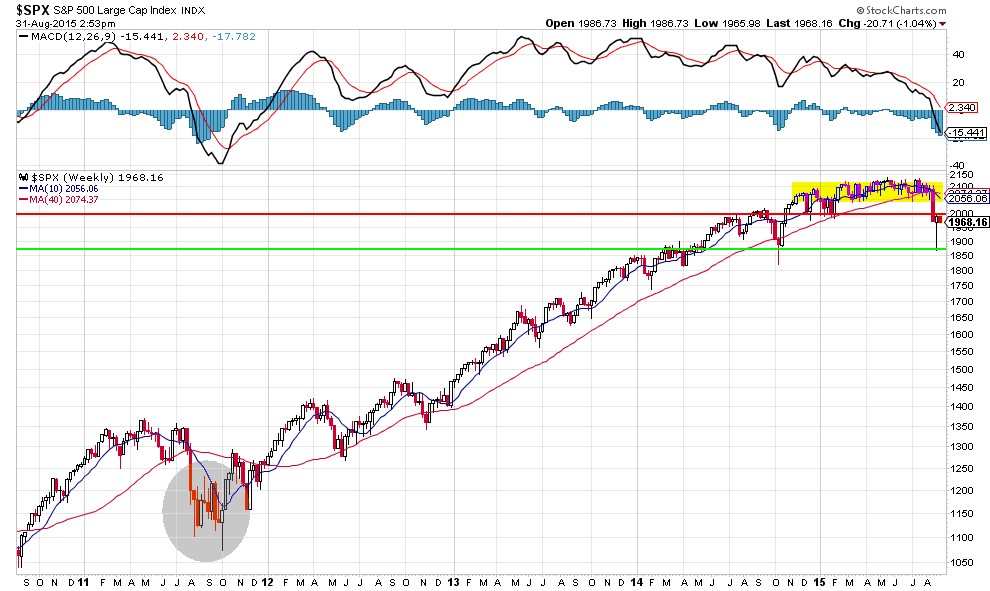
Source: StockCharts
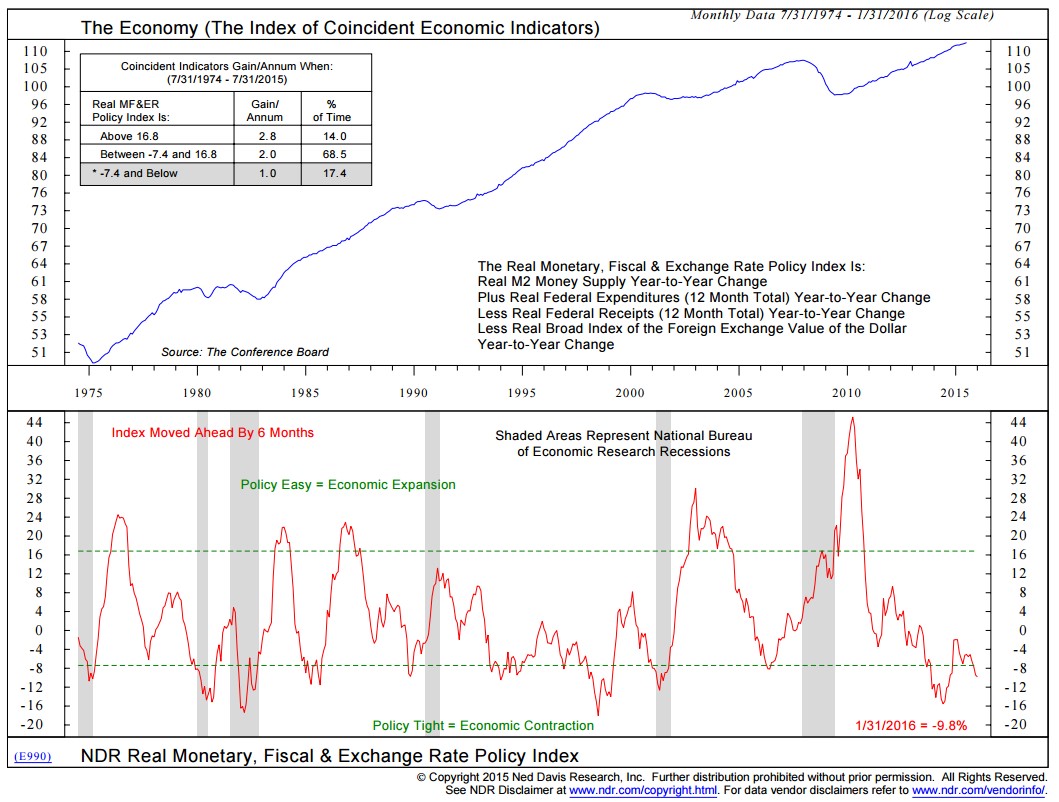
Source: Ned Davis Research
Federal Reserve Policy is neutral. Following a botched response to stock market volatility by the Chinese central bank, the Fed’s own credibility is the focus of attention. Uncertainty over the Fed’s rate hike plans is a headwind for stocks, and the overall monetary, fiscal and exchange rate policy environment has already gotten tighter (as can be seen in this chart). In other words if the Fed backs away from beginning to normalize interest rates in September, it will send a mixed message and risk undermining its credibility with the markets. The better course (and more bullish outcome in our view) would be to endorse its past plans and the strength of the economy and begin the slow path to normalization sooner rather than later.
Economic Fundamentals remain bullish. Individual data releases often get overanalyzed and overreacted to. Too often we focus exclusively on the trees and cannot see the forest. When the Fed describes itself as data dependent that does not mean it treats all data the same – it is not looking at a sequence of trees. The hope and expectation is that it sees the forest as whole. Stepping back from the monthly flow of data, we can see a trend emerging for the economy. The bottom clip in this chart shows that after more than a decade the economy is finally able to grow modestly above potential. This reflects healing in the economy, is bullish for stocks, and supports near-term action by the Fed.
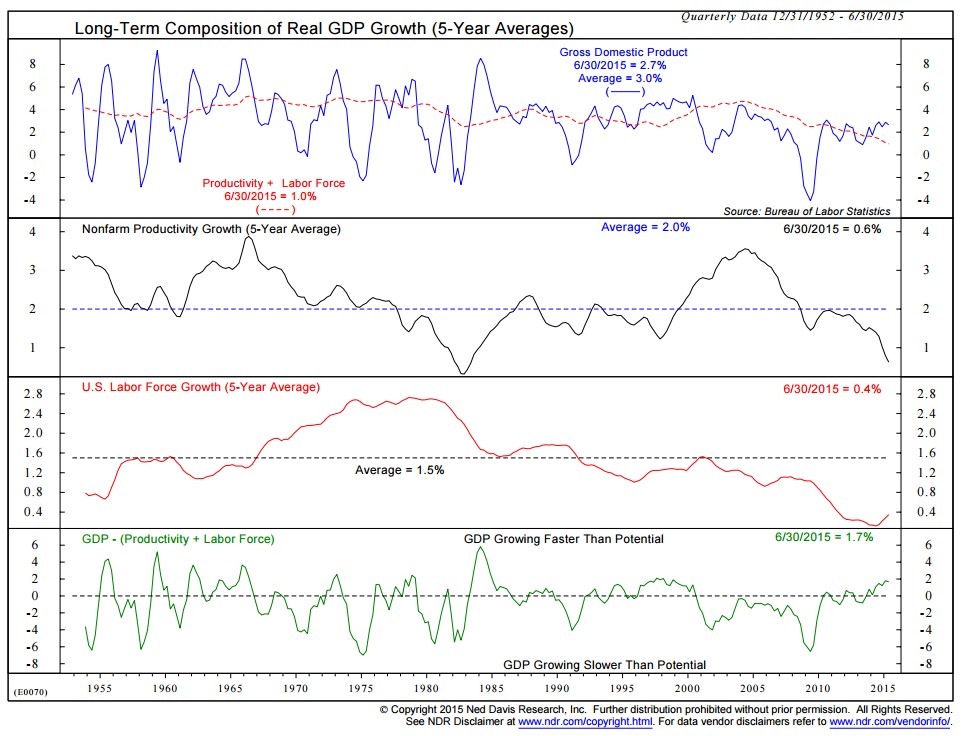
Source: Ned Davis Research
Source: Ned Davis Research
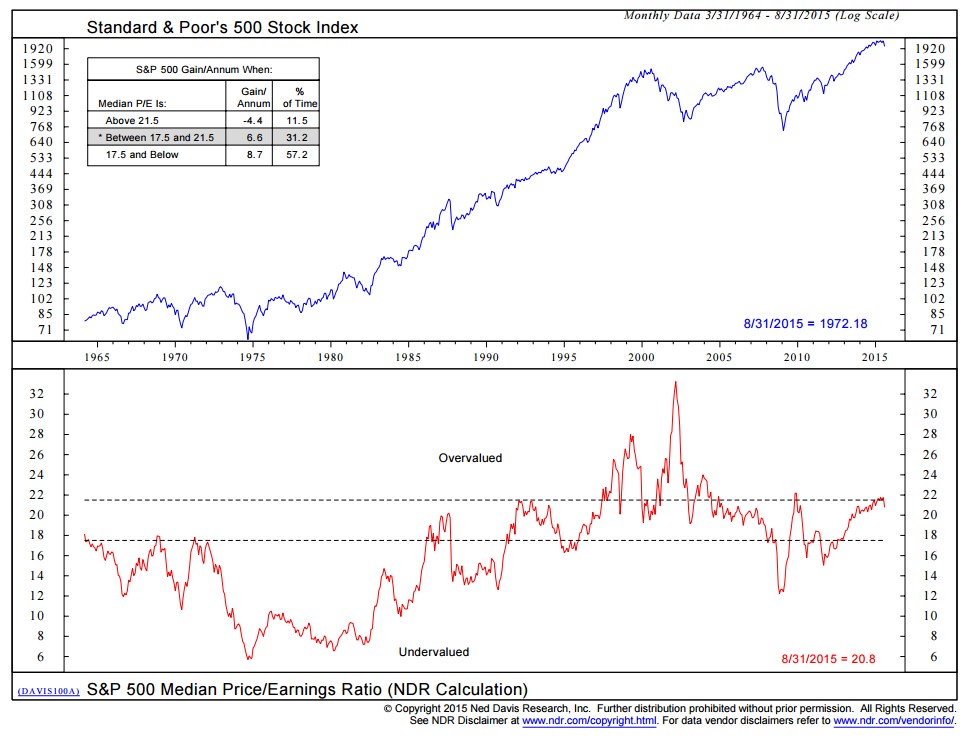
Valuations remain bearish. Stock market valuations remain elevated, although the August decline in stocks has relieved some of the pressure. Further consolidation from a price perspective and/or improved earnings growth (seemingly the more challenging of the two) could provide further relief. We do not need to see historically undervalued levels to get more constructive on valuations, but moving further from overvalued territory would be helpful.
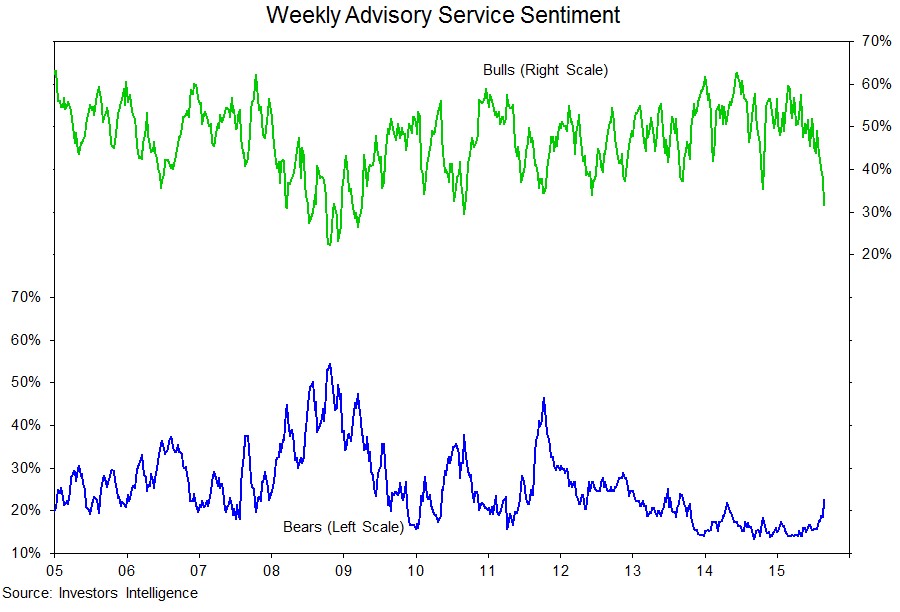
Investor Sentiment is neutral. We continue to rate sentiment as neutral, but are encouraged by the increase in skepticism we have seen in recent weeks and months. The latest reading from Investors Intelligence shows the fewest bulls since 2010 and a continued contraction in the spread between bulls and bears. Bears, however, remain at relatively low levels. A further rise in pessimism (similar to what was seen in 2011) and a buildup in investor liquidity could provide evidence that the crowd has turned sufficiently bearish that it is time to tilt in the other direction.
Source: Investors Intelligence
Source: StockCharts
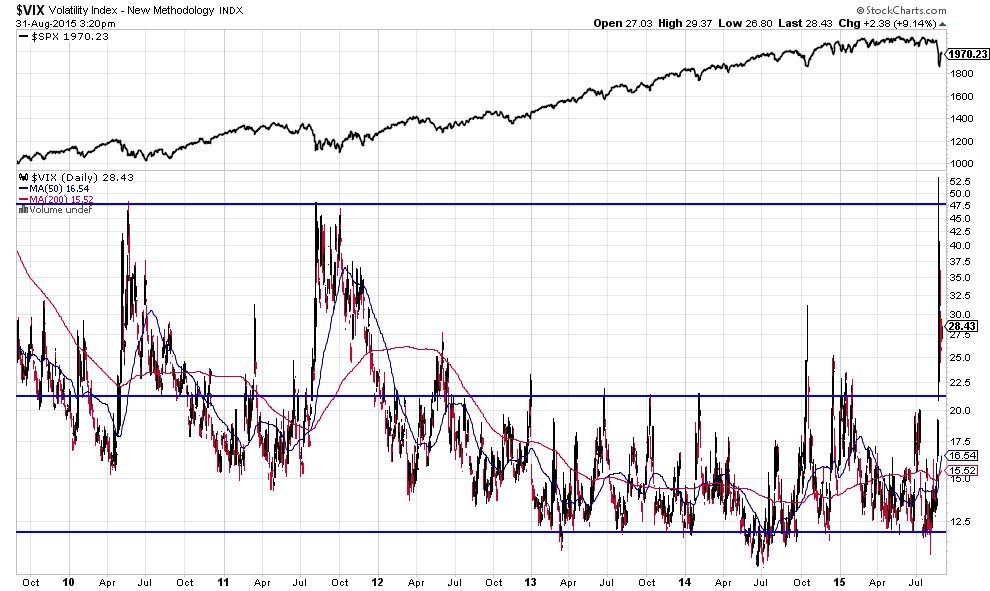
We did finally see some evidence of fear and panic on the part of investors. During the August swoon, the VIX index broke out to levels not seen since 2010 and 2011. The concern from our perspective is that skepticism will be short-lived and investors will immediately turn more hopeful (and less fearful) as stocks stabilize. Fund flow data show this may be happening, as equity inflows surged in late August. A more constructive outcome would be a consolidation in stocks that allows investor concerns to remain elevated, as this could help build the basis of a sustainable low from which the next cyclical rally could emerge.
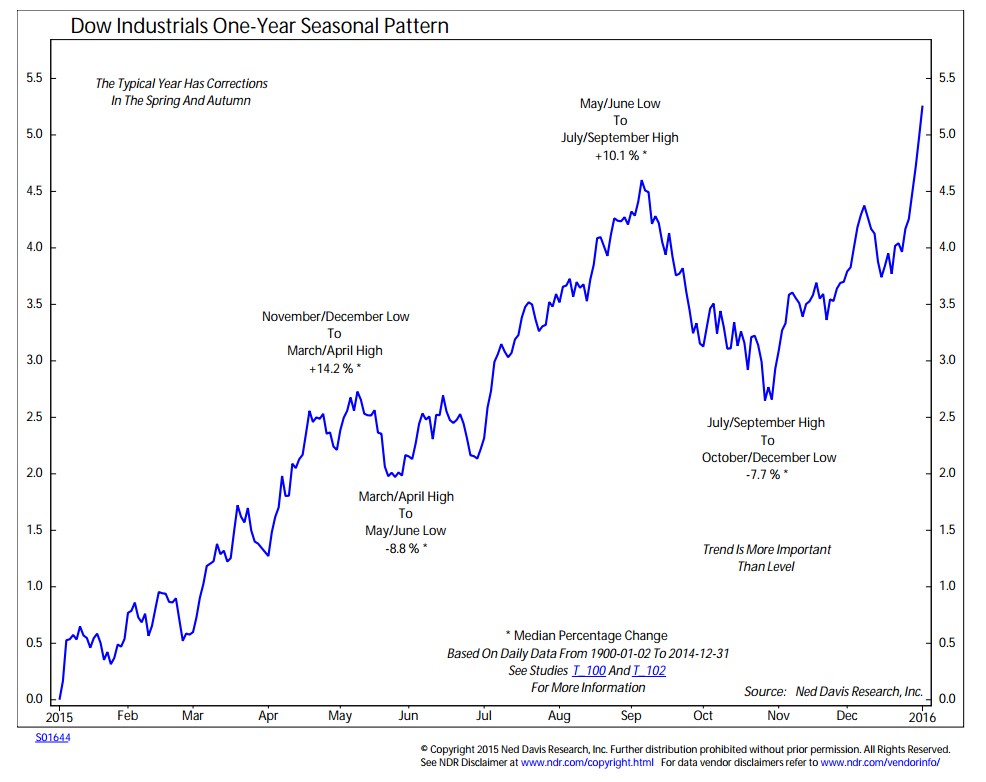
Seasonal patterns are neutral. September has a well-deserved history of being a tough month for stocks, but the severity of the August decline could take some of this sting away. Either way, the fourth quarter typically belongs to the bulls, and the re-emergence of seasonal tailwinds in the fourth quarter could help turn the weight of the evidence in a more bullish direction.
Source: Ned Davis Research
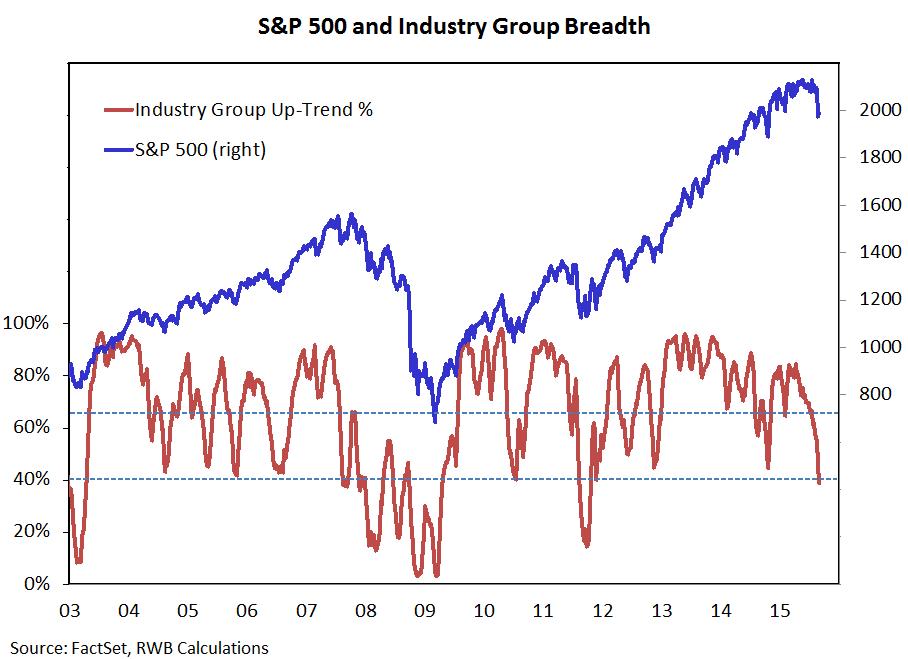
Breadth has turned bearish. While the percent of industry groups in up-trends bounced off of the October lows, the improvement fell short of making a higher high. 2015 has been marked by a steady deterioration in rally participation, a trend that accelerated to the downside over the course of the summer. Now, just 38% of groups are in up-trends, the smallest percentage since 2011. To gain confidence that the correction has run its course, we need to see sustained improvement in this indicator.
We can see a similar deterioration in breadth when looking at the number of S&P 500 stocks trading above their 50-day averages (the second clip in the chart to the right) or the expansion in the number of new lows (bottom clip). The late August panic lows may well mark extreme readings in these indicators. The opportunity for bullish breadth divergences would come if the S&P 500 re-tests its lows, but these make a series of higher lows. If that emerges, the case for a year-end rally would be enhanced.
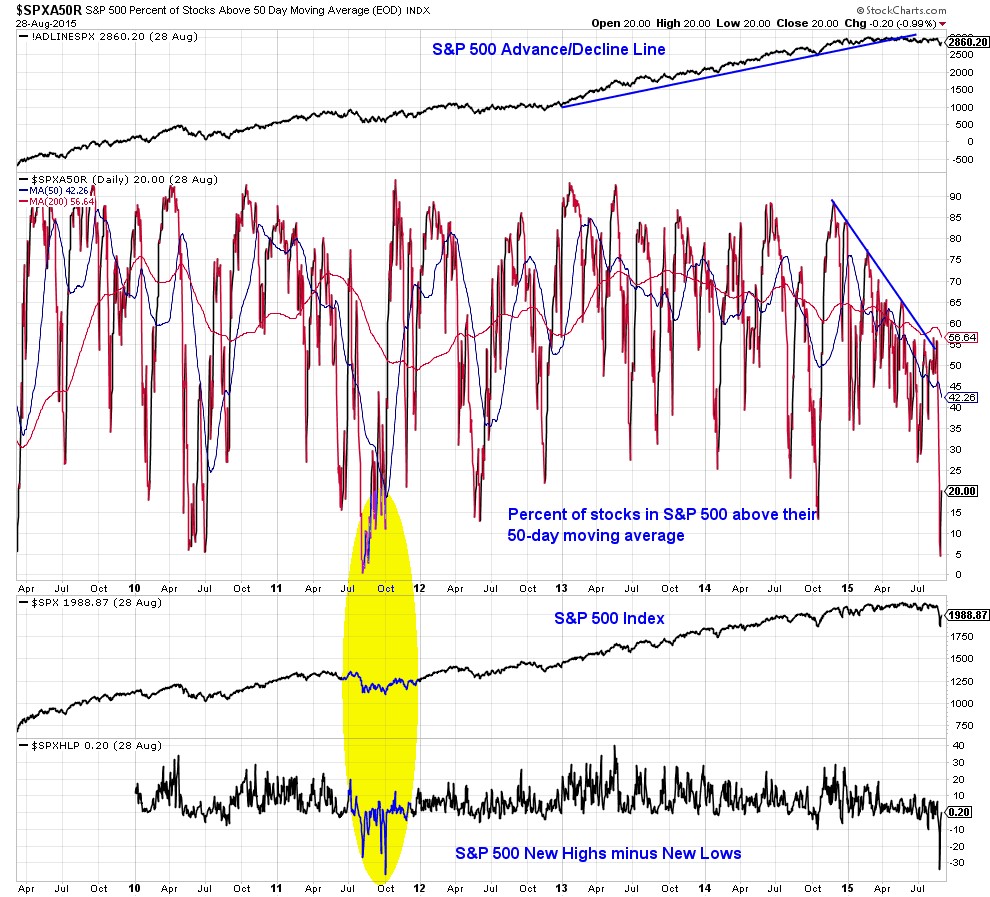
Source: StockCharts
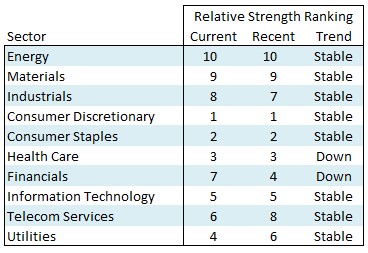
Source: Baird
Sector-level leadership on a year-to-date basis remains with Consumer Discretionary and Health Care (the only two sectors, as of this writing, that are still in positive territory for 2015). Within our relative strength rankings, we have seen some deterioration out of the Health Care sector (cooling trends in Biotech could be a headwind). Now, the consumer sectors (Discretionary and Staples) have moved into relative leadership positions.
Volatility in Materials and Energy has increased, but we would continue to steer clear of those areas. There is little evidence that sustainable positive trends are emerging in those sectors.
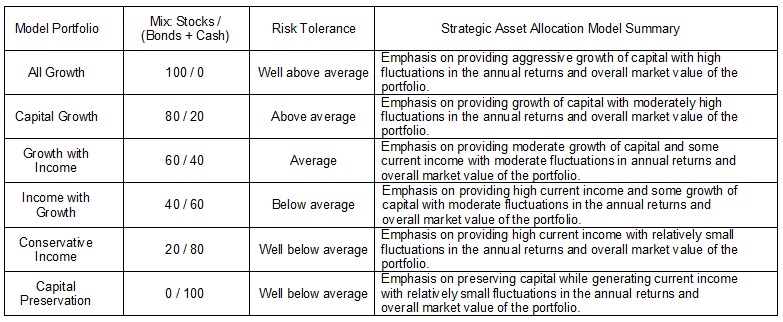
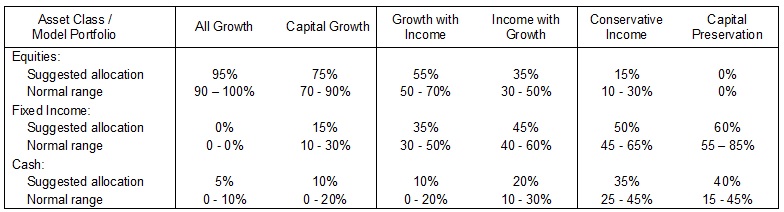
BAIRD STRATEGIC ASSET ALLOCATION MODEL PORTFOLIOS
Baird offers six strategic asset allocation model portfolios for consideration (see table below), four of which have a mix of equity and fixed income. An individual’s personal situation, preferences and objectives may suggest an allocation more suitable than those shown below. Please consult a Baird Financial Advisor in determining an asset allocation that will meet your needs.
Baird’s Investment Policy Committee offers a view of potential tactical allocations amongst equity, fixed income and cash, based upon a consideration of U.S. Federal Reserve policy, underlying U.S. economic fundamentals, investor sentiment, valuations, seasonal trends, and broad market trends. As conditions change, the Investment Policy Committee adjusts the weightings. The table below shows both the normal range and current recommended allocation to stocks, bonds and cash. Please consult a Baird Financial Advisor in determining if an adjustment to your strategic asset allocation is appropriate in your situation.
ROBERT W. BAIRD’S INVESTMENT POLICY COMMITTEE
Bruce A. Bittles Managing Director Chief Investment Strategist
Kathy Blake Carey, CFA Director Associate Director of PWM Research
Patrick J. Cronin, CFA, CAIA Director Institutional Consulting
William A. Delwiche, CMT, CFA Director Investment Strategist
Craig Elder Director PWM – Fixed Income Analyst
Jon A. Langenfeld, CFA Managing Director Head of Global Equities
Warren D. Pierson, CFA Managing Director Baird Advisors, Sr. PM
Jay E. Schwister, CFA Managing Director Baird Advisors, Sr. PM
Timothy M. Steffen, CPA, CFP® Director Director of Financial Planning
Laura K. Thurow, CFA Managing Director Co-Director of PWM Research, Prod & Svcs
Appendix – Important Disclosures
Disclaimers
This is not a complete analysis of every material fact regarding any company, industry or security. The opinions expressed here reflect our judgment at this date and are subject to change. The information has been obtained from sources we consider to be reliable, but we cannot guarantee the accuracy.
Foreign and emerging market securities may be exposed to additional risks including currency fluctuation, political instability, foreign taxes and regulations and the potential for illiquid markets. Historically, small and mid-cap stocks have carried greater risk and have been more volatile than stocks of larger, more established companies.
ADDITIONAL INFORMATION ON COMPANIES MENTIONED HEREIN IS AVAILABLE UPON REQUEST.
The Dow Jones Industrial Average, S&P 500, S&P 400, MSCI EAFE, Lehman U.S. Aggregate Benchmark, Lehman Municipal Bond Benchmark, Russell 1000, Russell Mid Cap, Russell 2000, and Russell 3000 are unmanaged common stock indices used to measure and report performance of various sectors of the stock market; direct investment in indices is not available.
Baird is exempt from the requirement to hold an Australian financial services license. Baird is regulated by the United States Securities and Exchange Commission, FINRA, and various other self-regulatory organizations and those laws and regulations may differ from Australian laws. This report has been prepared in accordance with the laws and regulations governing United States broker-dealers and not Australian laws.
Copyright 2015 Robert W. Baird & Co. Incorporated.
Other Disclosures
UK disclosure requirements for the purpose of distributing this research into the UK and other countries for which Robert W Baird Limited holds an ISD passport.
This report is for distribution into the United Kingdom only to persons who fall within Article 19 or Article 49(2) of the Financial Services and Markets Act 2000 (financial promotion) order 2001 being persons who are investment professionals and may not be distributed to private clients. Issued in the United Kingdom by Robert W. Baird Limited, which has an office at Finsbury Circus House, 15 Finsbury Circus, London EC2M 7EB, and is a company authorized and regulated by the Financial Conduct Authority. For the purposes of the Financial Conduct Authority requirements, this investment research report is classified as objective.
Robert W Baird Limited ("RWBL") is exempt from the requirement to hold an Australian financial services license. RWBL is regulated by the Financial Conduct Authority ("FCA") under UK laws and those laws may differ from Australian laws. This document has been prepared in accordance with FCA requirements and not Australian laws.


