This weekend was my summer vacation, when I (try) to completely unplug from news, internet and other variety of my daily routine. I was pretty successful at the task, although I did keep up with general events thanks to CNN. With the exception of China’s devaluation, there was little meaningful economic news, making my catch-up column a bit easier. But perhaps more importantly, when I returned I was struck just how little things had really changed in a 7 day period. It reminds me why I like being a medium to long-term analyst; daily and weekly fluctuations are less important than the longer macro trends that develop over months and even years. For those of you who trade the currency markets on a short-term basis, more power to you. But for me, the long term is “where it’s at.”
Obviously, the Chinese devaluation was the big news event last week. Today, I'll take a deeper look at China to place that move in historical context. Let’s begin with two simple data points: China has the world’s largest population and the Chinese government wants to remain in power. In correlation, the large population means it would be moderately easy to overthrow the government simply through the law of large numbers; half a billion people can overwhelm any standing army through sheer mass. Therefore, the government has to deliver sustained performance.
They have been successful on that point:
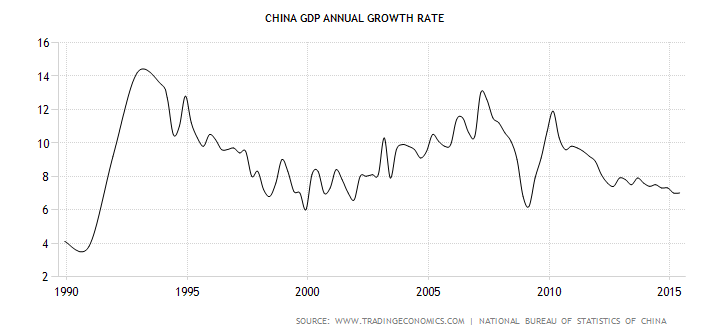
Starting in the early 1990s, Chinese annual GDP growth increased to 14%, slowing down to the 6%-8% range by the end of the 1990s. Annual growth again accelerated to 13% by 2007, dropped thanks to the global recession, then trended lower to the current 7% pace. Here is a chart of the last 10 years:
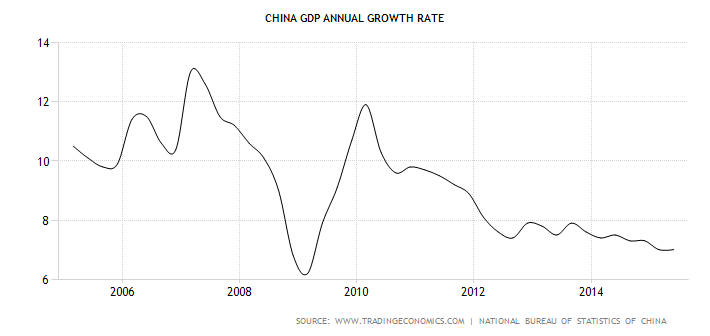
Since the end of 2012, it appears 7%-8% annual growth is the new normal, which potentially creates several problems. First, growth may be too slow; internal dissatisfaction with this slower pace of growth may lead to political unrest. This observation has no magical formula; we can’t say with any definitive authority that growth below x% will lead to unrest. It is safe to apply a sliding scale, where lower growth is inherently risker than faster. But also remember China now has a burgeoning middle class who want to keep what they’ve earned. These people operate to put a break on the potential for internal strife.
Second, the cost of the post 2007 growth has been high, especially in terms of debt:
Fueled by real estate and shadow banking, China’s total debt has nearly quadrupled, rising to $28 trillion by mid-2014, from $7 trillion in 2007. At 282 percent of GDP, China’s debt as a share of GDP, while manageable, is larger than that of the United States or Germany. Three developments are potentially worrisome: half of all loans are linked, directly or indirectly, to China’s overheated real-estate market; unregulated shadow banking accounts for nearly half of new lending; and the debt of many local governments is probably unsustainable. However, MGI calculates that China’s government has the capacity to bail out the financial sector should a property-related debt crisis develop. The challenge will be to contain future debt increases and reduce the risks of such a crisis, without putting the brakes on economic growth.
Leverage increases earnings when the company/country is expanding, but can greatly slow earnings/growth when the country is slowing. As the country slows, it’s possible this debt level will become a huge anvil around the country’s neck. Also remember that recessions caused by deleveraging lead to inherently slower recoveries. Just ask any analyst who over-estimated US growth following the Great Recession.
In addition to the high overall debt level, China faces a second problem: at the macro level, the country is attempting to switch from a growth model based on manufacturing to one based on middle class consumption. The transition between the two has been anything but smooth. First, manufacturing has slowed down, as measured by a variety of statistics:
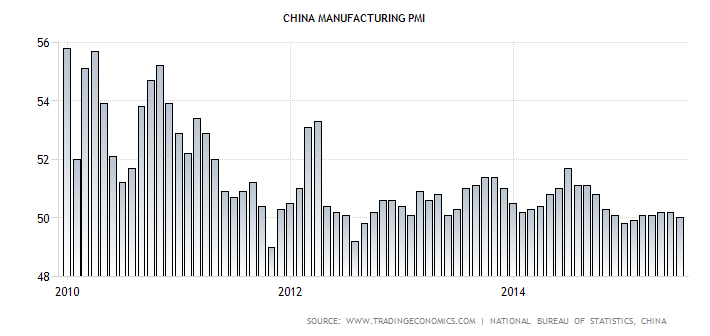
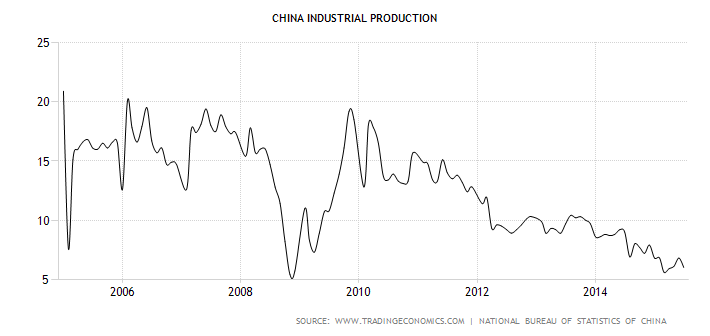
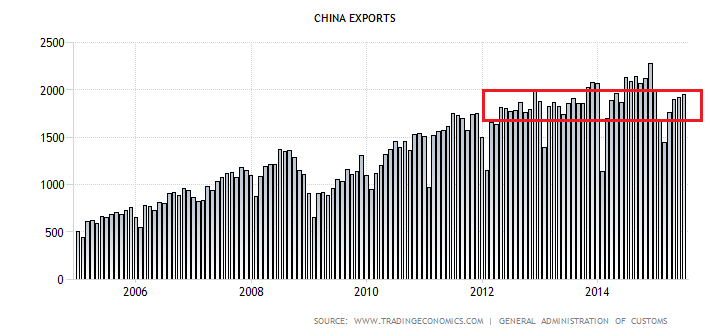
China’s manufacturing PMI (top chart) has printed slightly above 50 (the line between expansion and contraction) since early 2012. Although manufacturing is still growing, it is just barely doing so. Industrial production (middle chart), is in a clear downward trend. Exports (bottom chart) have more or less leveled off since mid-2012, with the exception of a few spikes at the end of last year. The combined analysis of these charts is that China’s industrial juggernaut – which has come to manufacture most easily mass produced products – is hitting choppier waters. A big underlying reason is the increase in the yuan:
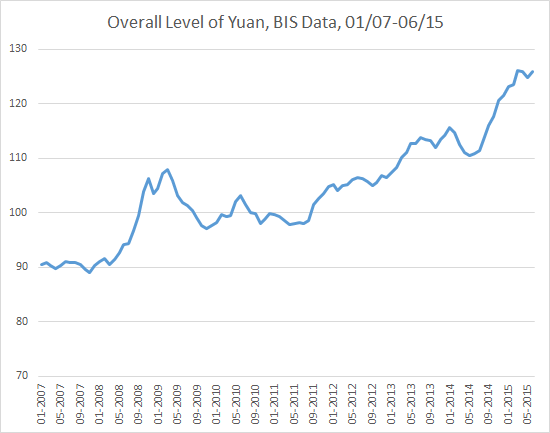
The above chart is from the Bank for International Settlements, and clearly shows China’s currency has increased ~25% since 3Q11. This chart and the above indicators go a long way to explaining why China devalued their currency earlier this week.
The devaluation, however, is only a temporary fix. The yuan will naturally appreciate due to China’s economic growth. No single devaluation can halt that overall trend, making this move a holding pattern move, nothing more. Adding fuel to the industrial slowdown is the increasing cost of producing goods in China, leading many producers to move at least some of their facilities to other Southeast Asian economies. In short, the Genie is out of the Chinese bottle. This week’s move is the Chinese equivalent of the little Dutch boy placing his finger in the economic dike.