KEY TAKEAWAYS
- The declining labor force participation rate continues to receive attention from the media and the public, although largely ignored by the markets.
- We continue to expect the U.S. economy could potentially create between 225,000 and 250,000 net new jobs per month in 2015.
- Labor force growth plus productivity growth are important indicators for long-term economic growth.
All eyes are on jobs this week. The U.S. Department of Labor’s July Employment Situation report (due August 7, 2015) will likely show that the U.S. economy created 225,000 jobs in July 2015, close to the average job creation over the past 12 months (245,000) according to the consensus of economists polled by Bloomberg News. The report will also likely show that the unemployment rate remained at 5.3% in July, according to the consensus. The other key piece of information in the July employment report is the reading on average hourly earnings (AHE), a timely but not very comprehensive read on labor costs, which is key to the Fed’s decision on interest rates. The consensus expects a 2.3% year-over-year increase in AHE in July, up from 2.0% in June [Figure 1].
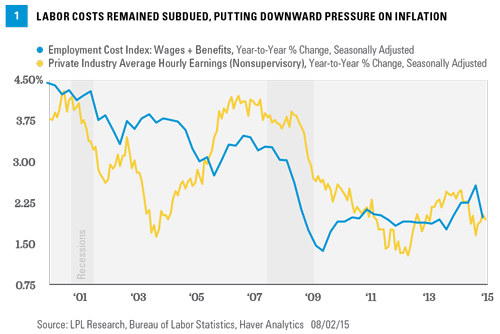
The July AHE reading will likely to take on even greater significance for market participants and the Fed given the weak (2.0% year over year in the second quarter) reading on the most comprehensive measure of labor costs, the Employment Cost Index (ECI) [Figure 1]. That report, released Friday, July 31, 2015, was expected to show acceleration in ECI, building on the 2.2% year-over-year reading in the fourth quarter of 2014 and the 2.6% reading in the first quarter of 2015. Instead, the ECI in the second quarter decelerated sharply, pushing the market’s expectation for the first Federal Reserve (Fed) rate hike out to January 2016. We continue to expect the Fed to hike rates in late 2015. While the starting point for the Fed’s first rate hike in nine years is important and is likely to usher in some volatility in financial markets, how far and how fast the Fed raises rates is more important. Specifically, how the gap closes between the market’s belief about the endpoint for the federal funds rate in this cycle (1.75%) and what the Fed says its end point will be (3.75%) is crucial. (See the Midyear Outlook 2015: Some Assembly Required publication for more details.)
CLOSER LOOK: PARTICIPATION RATE
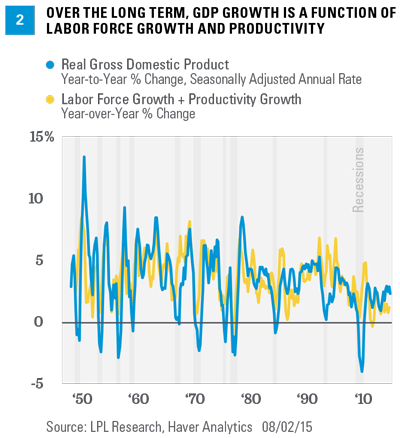
During the first few years of the current economic expansion, which began in mid-2009, there was a lot of discussion about the labor force participation rate and more recently, the weak U.S. productivity growth in the recovery. While it may not be obvious at first, the two are related. Over the long run, an economy’s inflation adjusted, or real, growth rate is dictated by labor force growth plus productivity growth [Figure 2]. Productivity growth has been stagnant since the start of this expansion in 2009, averaging just 1.0%, well below the growth rate seen in the 1990s (2.2%) and the pre-Great Recession 2000s (2.3%). We suspect that difficulty in measuring the impact of technology on productivity and the rapid increase in the share of the economy that is “knowledge based” (aka, good old American know-how) may be distorting and perhaps even understating overall productivity. The reasons for the weak growth in the labor force recently, especially its key driver, the decline in the labor force participation rate, is better understood and easier to explain.
For years, the labor force participation rate has been an afterthought in the monthly employment report and received little attention from the market, the media, the public, or pundits. While the market continues to largely ignore the number, it receives a great deal of attention each month from the other groups noted above. The participation rate (62.6% in June 2015) is calculated by dividing the labor force (157 million in June 2015) by the civilian population over the age of 16 (250.7 million in June 2015). This metric ran up sharply between the early 1960s (58%) and early 1990s (66%). According to the nonpartisan Congressional Budget Office (CBO), the large increase in the participation rate from the 1960s to 2000 was mostly the result of the increasing number of women in the labor force. The participation rate among women aged 20 and over, around 37% in the early 1960s, had risen to just over 60% by the mid-1990s, but has fallen to just under 57% today. The overall participation rate plateaued in the 1990s, peaked at just over 65% in the early 2000s, and has been falling ever since [Figure 3].
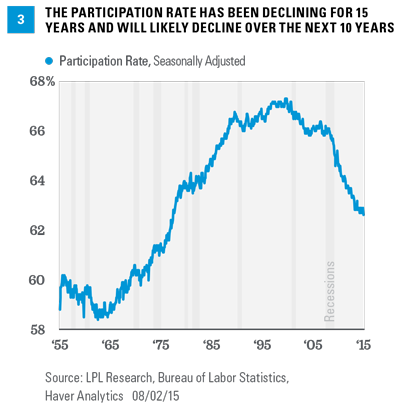
The CBO’s projection of the labor force participation rate in 2025 — approximately 61% — is about 1 percentage point lower than the rate that it projects for 2020 and 5.25 percentage points lower than that rate at the end of 2007. Most of the projected decline between 2007 and 2025 can be attributed to long-term trends, especially the aging of the population, according to CBO estimates. The remainder stems from the reduction in some people’s incentive to work resulting from the Affordable Care Act (ACA), the structure of the tax code, and the permanent withdrawal of some workers from the labor force in response to the recession and slow recovery.
More recently, demographic trends and the unusual nature of this recovery account for the 3-percentage-point drop in the participation rate since 2007, with the aging population accounting for half of the drop. The oldest Baby Boomers began turning 65 in 2011. The participation rate of people 65 and above is less than 20%; therefore, as a greater portion of the population turns 65, the participation rate will continue to decline. Indeed, the CBO projects the participation rate will continue to decline over the next 10 years (albeit at a slower pace than over the past few years) and hit 61% by 2025.
CLOSER LOOK: LABOR MARKET SURVEYS
A survey of 60,000 households nationwide — an incredibly large sample size for a national survey — generates the data set used to calculate the unemployment rate, the size of the labor force, part-time and full-time employment, the reasons for and duration of unemployment, and employment status by age, educational attainment, and race. The “household survey” has been conducted essentially the same way since 1940, and although it has been “modified” over the years, the basic framework of the data set has stayed the same. The last major modification to the data set (and to how the data are collected) came in 1994. To put a sample size of 60,000 households into perspective, nationwide polling firms typically poll around 1,000 people for their opinion on presidential races.
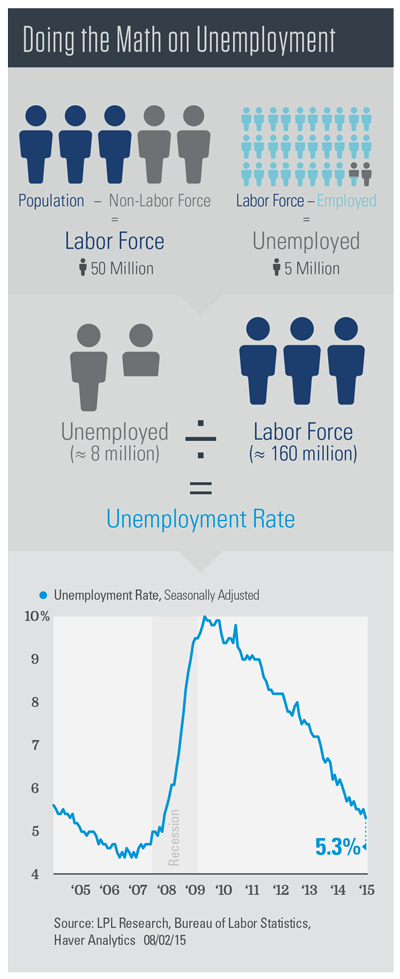
The headline unemployment rate is calculated by dividing the number of unemployed by the number of people in the labor force. People are identified as being part of the labor force if they are over 16, have a job (employed), or do not have a job (unemployed) but are actively looking for work. They are not in the labor force if they are neither employed nor unemployed. This category includes retired persons, students, those taking care of children or other family members, and others who are neither working nor seeking work. See the infographic, “Doing the Math on Unemployment,” for a breakdown of the unemployment rate.
The payroll job count data are culled from a survey of 440,000 business establishments across the country. The sample includes about 141,000 businesses and government agencies, which covers approximately 486,000 individual worksites drawn from a sampling frame of Unemployment Insurance (UI) tax accounts covering roughly 9 million establishments. The sample includes approximately one-third of all nonfarm payroll employees. From these data, a large number of employment, hours, and earnings series in considerable industry and geographic detail are prepared and published each month.
THE WEEK AHEAD
This week (August 3 – 7, 2015) is a busy one for U.S. economic indicators as market participants digest last week’s report on gross domestic product (GDP) for the second quarter of 2015 (which included revisions back to 2012) and the latest statement from the Fed’s Federal Open Market Committee (FOMC), released on Wednesday, July 29. Although reports on vehicle sales and the Institute for Supply Management’s (ISM) Manufacturing Index for July will garner plenty of attention, the key report will be the July Employment Situation report, due out on Friday, August 7, 2015.
IMPORTANT DISCLOSURES
The opinions voiced in this material are for general information only and are not intended to provide or be construed as providing specific investment advice or recommendations for your clients. Any economic forecasts set forth in the presentation may not develop as predicted and there can be no guarantee that strategies promoted will be successful.
DEFINITIONS
The monthly jobs report (known as the employment situation report) is a set of labor market indicators based on two separate surveys distributed in one monthly report by the U.S. Bureau of Labor Statistics (BLS). The report includes the unemployment rate, nonfarm payroll employment, the average number of hours per week worked in the nonfarm sector, and the average basic hourly rate for major industries
The Bureau of Labor Statistics’ (BLS) Employment Cost Index (ECI) is a quarterly release that gives information on the costs of labor for businesses in the United States.
The Institute for Supply Management (ISM) Index is based on surveys of more than 300 manufacturing firms by the Institute of Supply Management. The ISM Manufacturing Index monitors employment, production inventories, new orders, and supplier deliveries. A composite diffusion index is created that monitors conditions in national manufacturing based on the data from these surveys.


