US Equity and Economic Review For the Week of June 22-26; Getting Ready For a Move Higher? Edition
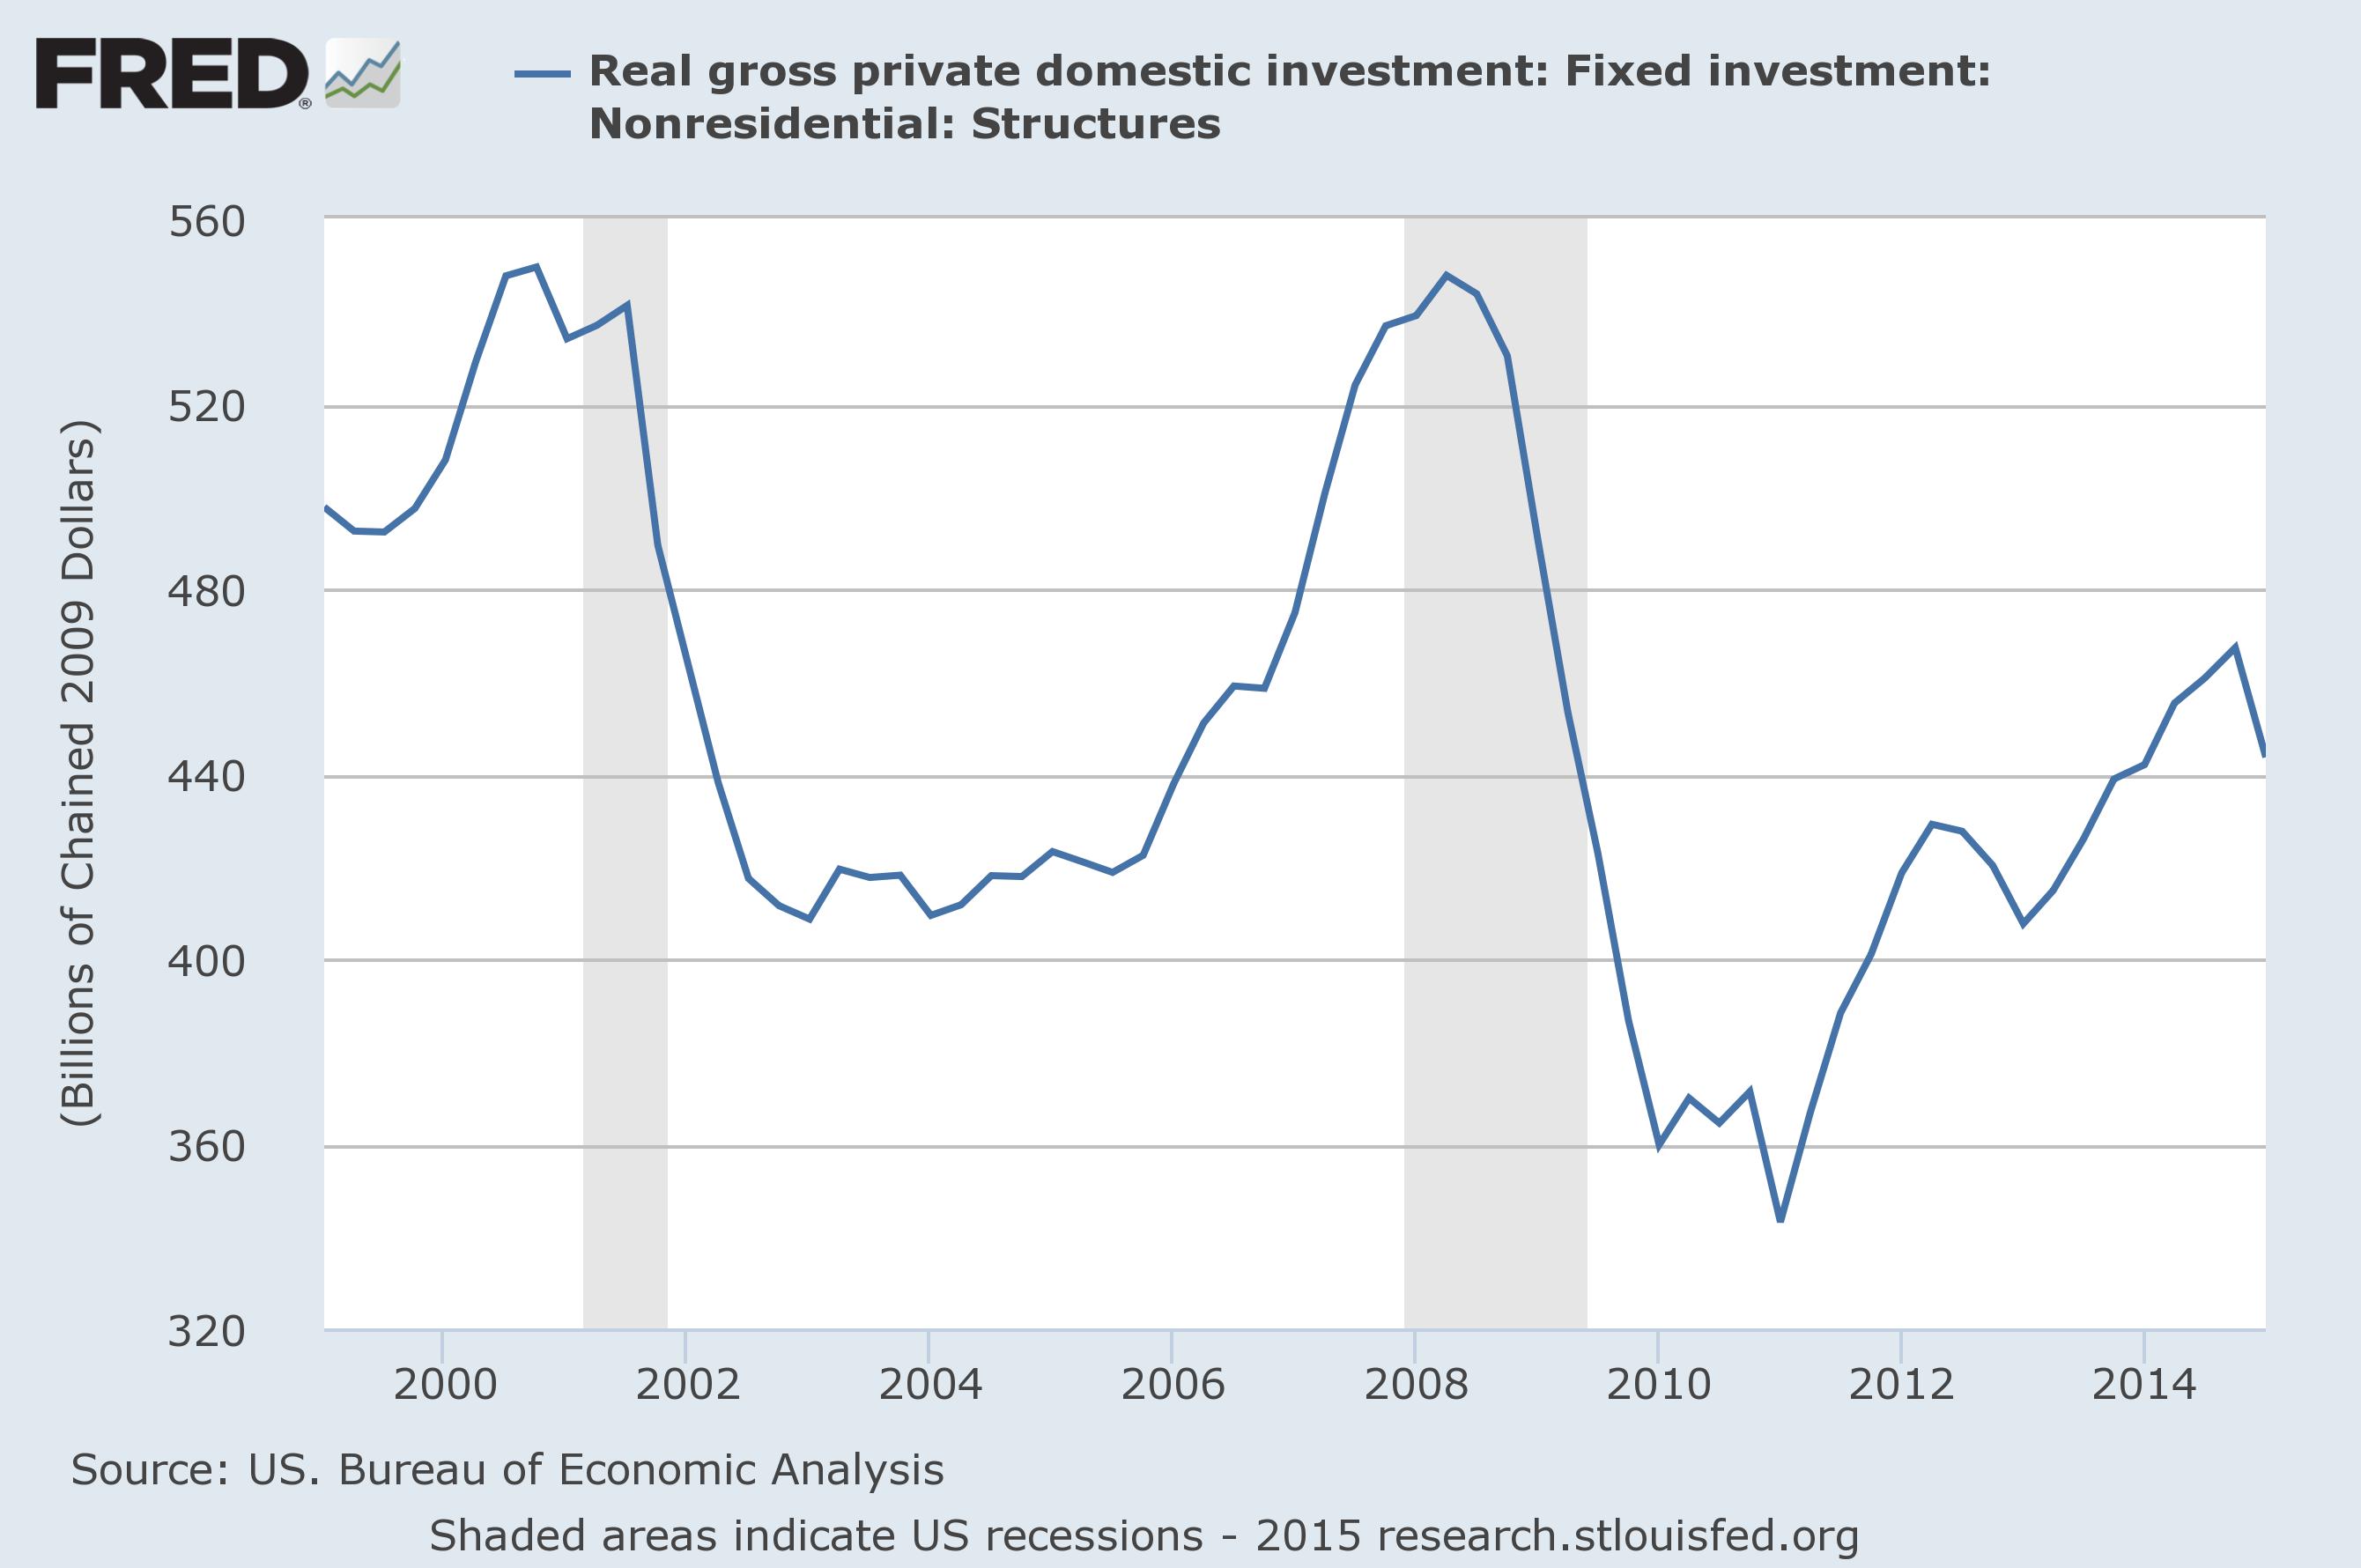
First quarter economic data was largely bearish, as confirmed by last week’s third revision to GDP data. While the .2% decrease was better than the -.7% in the second revision, it was still negative. There were three primary reasons for the drop: an 18% decrease in non-residential structures, an 11.6% decrease in goods exports and personal consumption expenditures (PCEs) that only increased 2.1% Q/Q compared to 4.4% in the 4Q14. The sharp drop in commercial real estate was largely weather related (who starts major projects in a blizzard?). We saw a similar decrease leading up to the drop in 1Q13:
In contrast, the decrease in exports was caused by the strong dollar, which is still at high levels:
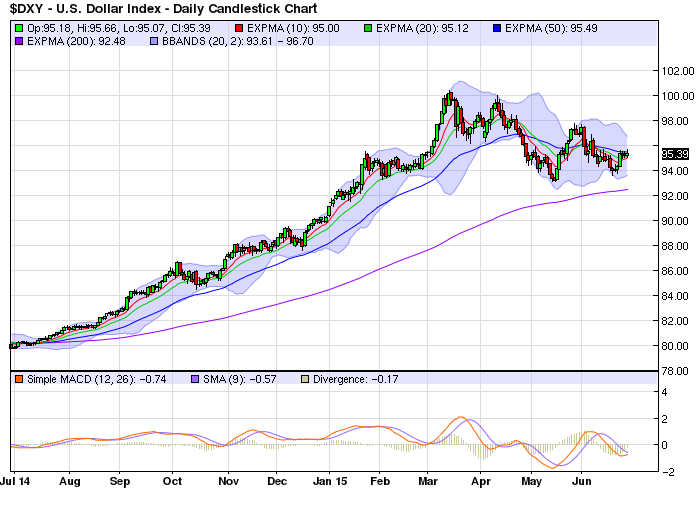
While the spring-time thaw should lead to a moderate non-residential investment rebound, the strong dollar will continue to hurt exports.
As for the consumer, recent data indicates he is spending again. The last retail sales data showed a 1.2% M/M increase (non-inflation adjusted). And this month’s personal income data was up .6% in real terms. This continues a five year streak of solidly increasing data along with disposible personal income gains:
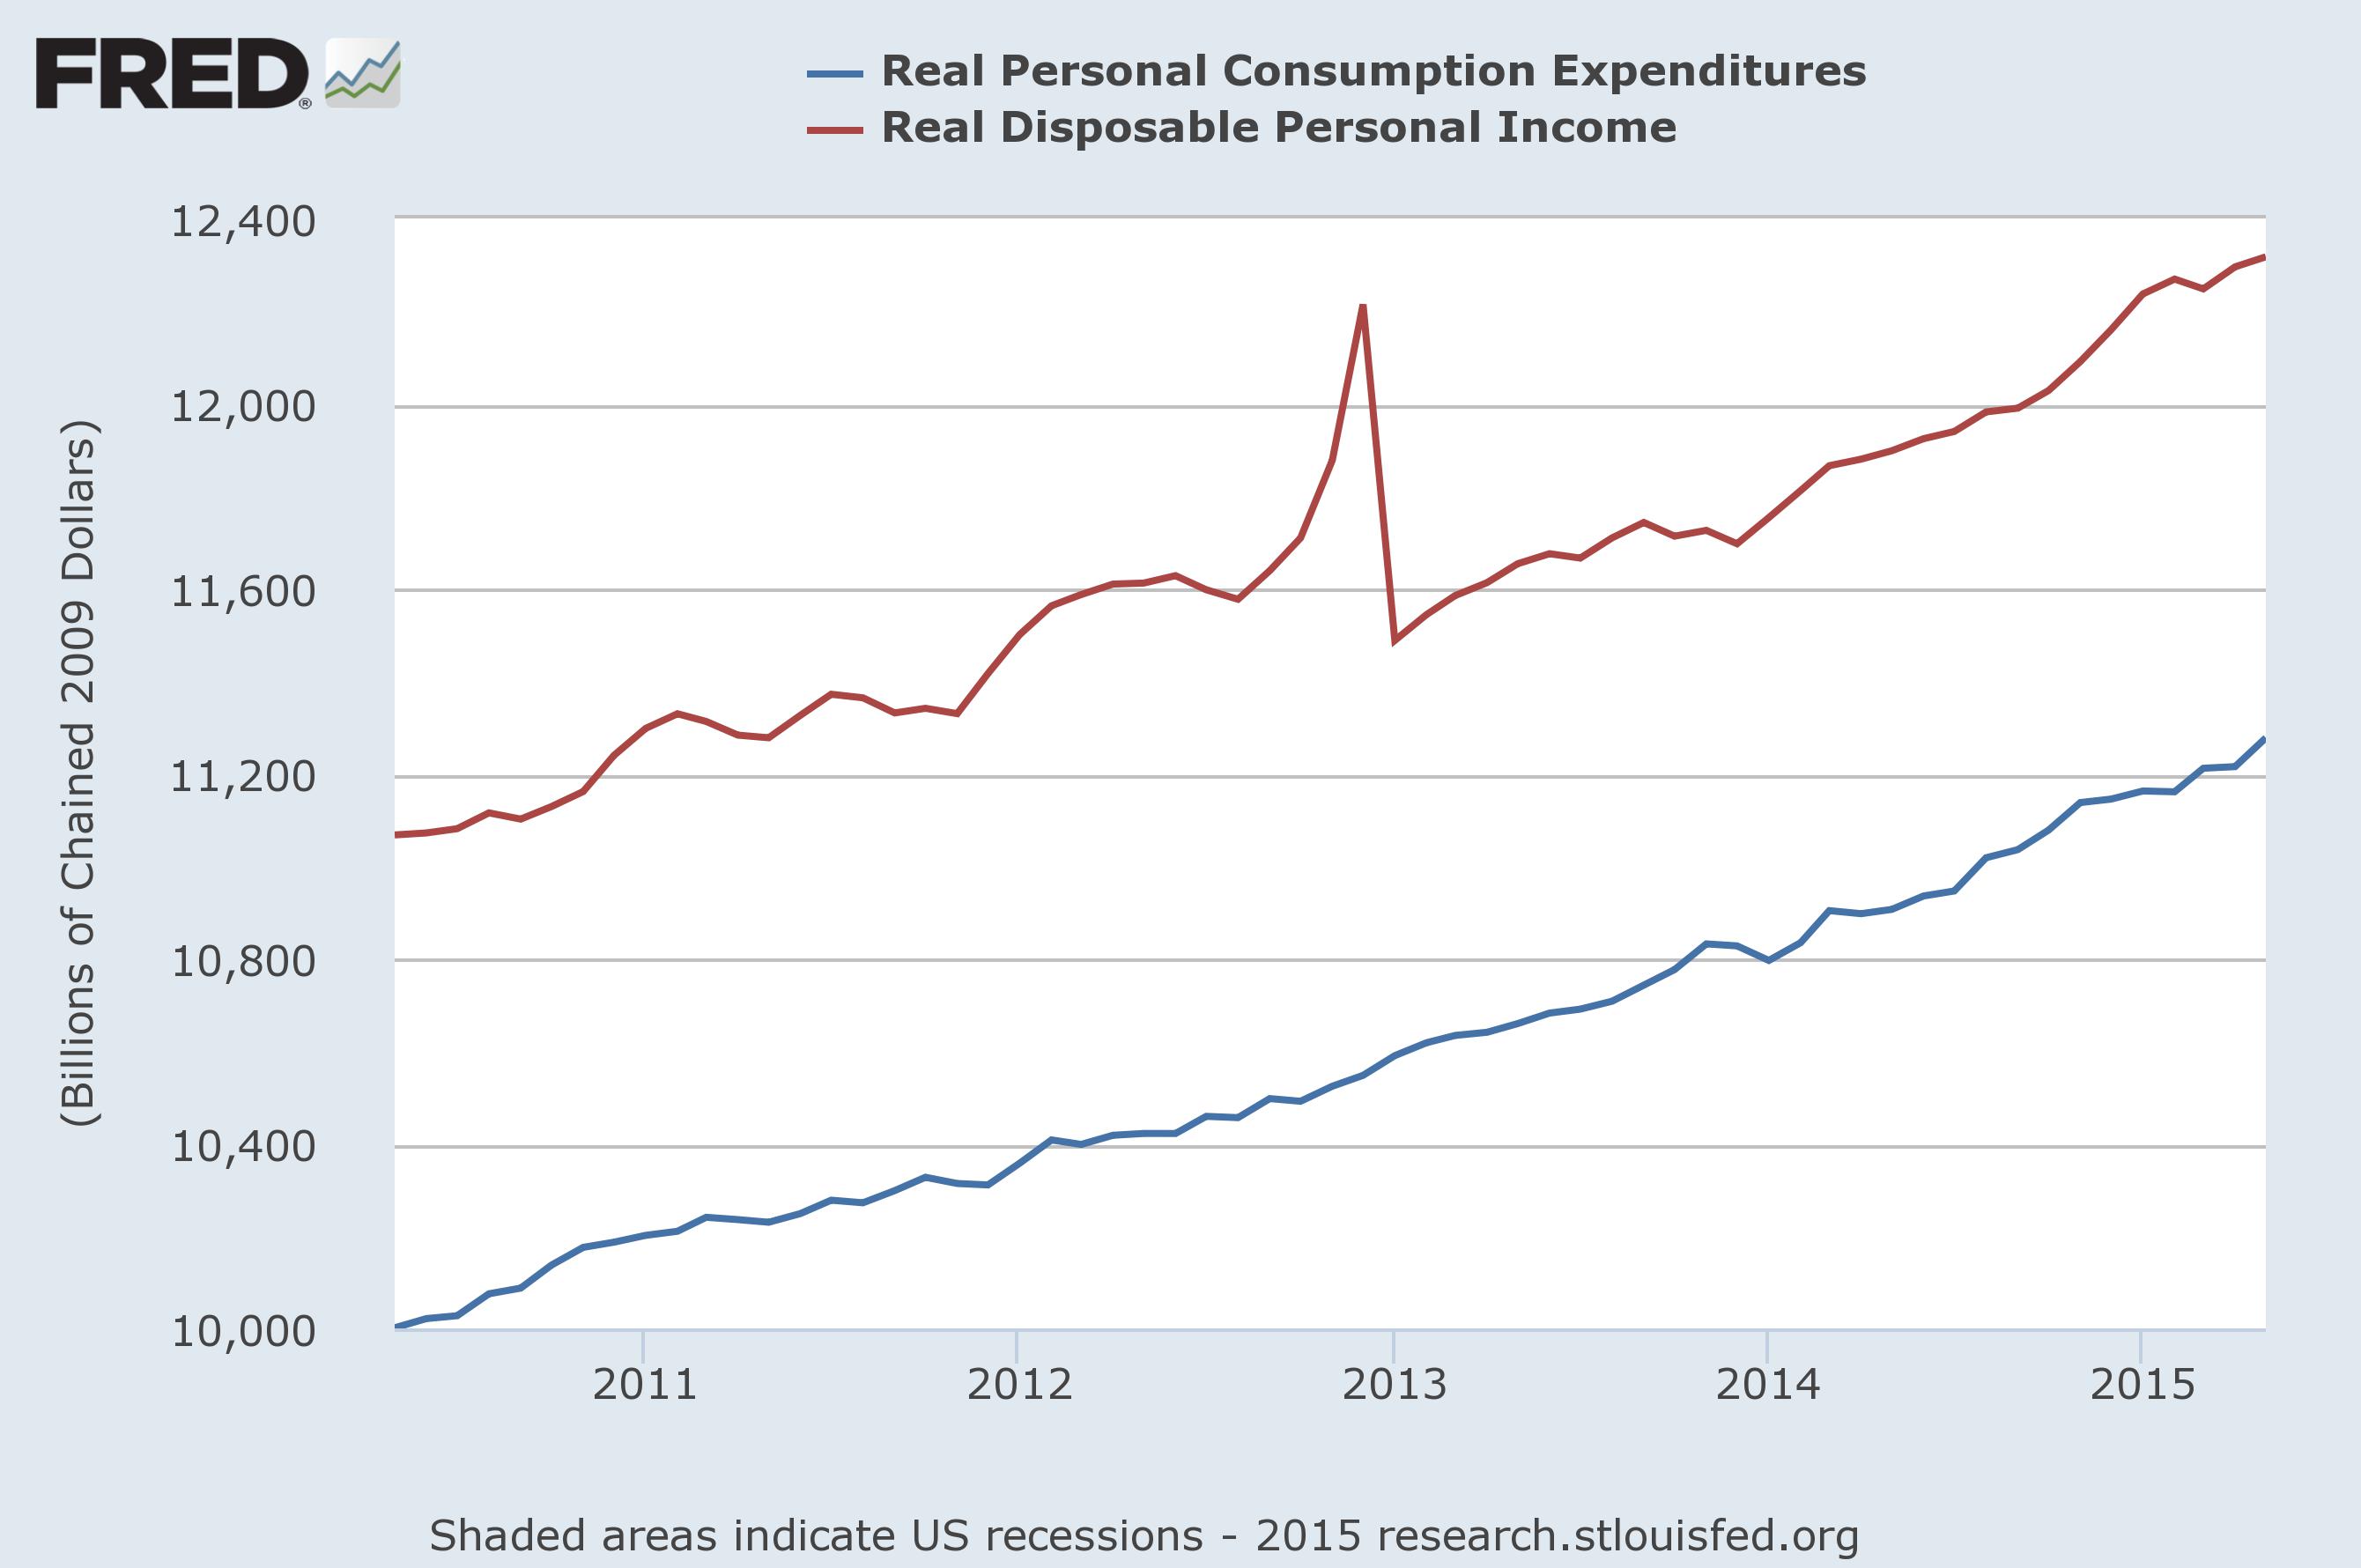
But the PCE data has been a bit dodgy since the beginning of the year, vacillating between strong and weak readings. Starting in January, the last five monthly increases have been .2%, 0%, .5%, 0% and .6%, respectively. The high savings rate (which currently stands at 5.1%) indicates consumers are still a bit more conservative, so another month or two of weak readings wouldn’t be out-of-place. Rounding out the positive news in the latest PCE report were the 2.2% M/M durable goods increase and .3% increase in real disposable personal income less transfer payments (a coincident indicator).
Housing continues to provide encouraging news. New home sales increased 2.2% to a seven year high, while existing home sales were up 5.1% to the highest reading since November 2009. This chart, which shows the seasonally adjusted annual rate of new and existing home sales on a base 100 chart, shows the overall trend:
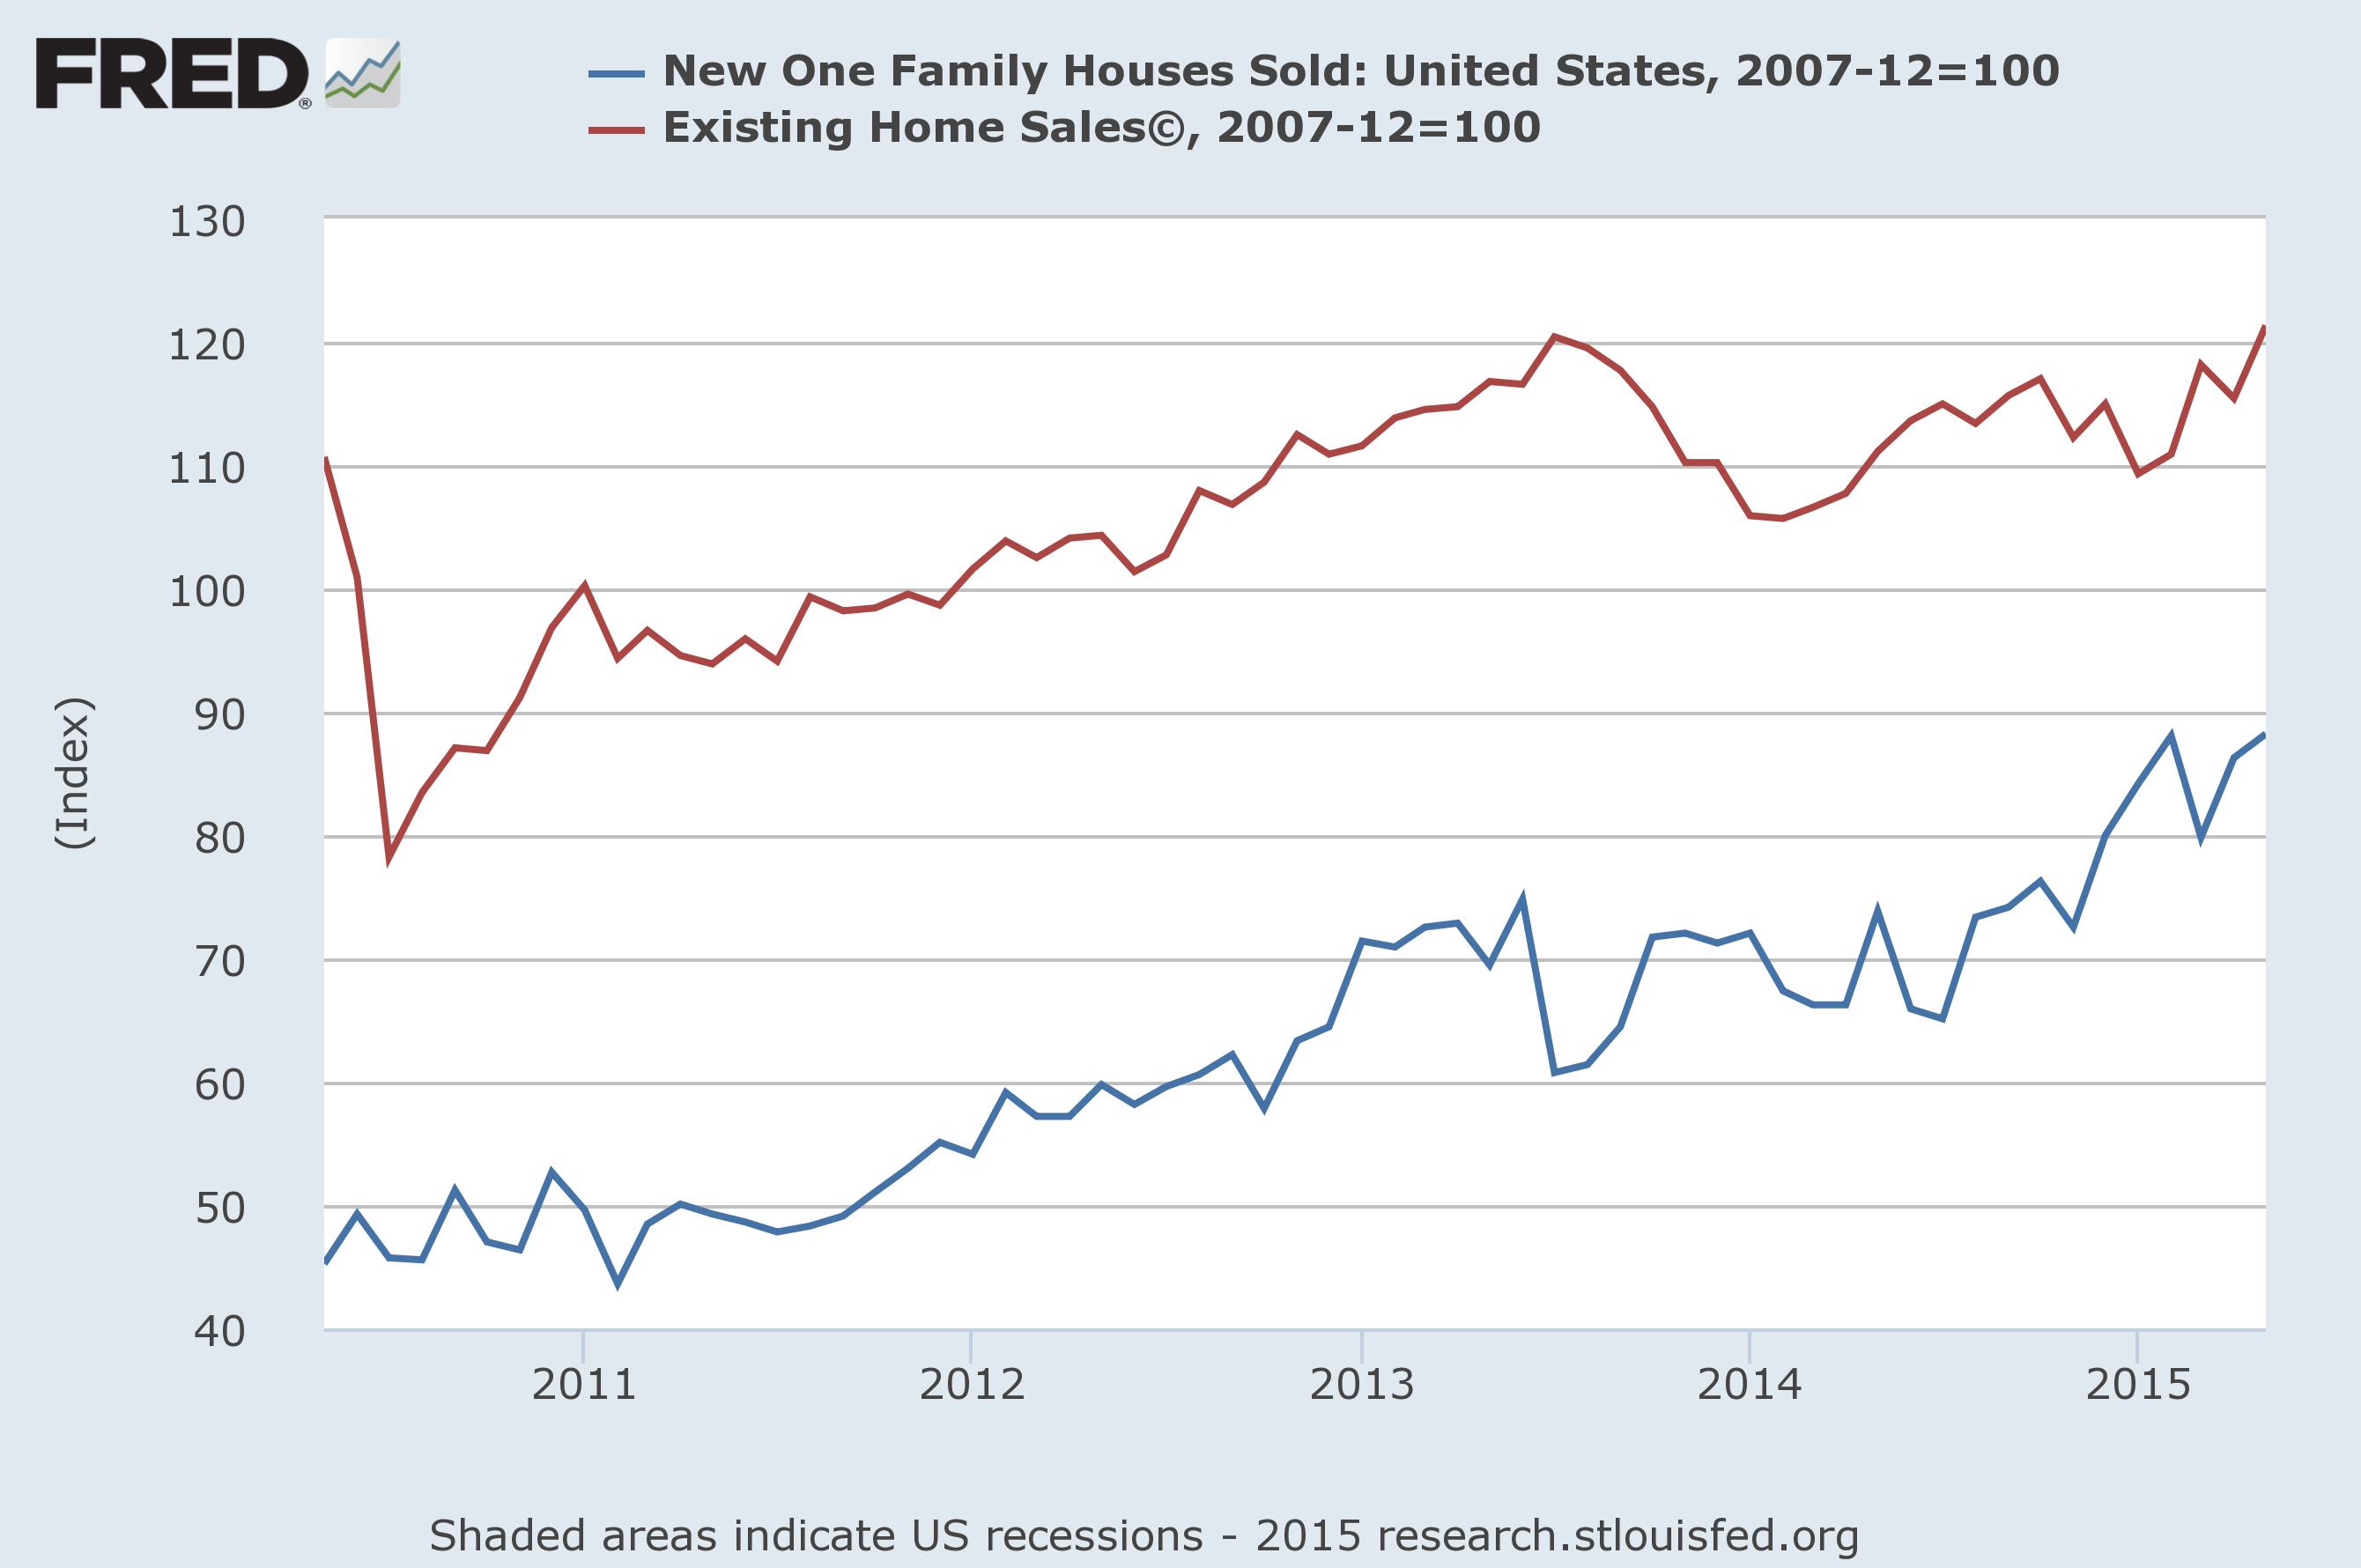
New homes sales started to increase in late 2014 to their current rate while existing home sales started their recent rise at the beginning of 2015. For a deeper analysis of recent homebuilding optimism, see this piece from Sober Look at the Markets and this from Marketwatch.com. Both paint a very positive picture going forward.
Durables goods, which contracted 1.8%, were the sole negative indicator this week. But, excluding transportation orders, the series increased .5%. As these two charts show, both series have been weak for the last 12 months, which explains the shallow industrial recession the manufacturing sector is experiencing:
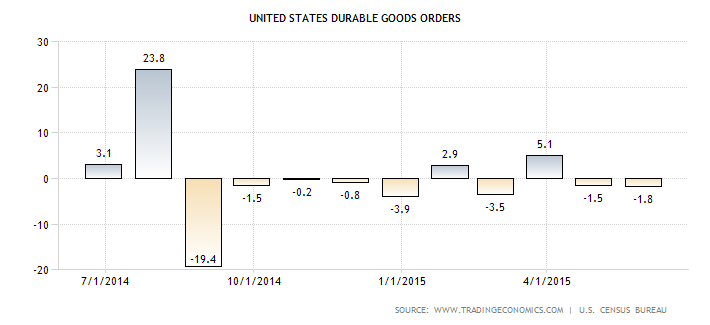
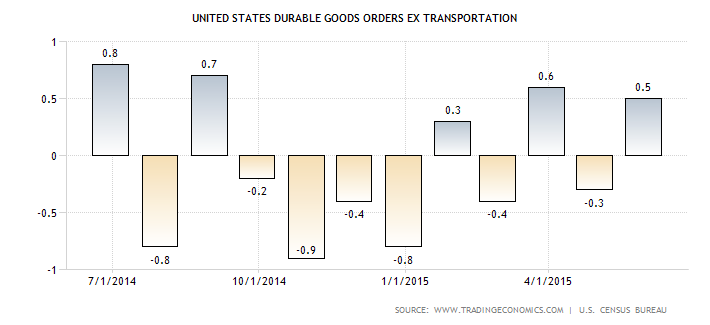
So long as the dollar remains strong and oil is around the $60/bbl level, expect this data to be weak.
This was the third week of solid domestic news, and it marks a turnaround from the weak 1Q data. This is how one analyst described the turnaround:
It appears the US economy is finally making a turn after a disappointing and negative first quarter. Recent data has been surprising to the upside and suggests along with leading economic indicators that the US economy will continue to expand and the risk of a recession remains low.This trend should persist well into the fall, which continues to put on the table the likelihood of our first Federal Reserve interest rate hike since 2006. When the Fed first raises is still a question mark that is likely to be an overhang on the market for the coming months and the ongoing Greek saga is likely to be a near-term market overhang.
And finally, as food for thought, consider this analysis from Dr. Ed regarding the potential remaining duration of this expansion:
The good news is that the average increase in the CEI following each of those recovery periods through the next peak was 18.6%, over an average period of 65 months within a range of 30-104 months. If we apply these averages to the current cycle, then the CEI would peak in 48 more months, during March 2019, with a substantial gain from here.
We can but hope.
The Markets
The best part of the economic news is that a growing economy increases the possibility of top-line revenue increases. This would help to provide the necessary earnings fuel for the larger averages, which are already very expensive and in need of top line revenue growth. But we still have a strong dollar, which is export and larger company negative. This combination of events is leading to a rally in small and micro-cap indexes but a stalling of the larger indexes (S&P 500). And adding to the concern for the largest sectors is the transports, which are near a six month low.
Let’s begin with the Russell 2000:
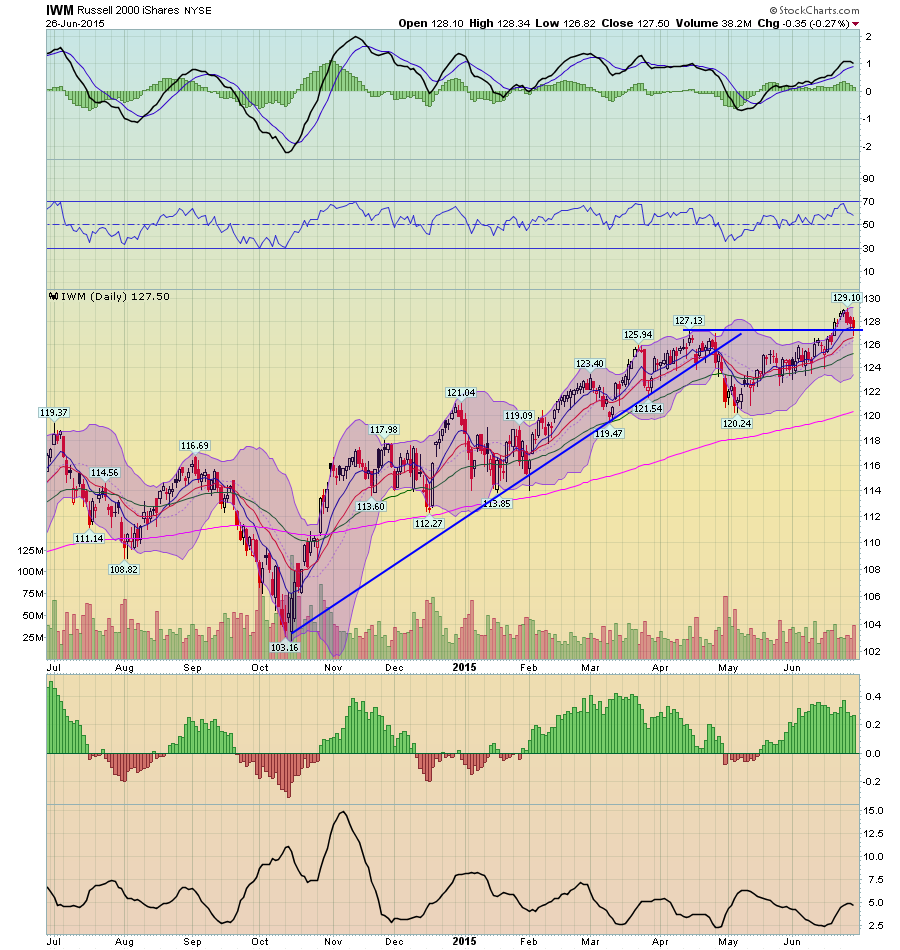
The IWMs rallied to a new high of 129.10, but spent last week consolidating gains as the index fell to support at the 121 level. But with a rising MACD and CMF and bullish EMA picture, additional moves higher are probable. Because Small cap stocks draw more of their earnings from the domestic economy, it’s logical for them to “lead the way” in a rally.
In contrast, we have the SPYs:
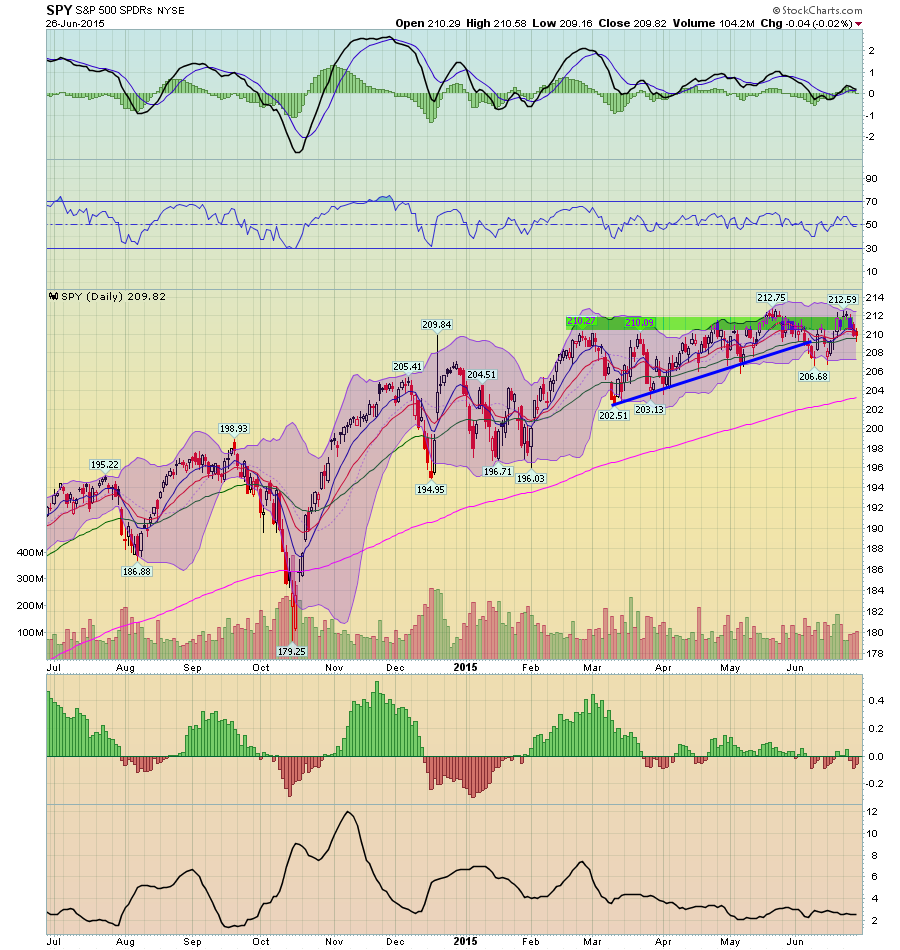
This index is still trading in a very narrow range and still has tremendous resistance at the 212-214 area. EMAs and prices are still in a “barbed wire” formation, which is far more bearish. Momentum and the CMF are weak, which does not bode well for a future move higher.
And then there are the transports:
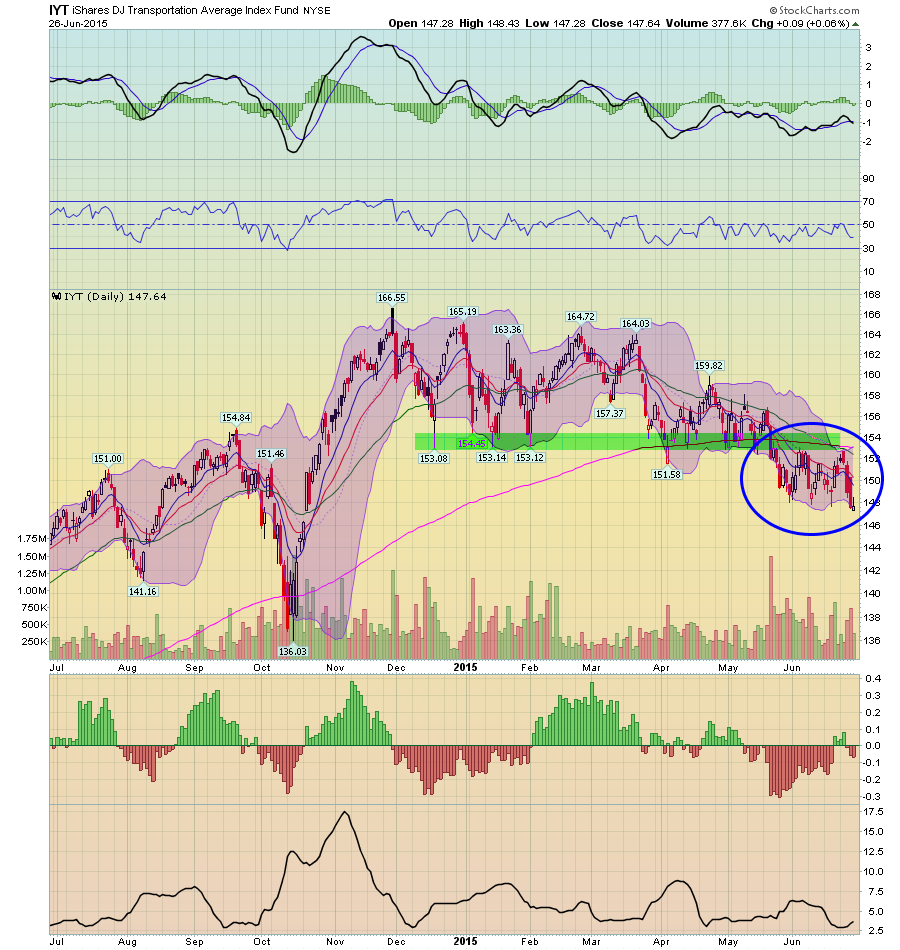
The IYTs are near a 6 month low. They have fallen through support at the 154 level and have negative momentum. This is especially concerning because transport companies should see an increase in revenue from weak oil prices. Instead, they are languishing.
There are two legitimate ways to explain the markets. The bullish side would say we are waiting for increasing economic growth to increase revenues. This would lower the overall PE ratio of the markets, allowing for an upward move. The small caps rise could be seen as a prelude to this broader move higher, with the bulls arguing small caps should theoretically lead the market. The transports weakness, however, throws a bit of a wrench into this theory as does the weakness in the cumulative advance/decline line.
The bearish side would argue the market is at a top. Supporting this thesis is the continued problem the SPYs have had moving higher, the overall expensive nature of the market and the weakness in the transports. They would also site the weakness in the cumulative advance decline lines for both the NASDAQ and NYSE. The small cap rally, however, places this theory in jeopardy; in the event of a market top, the small caps should theoretically be the first to decline as they are riskier.
Conclusion
On the economic side, things are looking far better than they were a month ago. The best news is coming from the housing sector. Building permits – a long leading indicator – have spiked, which is a huge long-term positive. New and existing home sales are increasing, continuing their long-term uptrend. Last month, consumers – who are responsible for 70% of economic growth -- came out from hiding and spent. The biggest negative is the strong dollar, which is hurting exports and, by extension, the manufacturing sector. International sales are also soft, which is a large cap negative.
As for market direction, while I understand the bearish argument, I just don’t see it. The LEIs are rising, and the long-term leading indicators are positive. Even if the Fed raises rates, it won’t be more than 50 basis points. Furthermore, a rise of that magnitude is fairly remote in the current slack employment and weak inflation environment. Finally, with the housing sector coming around, the possibility of a recession is extremely remote. As for the market direction, the SPYs are caught between a growing economy that should lead to increasing revenues and an already expensive valuation. They really need a meaningful increase in revenue to make a solid move higher. For that, we’ll have to wait for the next earnings season.


