Disclaimer
The information, tools and material presented herein are provided for informational purposes only and are not to be used or considered as an offer or a solicitation to sell or an offer or solicitation to buy or subscribe for securities, investment products or other financial instruments, nor to constitute any advice or recommendation with respect to such securities, investment products or other financial instruments. This research report is prepared for general circulation. It does not have regard to the specific investment objectives, financial situation and the particular needs of any specific person who may receive this report. You should independently evaluate particular investments and consult an independent financial adviser before making any investments.
Global Carry (a.k.a. Risk Parity) appears to be derailed, as we cautioned in February. We observe how that happened and how Global Carry is singularly linked to Bund and US Dollar. We also refresh and reflect on our US Leading Indicator and SPX fair value.
According to our Global Macro Framework1 “Global Carry” is the major driver of the global liquid assets and in particular is the major force behind the Risk Parity and global bonds. In February2we proclaimed the possible “Game Over” for Global Carry. Subsequent volatility related and driven by Bund carnage followed3 4in the result of which Global Carry currently stands at February levels. Below is Global Carry (blue) vs Bund (red):
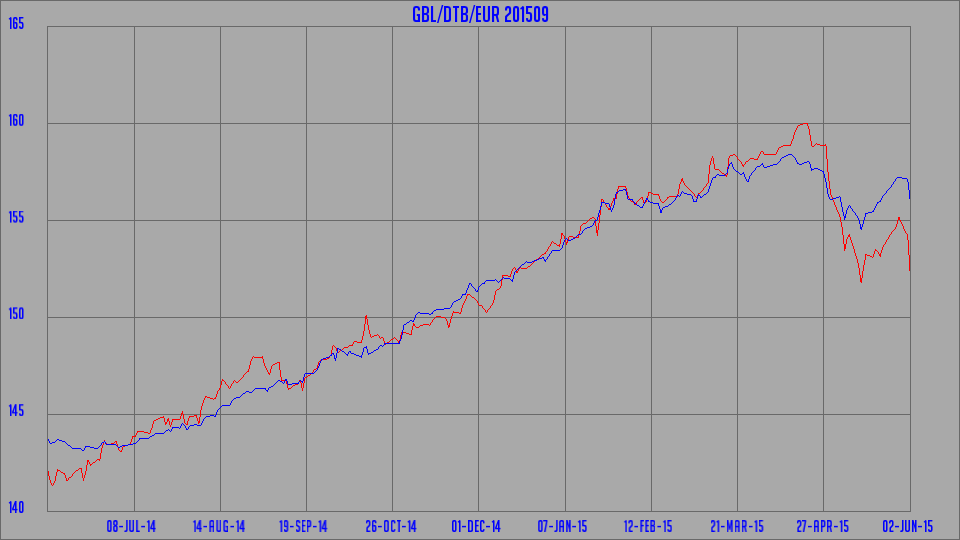
As one can see, after a couple of unsuccessful lift off attempts Global Carry is back to February levels. Something is broken, third time’s the charm? Below is the same chart zoomed in on intraday action today (Global Carry (blue) vs Bund (red)):
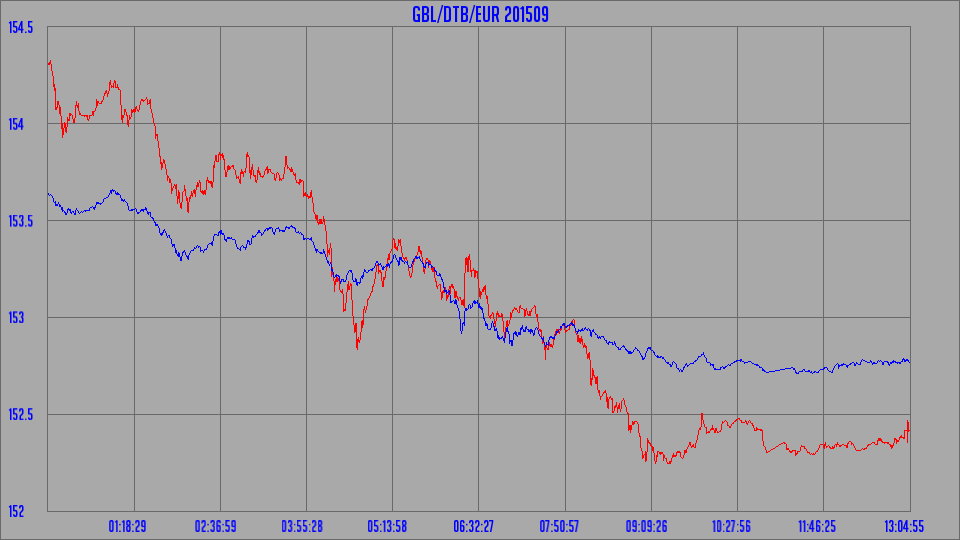
Basically, during sell-off Bund acts as a leveraged Global Carry pushing everything down with it.
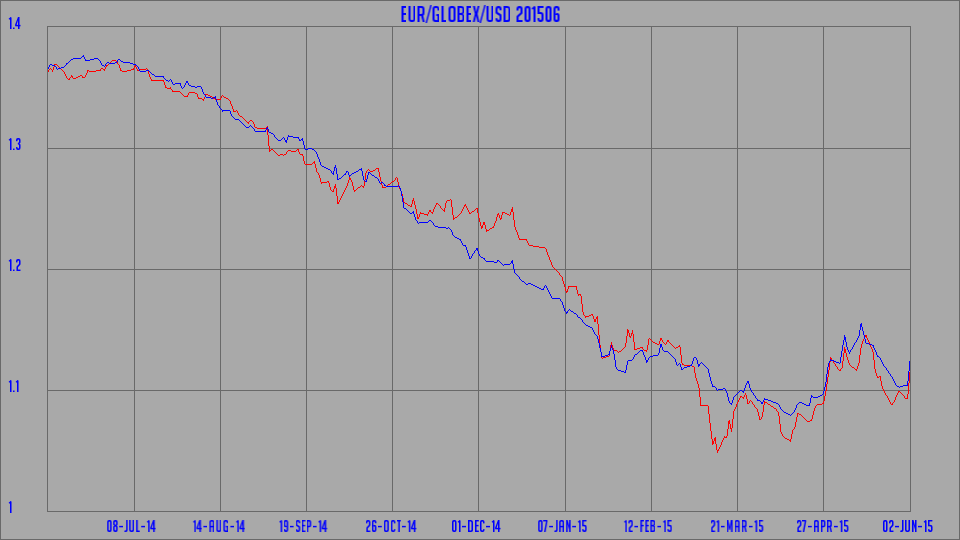
Much of the Global Carry action over last year can be attributed to US Dollar5. Below is Global Carry (blue) vs Euro (red):
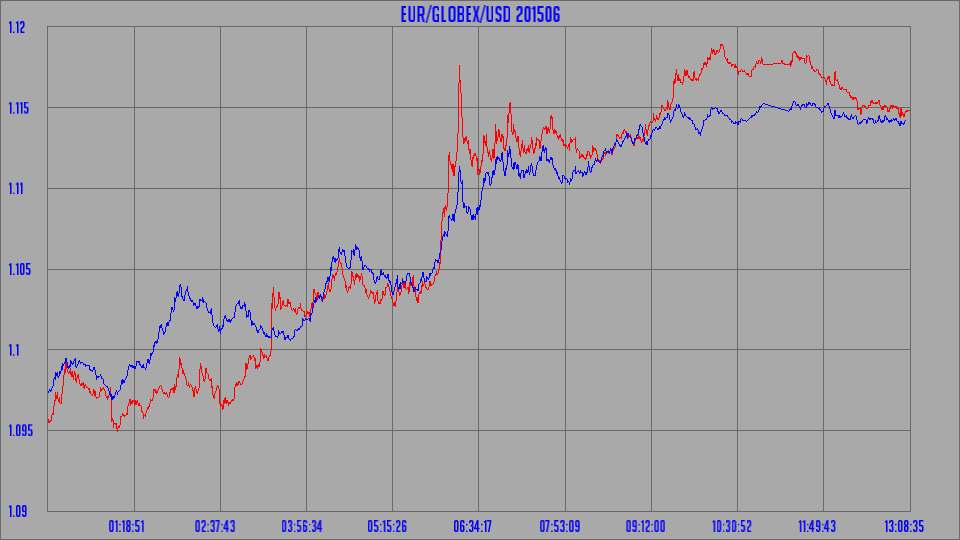
Below is the same chart zoomed in on intraday action today (Global Carry (blue) vs Euro (red)):
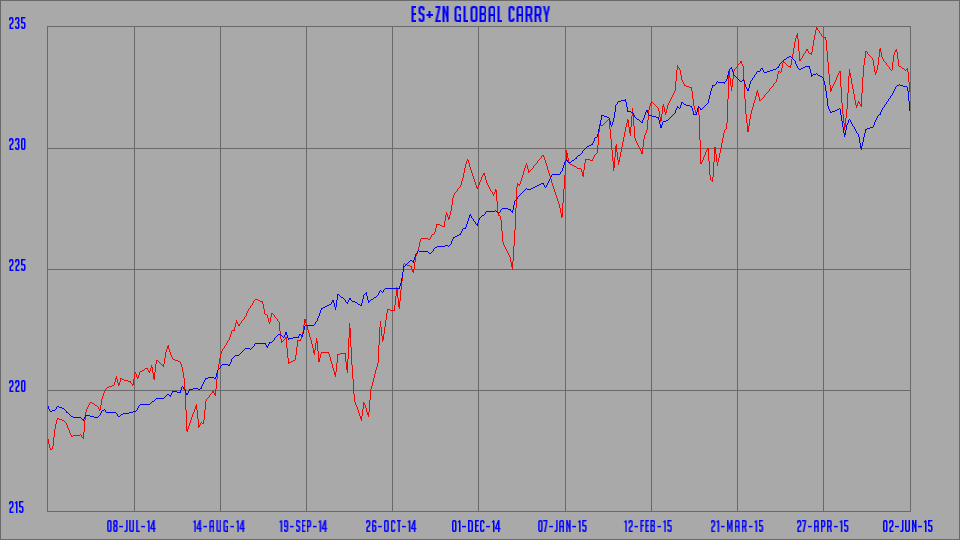
Finally, how about Risk Parity? Here is the Global Carry (blue) vs spectacular in its simplicity and performance “Risk Parity” proxy of S&P500 + 10y Note (to be precise, SPX e-mini future + 10y note future, red):
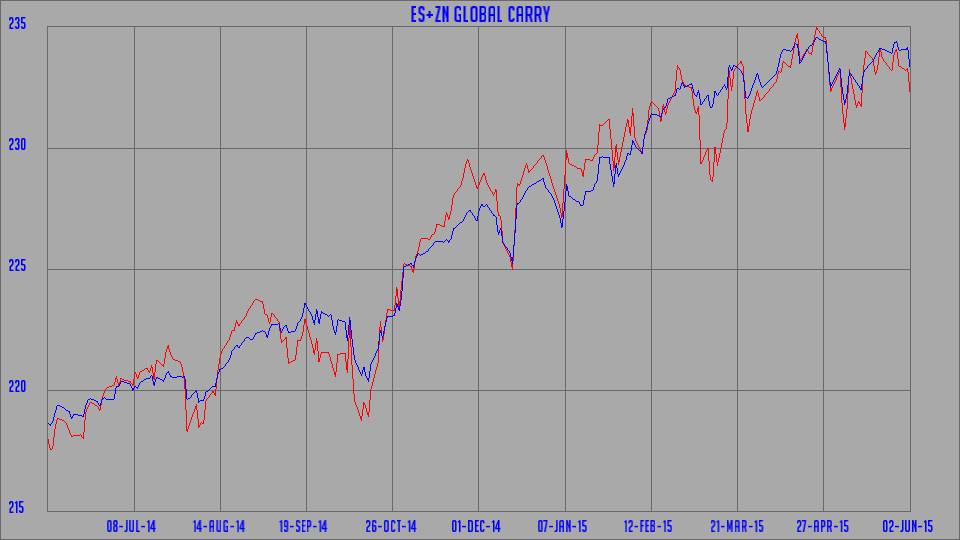
It looks a bit volatile but here it is adjusted for Risk On/Off factor:
Welcome to the investment in highly correlated world driven by self-perpetuating search for assets appreciation.
We surmise this correlation is produced as follows.
If you are US denominated money manager you would
- buy Risk Parity (US Global Carry)
- buy Bund (European bonds in general)
– sell Euro to hedge
This probably leads to the observed co-movement.
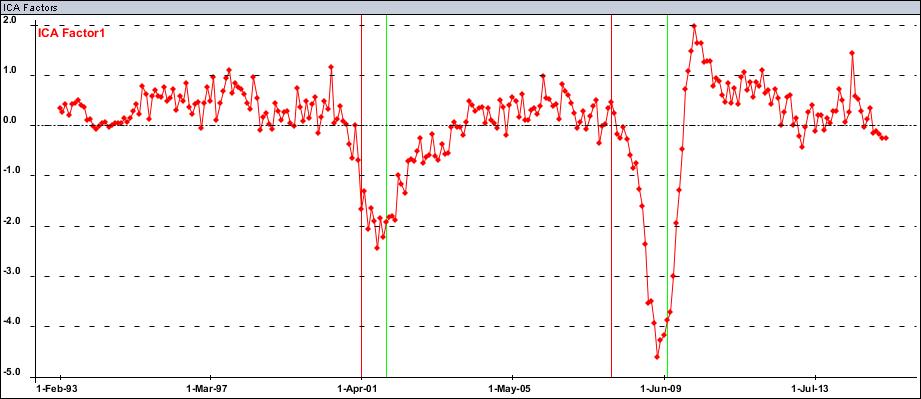
Let us switch the topic entirely. After ISM PMI and Factory Orders prints at the beginning of this week it is time to refresh our US Leading Indicators index:
There does not seem to by any improvement in it yet though it does not look like the end of the world either. Nonetheless we have been warning about this since the beginning of the year.6 7 8 Looking at S&P500 Total Return Index year over year chart (red) versus our Leading Indicators index (green) suggests little upside for SPX:
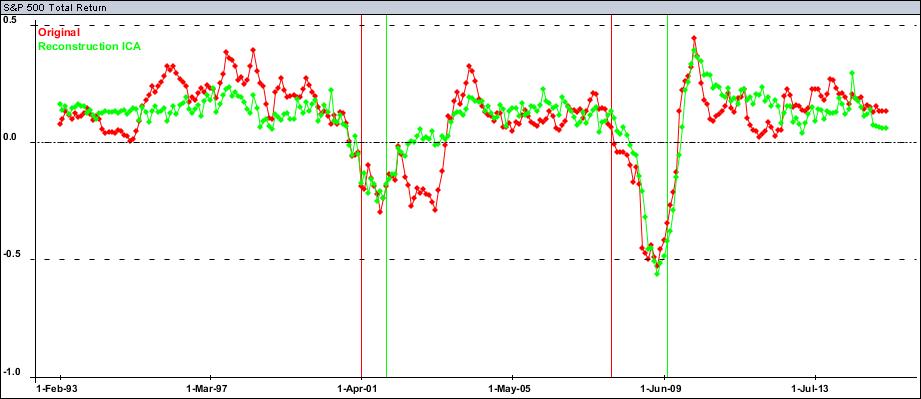
This is what we have seen since the beginning of the year indeed with SPX relatively dismal performance compared to previous years. That said there is not much suggested downside either.
1 Dynamika Commentary, “Global Macro Framework”, 11 March 2015
2 Dynamika Commentary, “Global Carry game over?”, 17 February 2015
3 Dynamika Commentary, “Bill’s “Short of a lifetime””, 21 April 2015
4 Dynamika Commentary, “Carry Scares”, 29 April 2015
5 Dynamika Commentary, “Global Carry gone parabolic?”, 29 November 2014
6 Dynamika Commentary, “Unsettling interplay of leading indicators”, 24 December 2014
7 Dynamika Commentary, “Is US sliding into recession?”, 28 January 2015
8 Dynamika Commentary, “US vs G7: decoupling? Recoupling!”, 4 February 2015


