The Charge Of The Monetary Light Brigade - Neosho Capital On The European Central Bank And Negative
In the wake of Japan’s ongoing “monetary banzai charge” into the teeth of deflation and low growth, we now turn our attention towards Europe and the adoption by the European Central Bank (ECB) of a negative interest rate policy (NIRP) and $1.2 trillion of quantitative easing. Spoiler Alert: in keeping with our view on Japanese monetary efforts, likewise we believe the ECB is well-meaning, but misguided, in its efforts to solve demographic, cultural, and political problems with massive monetary manipulations of exchange rates and securities markets.
In June of 2014, ECB President Draghi formally initiated NIRP by announcing that the ECB would pay -0.10% on particular kinds of deposits which the ECB accepts from its member banks. In essence, European banks that had excess reserves will now pay for the privilege to park those funds at the central bank, the first such move by any of the major central banks in history. Denmark and Sweden were the first to dip their toes into NIRP back in the 2010 timeframe. A Danish banker likened dealing with negative rates as “learning to drive a car backwards.” Indeed, there is even such a thing as “negative mortgage interest” home loans in Denmark, if the concept of negative deposit rates was not enough to boggle the economic mind.
Draghi followed this move up in March of this year by initiating Quantitative Easing via monthly sovereign bond purchases of €60 billion until at least September 2016 (18 months), or roughly $1.2 trillion in total bond purchases.1 The scale of European QE is about 1/3 the size of the Japanese effort and 1/4 the size of the Fed’s QE program. Given this gap in scale, it must be Mr. Draghi’s hope that negative interest rates (now with a lower bound of -0.20%) will somehow catalyze or magnify the impact of its significantly smaller QE bond purchasing program.
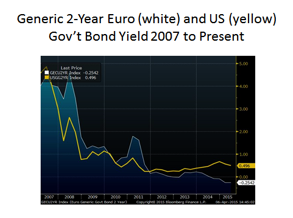
The two charts below, tracking the 2 and 10year European and US bond yields tell the tale of the tape as far as Europe’s NIRP’d and QE’d interest rates go. For the typical 2 year sovereign bond in Europe you can expect to pay 25 basis points each year for the privilege of owning a Euro-denominated government bond versus earning about 50 basis points per annum owning its US equivalent. If you extend your timeframe to 10 years, you will receive a whopping 0.19% of interest annually over the coming decade. The compound return of such an investment, before transaction costs, will be 1.9% for the entire ten year period. Meanwhile almost 10 times that amount of interest is available for those willing to take the perilous trip across the Atlantic to buy10 year US government bonds. We find neither investment particularly compelling.

It is safe to say that nominal interest rates (i.e. quoted and advertised rates) have never been lower in the US, Europe (including its German, French, Italian, and Dutch antecedents), the UK, Switzerland, and Japan going back to the dawn of reliable information on such things, which can be 1900, 1850, or 1800, depending on the country in question. This is undoubtedly a pivotal moment in global financial history, one that any long-term participant will mark as they do the record high US Treasury yields of 1981, the Crash of 1987, the Dot Com Bubble Burst of 2001, and the Lehman Crisis of 2008/9. These 5 major currencies easily account for 75% plus of global trade and wealth. Yes, there have been times of equivalently low real interest rates (the nominal rate less inflation), but they generally were brief “shocks” caused by wars or their aftermaths. At the very least it can be said that 99% of financial professionals working today have never seen such widespread, persistent, purposeful suppression of the interest rate mechanism.2
The assumed linkage between elevated securities market valuations, suppressed interest rates, and sustainable, broad-based wealth creation is, at present, a wish masquerading as economic theory. While the Fed has tapered its own bond purchasing, the Japanese remain mid-stream and the Europeans are just getting started. No one has run a full cycle of Quantitative Easing, i.e. actively begun to shrink their balance sheets.
The Japanese have been plying super low, though not negative, interest rate policies for the past 15 years, and have recently combined it with massive quantitative easing involving bonds, stocks, and real estate. Yet, Japanese inflation remains at 0.2% and economic growth remains around 1% year on year, despite these monetary efforts, which should give some pause to those advocating ZIRP or NIRP as the solution to European or US economic ills.
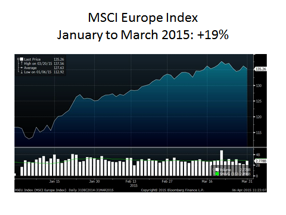
Regardless of our skepticism, it is undeniable that Draghi’s twin monetary efforts (NIRP and QE) have had a large impact on European securities prices and interest rates during the first quarter of 2015. The immediate effects of these super-suppressed interest rates are not hard to spot on the two charts below in terms of their effects on Euro/Dollar exchange rate, as well as European stock exchange prices. Un-coincidentally, the Euro/Dollar exchange rate fell by about 20% while the MSCI Europe (stocks) Index increased 22% off its January low to just a couple points off its all-time Euro-phoric/Tech Bubble high of 139 from those heady days of the Year 2000.

This rise in securities valuations has hit the Euro bond markets hard and it is estimated that $3.6 trillion of Euro Sovereign Debt is now trading at negative yields, representing roughly 16% of the total market. And each week brings more and more bonds into that negative realm because some investors are compelled to buy and bid up these money-losing investments due to portfolio constraints, index tracking requirements, capital reserve requirements, or the belief that bond prices can continue to rise. Negative yields are particularly prevalent in German, Dutch, and Finnish bonds, accounting for 30% of all such bonds currently outstanding.
To what end do these central banks hope to bring their monetarily adventuresome ways? The hope is that by discouraging excess reserves at banks and driving down “safe haven” (short duration, high credit quality) bond yields into negative territory that the prospective pain from loss of principal (which is what a negative interest rates make certain) or the gain from pathetically meager interest payments will cause those in the unfortunate position of having savings move into higher risk assets.
This, in turn, is supposed to ultimately drive down unemployment in Southern Europe and increase overall prosperity across the Eurozone. Economists call this the “Wealth Effect.” In a nutshell, the “Wealth Effect” predicts that an increase in nominal wealth via stock and bond prices will increase the general feelings of wealth in their holders, who will then spend their increased wealth, thus increasing aggregate demand, which leads to more jobs, more growth, and all sorts of desirable outcomes ensue.
At Neosho, we call this the “Underwear Gnomes Effect” in honor of the animated television series South Park 1998 episode “Gnomes”. We will try to preserve some portion of this commentary’s dignity by not going into too many details about this insightful cartoon, but suffice it to say that it involves a mysterious process whereby the Gnomes steal children’s underwear and turn a profit in this nefarious scheme.
Likewise, the leap from higher securities prices to long-term and sustainable EU prosperity also leaves a big, fat question mark in the middle of the PowerPoint slide that Mr. Draghi undoubtedly uses in his ECB presentations. And we are confused as to how this Wealth/Underwear Gnome Effect (if we assume the big, fat question mark goes away) differs from the oft-derided “trickle down” economics of the Reagan Era. Are these securities profits not supposed to have the same effect as the tax cuts of 1982 and 1986 in the US?
We see the ECB’s efforts as a well-intentioned (nobody else seems to be taking charge), but ultimately futile attempt for two reasons: it is misguided, like trying to unscrew a bolt with a hammer, and, even if monetary policy was the solution, the “wrench” chosen by the ECB would be woefully small.
First, the ECB’s monetary policy does not, and cannot, address the core demographic, political, and cultural issues which lie at the core of the EU’s current economic and existential ills. Japan’s monetary policy is being asked to solve a problem that cannot be solved with money, namely the depopulation of Japan thanks to low birth rates and the effects of a restrictive immigration policy. Likewise, the ECB’s efforts to “buy its way out of” fundamental flaws in the regulatory and political structure of the EU and its constituent states, in addition to language, cultural, and educational differences, cannot succeed because monetary policy has zero long-term effect on those underlying problems.
For example, imagine the US Federal Government without the power of direct taxation, depending upon the States to “upstream” the amounts it requests, and with ambiguous powers over those same States. In a nutshell, that is the EU. It is the same state of affairs that afflicted the Articles of Confederation when the former American Colonies first broke away from the Crown: the central government had all sorts of responsibilities, but no real way to fund the work. Or, imagine an unemployed oil worker from Texas who only speaks Spanish pondering a move to Minnesota, where there are many more jobs, but where they only speak Swedish. Intra-EU labor mobility is severely hampered, not just by this language barrier, but by cultural norms and expectations built up over hundreds of years.
Negative interest rates and aggressive bond purchases will not solve such political and cultural issues. They may temporarily drive down sovereign interest rates lightening the interest component of the southern European’s indebtedness, but the principal repayments remain in force and are massive. European stock prices have jumped smartly in the first quarter of 2015, but can they deliver the earnings growth needed to justify the higher multiples they now enjoy?
Second, even if monetary policy could somehow turn stolen underwear into profits, er, spur job creation and general economic growth, the scale of the ECB’s effort is inadequate and the attempt looks half-hearted. The EU and the US have roughly equal-sized GDPs about $16 trillion each, while Japan is a $6 trillion economy. The Fed purchased around $3.6 trillion of market securities, the Japanese are targeting $3 trillion, while the ECB is aiming to buy about $1.2 trillion.
|
GDP |
Peak Unemployment |
Current Unemployment |
QE |
QE/GDP |
|
|
Japan |
$6 trillion |
5.6% |
3.4% |
$3.0 trillion |
50% |
|
ECU |
$16 trillion |
10.9% |
9.7% |
$1.2 trillion |
6% |
|
USA |
$16 trillion |
10.0% |
5.5% |
$3.6 trillion |
23% |
In sum, while it may have temporarily juiced European asset values, the ECB’s NIRP and QE cannot solve the underlying political and economic issues of the EU, and even if ECB Gnomes could make a profit from stolen underwear, they are not stealing enough of them. When those temporary effects wear off, what then?The scale of the ECB intervention is undoubtedly constrained by the Germans, who as the largest contributor to the Euro “kitty,” are not very keen on printing money, or its monetary equivalents, given that bad experience they had back in the early 1930’s with hyperinflation. Which only further goes to demonstrate the seemingly intractable EU political problems pointed out in our prior paragraphs.3
Disclosures
Past performance is no guarantee of future results and there can be no assurance that the results presented herein can be achieved. Actual performance for client accounts may be materially lower than the results shown. Information provided reflects Neosho’s views as of the date of this presentation. Such views are subject to change at any point without notice. Neosho obtained some of the information provided herein from third party sources believed to be reliable but it is not guaranteed and we are not responsible for the consequences of any decisions or actions taken as a result of information provided in this presentation and does not warrant or guarantee the accuracy or completeness of the information requested or displayed.. Information contained herein is for informational purposes only and should not be considered a recommendation to buy or sell any securities. Nothing presented herein is or is intended to constitute investment advice, and no investment decision should be made based on any information provided herein. Neosho has not taken into account the investment objectives, financial situation or particular needs of any individual investor. There is a risk of loss from an investment in securities, including the risk of loss of principal. Different types of investments involve varying degrees of risk, and there can be no assurance that any specific investment will be profitable or suitable for a particular investor's financial situation or risk tolerance. Asset allocation and portfolio diversification cannot assure or guarantee better performance and cannot eliminate the risk of investment losses. Any forward looking statements or forecasts are based on assumptions and actual results are expected to vary from any such statements or forecasts. No reliance should be placed on any such statements or forecasts when making any investment decision.
The MSCI EAFE Index (Europe, Australasia, Far East) is a free float-adjusted market capitalization index that is designed to measure the equity market performance of developed markets, excluding the US & Canada. The MSCI EAFE Index consists of 21 developed market country indexes.
The MSCI World Index is a free float-adjusted market capitalization weighted index that is designed to measure the equity market performance of developed markets. The MSCI World Index consists of 23 developed market country indexes.
The MSCI ACWI Index is a free float-adjusted market capitalization weighted index that is designed to measure the equity market performance of developed and emerging markets. The MSCI ACWI consists of 46 country indexes comprising 23 developed and 23 emerging market country indexes.
The MSCI ACWI (ex-USA) Index is a free float-adjusted market capitalization weighted index that is designed to measure the equity market performance of developed and emerging markets. The MSCI ACWI (ex-USA) consists of 45 country indexes comprising 22 developed and 23 emerging market country indexes.
The MSCI Emerging Markets Index is a free float-adjusted market capitalization index that is designed to measure equity market performance of emerging markets. The MSCI Emerging Markets Index consists of 23 emerging market country indexes.
The MSCI US Broad Market Index represents the universe of companies in the US equity market, including large, mid, small and micro cap companies. This index targets for inclusion 99.5% of the capitalization of the US equity market. The MSCI US Broad Market Index is the aggregation of the MSCI US Investable Market 2500 and Micro Cap Indexes.
The S&P 500® Index with gross dividends is an unmanaged, market-capitalization weighted index that measures the equity performance of 500 leading companies in leading industries of the U.S. economy, capturing 80% coverage of U.S. equities. This index includes dividends and distributions, but does not reflect fees, brokerage commissions, withholding taxes or other expense of investing.
1 The exact nature of these purchases is, at present, a closely held secret, though anonymous sources report that the first round of purchases in March 2015 involved the bonds of Germany, France, Belgium, Spain and Italy.
2 In our modest survey of modern financial history for this commentary, we believe 1948 would have been the last year in the United States that Federal Reserve and Federal Government policy were oriented to such intense interest rate suppression. Warren Buffett would only have been 18 at the time, while his more senior partner, Charlie Munger, would have been 24. We can’t think of any other currently active financial professionals who would have been plying their trade in 1948, but we chose “99%” as a precaution.