Overview
Based on our analysis of the number of consecutive days the market moves in one direction, or “runs”, 2015 is currently pointing to either a down year or a below average return.
The market in 2015 through first quarter, 2015 appears fickle. We hear on a daily basis how the market doesn’t know which way it is going. Up one day, down the next. Based on this anecdotal evidence of the popular opinion, the market appears unusually volatile. There are many ways to measure volatility, including standard deviation of returns and distribution of returns. For this IQS Brief, we measure the “runs” in the market. Instead of focusing on the magnitude of the returns, we pay attention to the trends in the market. We simply count the number of days the market goes up consecutively, and the number of days the market goes down consecutively. This metric, which we call “runs,” easily allows a pictorial representation of the market movements.
The Run Count Calculation
The calculation is straightforward. Every time the DJIA, our market proxy, changes direction from a decline to an advance, the run count resets to one. From there, if the market advances again, the run count increments to two, and so on. This continues until the market declines, when a new run count begins with minus one. If the market declines again, the run count increments to minus two, otherwise the advance means a new run count starts again at one.
Note that the magnitude of the change is not incorporated in our metric, only the directional change.
Run Results
Over the history of our analysis of runs, October 1928 through March 31, 2015, we have observed 10,425 runs from 13 advancing days to 12 declining days. 25% of the time, there was a one day decline followed by an advance. 22% of the time, there was a one day advance followed by a decline.
Conclusions
We decided to look at the run counts to determine the level of volatility rather than traditional metrics which are heavily influenced by magnitude of changes. Even though we are only one quarter of the way through 2015, the year appears highly volatile. Looking at the correlation between the “one-day only” run counts and the market returns for the year finds a correlation of -.3, suggesting that the high one-day run count in 2015 is pointing to a lower than expected return for the year.
Since 1990, when the total “one-day” run count was 57% or more, the returns for that year were negative 3 of the 6 years, and returned less than 7% each of the years. So far in 2015, the one-day run count is at 58.3%.
See Chart below:
|
Year |
Return |
|
2015 2008 |
? -33.8% |
|
2007 |
6.4% |
|
2005 |
-.6% |
|
2004 |
3.1% |
|
2001 |
-7.1% |
|
1992 |
4.2% |
Below are some additional takeaways from our analysis:
- DJIA has reversed direction much more often in 2015(33.3% vs 22.1%) from a one day advance to a decline than historical observations would suggest
- One day positive runs followed by a market decline occurred 44% historically compared with 67% in 2015
- Two day negative runs followed by a market advance occurred 51% historically compared with 78% in 2015
Table 1
DJIA “Run Counts” from October 1928 through March 31, 2015
Observations:
2015 one day positive run is 33.3%, while historical average is 22.1%.
2015 two and three day positive runs are 11.1%, while historical average is 20.3%.
2015 one day negative run is 25.0%, while historical average is 24.6%, right on target.
|
Percentage |
|||
|
Runs |
2015 |
Historical |
|
|
-14 |
0.0% |
0.0% |
|
|
-13 |
0.0% |
0.0% |
|
|
-12 |
0.0% |
0.0% |
|
|
-11 |
0.0% |
0.0% |
|
|
-10 |
0.0% |
0.0% |
|
|
-9 |
0.0% |
0.0% |
|
|
-8 |
0.0% |
0.1% |
|
|
-7 |
0.0% |
0.3% |
|
|
-6 |
0.0% |
0.7% |
|
|
-5 |
2.8% |
1.6% |
|
|
-4 |
2.8% |
3.1% |
|
|
-3 |
0.0% |
6.4% |
|
|
-2 |
19.4% |
12.9% |
|
|
-1 |
25.0% |
24.6% |
|
|
1 |
33.3% |
22.1% |
|
|
2 |
8.3% |
13.1% |
|
|
3 |
2.8% |
7.2% |
|
|
4 |
5.6% |
3.8% |
|
|
5 |
0.0% |
1.9% |
|
|
6 |
0.0% |
1.1% |
|
|
7 |
0.0% |
0.4% |
|
|
8 |
0.0% |
0.3% |
|
|
9 |
0.0% |
0.1% |
|
|
10 |
0.0% |
0.1% |
|
|
11 |
0.0% |
0.0% |
|
|
12 |
0.0% |
0.0% |
|
|
13 |
0.0% |
0.0% |
|
|
14 |
0.0% |
0.0% |
Table 2
DJIA Next Day Probability from October 1928 through March 31, 2015
Using the historical data, we are able to calculate the probability that the DJIA will continue a run, or change a run. For instance, after a one day positive advance, what happened the next day? Did the DJIA advance again, or did it decline. Of course, observing historical occurrences doesn’t guarantee at all that the future will replicate the past, but it’s an interesting question that we can answer. The chart below shows both the historical percentages and percentages during 2015 for various scenarios.
Observations:
Over the past, after a one day positive run, the market has advanced again 56% of the time. In 2015, the market advanced a second day only 33%, while reversed 67% of the time.
After a two day negative run, historically the market has advanced 51% of the time. In 2015, it’s reversed and advanced 78%, hence showing the volatility.
| Percentage |
|
||||||
|
Description of Trend: |
Historical | 2015 |
|
|
|||
|
One Day Positive Run Followed by Market Advance |
56% |
33% |
|||||
|
One Day Positive Run Followed by Market Decline |
44% |
67% |
|||||
|
One Day Negative Run Followed by Market Decline |
51% |
53% |
|||||
|
One Day Negative Run Followed by Market Advance |
49% |
47% |
|||||
|
Two Day Positive Run Followed by Market Advance |
53% |
50% |
|||||
|
Two Day Positive Run Followed by Market Decline |
47% |
50% |
|||||
|
Two Day Negative Run Followed by Market Decline |
49% |
22% |
|||||
|
Two Day Negative Run Followed by Market Advance |
51% |
78% |
|||||
Table 3
Below is a chart showing the distribution of the run counts over the past 87 years. Note the symmetry between the upside and the downside run counts, with the exception of the one day runs. There are a few percent more one day negative than one day positive, implying the market is more likely to advance after a one day market decline than to decline after a one day market advance.
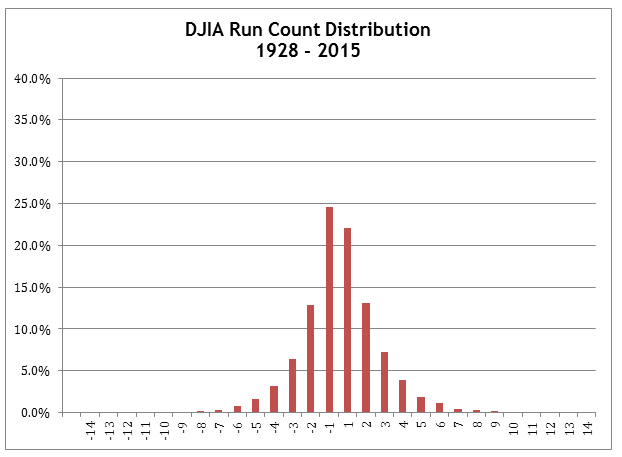
Table 4
Below is a chart showing the distribution of the run counts over the past 87 years compared with 2015. The higher than historical average one day positive run count for 2015 implies that the market has flipped often from a one day advance to a decline. Similarly, there is a higher than expected two day negative run count, but a lower three day negative run count. After two days, the DJIA in 2015 has advanced more than expected, while historically the DJIA has experienced 3 day run counts. In 2015, there have been no 3 day negative run counts.
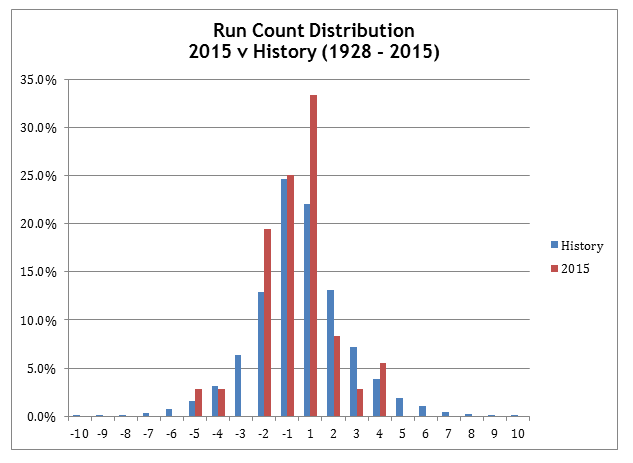
Table 5
The Graph below shows the percentage of times that a run count for the DJIA is one day only. The run could be positive or negative, but the trend ends after one day.
Note that 2015 does seem to among the highest one day run count percentages over the past 25 years.
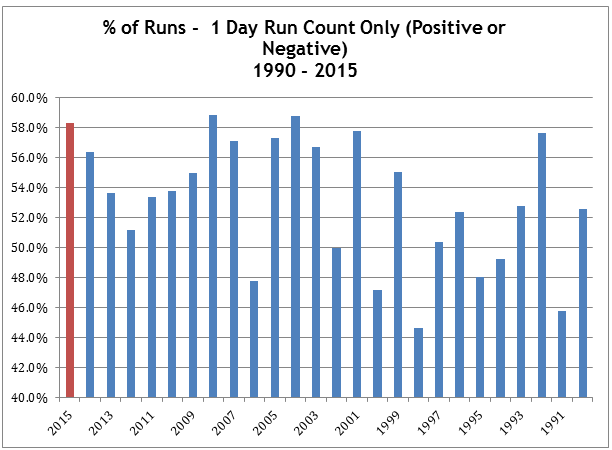
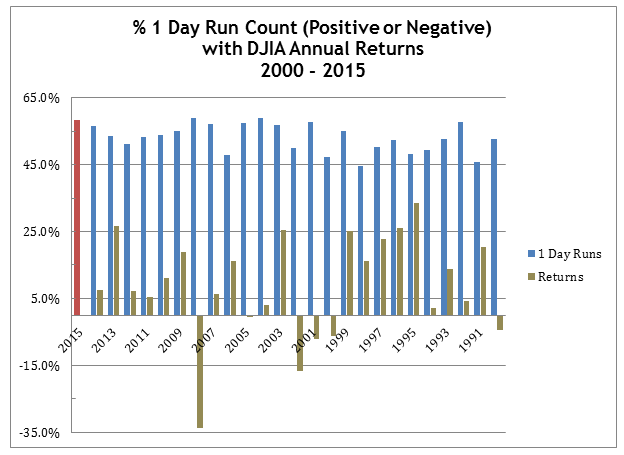
Table 6
The Graph below shows the returns to the DJIA for various One Day Run Counts. Note that the run count percentage is the percentage of runs with a one day run count, either positive or negative. Hence, it’s showing the percent of time the DJIA advanced or declined one day only, then reversed the next day.
Very High One Day Run Counts are associated with less than average returns.
(c) Innovative Quant Solutions