“Momentum is the premier market anomaly and is above suspicion“ - Fama & French
The power of momentum in the financial markets is one of the most researched and documented market anomalies. Morningstar notes that “The Big Two” factors in factor-based investment strategies are value and momentum1. Momentum is one of the most robust approaches in terms of its applicability and reliability. Since just 1993 there have been nearly 400 published momentum papers, making it one of the most heavily researched finance topics over the past twenty years. Extensive academic research has shown that momentum works in virtually all markets and time periods, from Victorian ages up to the present.
Momentum investing is based on the idea of trend following. Like Sir Isaac Newton’s theory of momentum, the concept is that an object in motion tends to stay in motion – but not forever. Momentum strategies simply try to identify a trend in its early stages by measuring and comparing price momentum with the hopes that the trend continues. Momentum strategies use a dynamic process to analyze the price movement of an investment or group of investments.
There are many ways to measure momentum. Relative Strength (RS), for example, is a momentum-based strategy that measures the movement of a predefined group of investments across a period of time. The investment showing the best price movement is said to have the highest relative strength. The concept is fairly simple – invest in the one showing the most relative strength and periodically re-calculate and adjust the portfolio if needed so it always contains the investment of highest relative strength.
Because it stems from an entirely different mind-set based on technical analysis rather than fundamental data, RS has the potential to add a powerful dimension to a traditional portfolio.
The graph below, calculated by Arrow Funds2, illustrates the historical growth of the S&P500 Value Index, S&P500 Growth Index and Momentum, based on the Fama-French size/momentum large-cap model (see: http//mba.tuck.dartmouth.edu). The historical data makes a compelling argument for momentum.
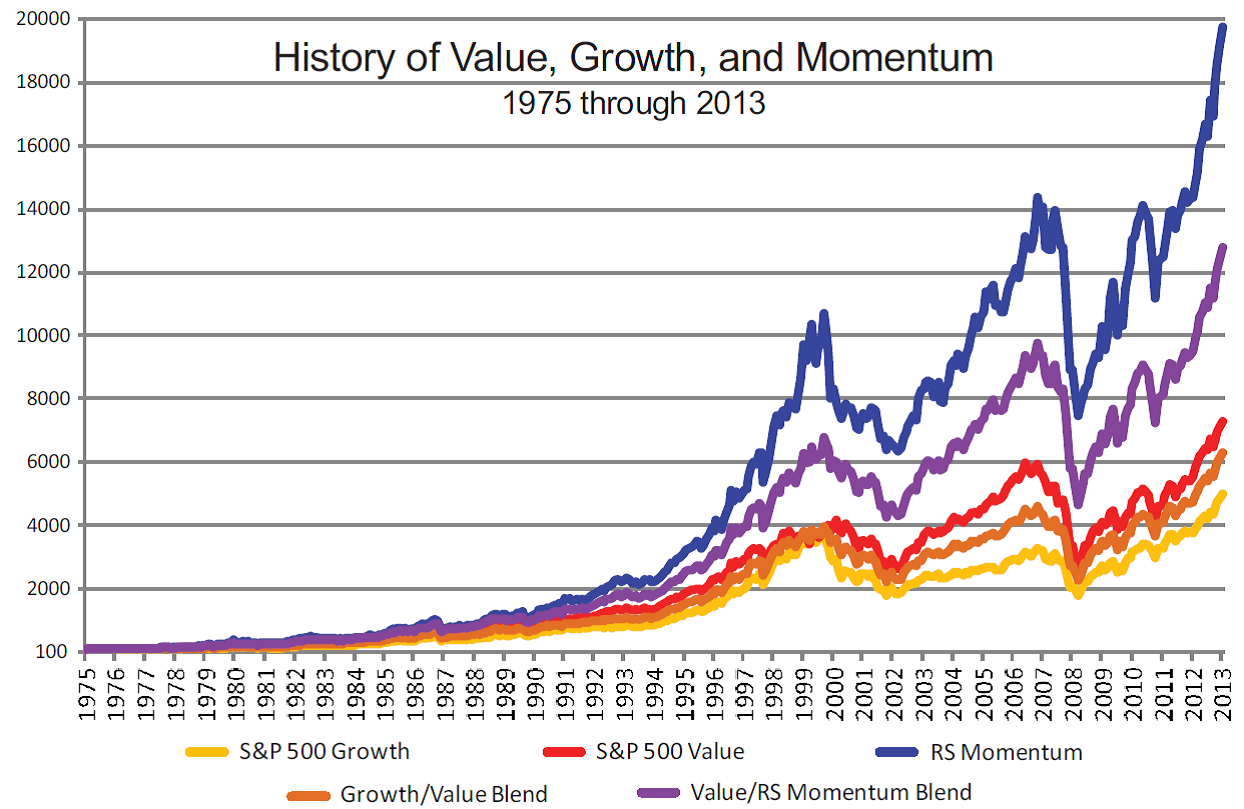
PAST PERFORMANCE IS NO INDICATION OF FUTURE RETURNS. The graph at left is based on index data and published academic models. The index and blended data assumes quarterly rebalancing and reinvestment of dividends, but does not include fees. Indexes are not available for direct investment. Data sources: FactSet and Fama-French Library.
At Keystone Wealth Advisors, we’ve confirmed this research with our own. The chart below is a hypothetical back test that shows the results of a very simple relative momentum methodology of investing in the highest relative strength ETF from a group composed of four ETFs giving exposure to the S&P500, small/midcap US stocks, developed foreign stocks, and emerging market stocks from January 2003 to June 2014. It rebalances monthly. (All charts in this paper represent a hypothetical back test using the referenced ETFs. Returns are total return, reflecting the reinvestment of dividends, but do not reflect any transaction costs or advisory fees).
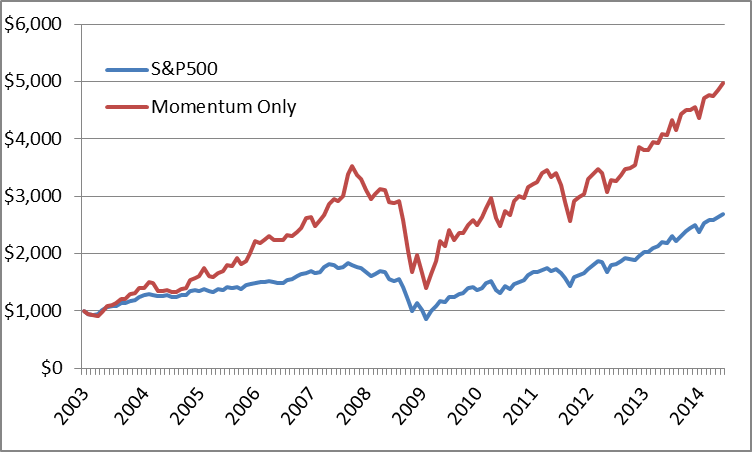
Clearly the relative momentum approach produces a bigger total return than the buy-and-hold approach with the S&P500 Index. However, the portfolio still has a significant maximum drawdown exceeding 60%.
Despite its edge over time and particularly during bull markets in stocks, the one thing that momentum investing does not address effectively is the large drawdowns that can still occur by maintaining a 100% allocation to stocks, even if always invested in those of the highest relative strength. The term “relative” simply means that something performs better than something else on a relative or comparative basis and this method did indeed produce better relative performance as measured against the S&P500 index. Within this context, if we focus our attention away from the periods of positive returns in the stock market to periods of decline, a relative performance of negative 25% compared to a negative 40% is still defined as good.
How do we address the issue of severe drawdowns to get a better solution for the real needs of investors? What if we could avoid most of the severe declines that occur in stocks and limit the size of the drawdowns? The answer is introducing another level of momentum into the mix known as absolute momentum. Absolute momentum adds an additional level of scrutiny to the trend of the assets in the group. Instead of just comparing various stock investments to each other and investing in the highest relative strength stock position, absolute momentum says that you will invest in the highest relative strength stock investments only if they are showing a positive price trend, or absolute momentum. A simply way to implement this is to add a deemed risk-free asset into the group that is ranked right along with all of the equity positions.
So, the next level is adding short term US treasury bills into the list. This next step has been referred to as “dual momentum” because we are looking at both relative momentum and absolute momentum at the same time. In this hypothetical back test the same equity ETFs are used as in the example above and an ETF representing short term treasuries is also a candidate from January 2003 to June 2014. It rebalances monthly. This means that when the ranking is done each month the top ETF could be the short term treasury ETF or any of the equity ETFs. The short term treasuries are quite broadly accepted as risk-free assets and cash equivalent.

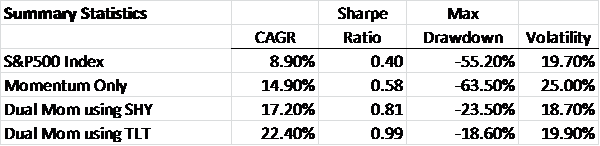
Adding the absolute momentum level shows significant benefits over using only the relative momentum approach only. This is primarily because the portfolio can move to the short term treasury bonds when the equities lose momentum in relation to the treasuries. In this case the total return is improved and the maximum drawdown is reduced from a negative 63% to a negative 23%. Recovering from a 23% decline is much easier than recovering from a 63% decline.
Now, what if we use long term treasuries instead of short term treasuries? Using long term treasuries adds a little bit more sensitivity and the opportunity for growth when out of stocks instead of just the safety of cash. The chart below shows the results of a hypothetical back test using the exact same methodology and group of equity ETFs as above but also using an ETF that tracks long term treasuries instead of just short term treasuries from January 2003 to June 2014. It also rebalances monthly.
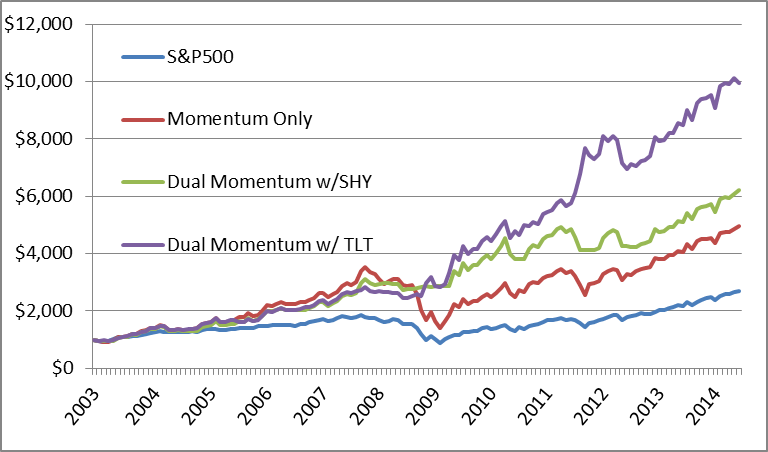
Not only does the total return improve even more, but the maximum drawdown is reduced further to 18.6%.
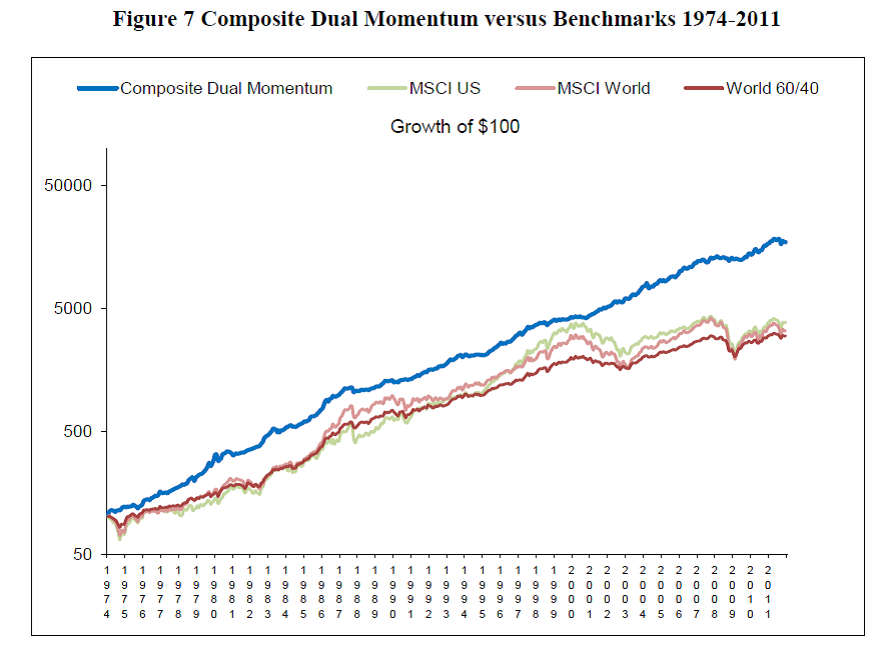
The dual momentum approach (blending relative momentum with absolute momentum) has been extensively researched by others, such as Gary Antonacci of Portfolio Management Associates, LLC. In his 2012 research paper entitled “Risk Premia Harvesting Through Dual Momentum” he shows his findings that both relative momentum and absolute momentum can enhance returns, but that combining them gives the best results.
Antonacci says: “… we need to distinguish clearly between relative and absolute momentum. When we consider two assets, momentum is positive on a relative basis if one asset has appreciated more than the other has. However, momentum is negative on an absolute basis if both assets have declined in value over time. It is possible for an asset to have positive relative and negative absolute momentum. Positive absolute momentum exists when the excess return of an asset is positive over the look back period, regardless of its performance relative to other assets.”
His conclusion?: “The combination of relative and absolute momentum makes diversification more efficient by selectively utilizing assets only when both their relative and absolute momentum are positive, and these assets are more likely to appreciate. A dual momentum approach bears market risk when it makes the most sense, i.e., when there is positive absolute, as well as relative, momentum. Module-based dual momentum, serving as a strong alpha overlay, can help capture risk premia from volatile assets, while at the same time, defensively adapting to regime change.”
This figure from his research paper demonstrates his findings:
Two additional pieces of research that address this concept well are:
Generalized Momemtum and Flexible Asset Allocation (FAA) An Heuristic Approach – Wouter J. Keller and Hugo S.van Putten, December 24, 2012
Adaptive Asset Allocation: A Primer – Adam Butler, CFA, Michael Philbrick, Rodrigo Gordillo, and David Varadi, September 2013
Conclusion:
It is the combining of both relative momentum AND absolute momentum (dual momentum or Momentum2) that really unleashes the power of momentum investing. Not only does it keep the assets invested in the areas of highest relative strength during bull markets, but it can move the portfolio to assets with potentially positive absolute momentum when stocks are in decline and help dramatically reduce portfolio drawdown.
2 Arrow Quarterly Bullseye Report, 1st Quarter 2014, published by Arrow Funds.
IMPORTANT DISCLOSURES:
No current or prospective client should assume future performance of any specific investment strategy will be profitable or equal to past performance levels. All investment strategies have the potential for profit or loss. Different types of investments involve varying degrees of risk, and there can be no assurance that any specific investment will either be suitable or profitable for a client's investment portfolio. Historical performance results for market indices and/or categories generally do not reflect the deduction of transaction and/or custodial charges or the deduction of an investment-management fee, the incurrence of which would have the effect of decreasing historical performance results. Economic factors, market conditions, and investment strategies will affect the performance of any portfolio and there are no assurances that it will match or outperform any particular benchmark.
Information presented is believed to be factual and up-to-date, but we do not guarantee its accuracy and it should not be regarded as a complete analysis of the subjects discussed. All expressions of opinion reflect the judgment of the author as of the date of publication and are subject to change. Information presented does not involve the rendering of personalized investment advice, but is limited to the dissemination of general information on products and services. It should not be construed as an offer to buy or sell, or a solicitation of any offer to buy or sell the securities mentioned herein.
The hypothetical and back tested information, including the projected success of dual momentum, does not represent any actual trading, but was achieved solely by the means of retroactive application of a model designed with the benefit of our hindsight and modification. The results do not reflect the impact of material economic and market factors that may have had on our decision making at the time of the event, had we been actually managing any client assets in this strategy. The model, after achieving desired results, did not materially change. Actual trading results of in this strategy would be lower than the results in this illustration due to trading costs, management fees, and other potential costs. Prospective clients should not base investment decisions on back-tested performance as no client achieved the returns stated above. The purpose of back-tested performance is to test the investment ideas, investment strategy developed (and modifications) to achieve stated results. Past results, including hypothetical and back-tested results are not a guarantee or predictor of future results.
Indexes cannot be invested in directly, do not have trading costs or fees associated with them and are total return (reinvestment of dividends and capital gains). S&P 500 Index is owned by Standard and Poor’s; data is S&P. US Small/Midcap Index is Standard & Poor's Completion Index, a broadly diversified index of stocks of small and medium-size U.S. companies; data by S&P. Emerging Markets Index is MSCI Emerging Markets Index, data by MSCI. Developed Foreign is MSCI EAFE Index, data by MSCI. US Treasuries (long term) Index is Barclays U.S. 20+ Year Treasury Bond Index; data by Barclays. No part of this article may be reproduced in any form, or referred to in any other publication, without proper reference.
©2015, Keystone Wealth Advisors, LLC.


