One of today’s most glaring inter-market divergences is the relative performance of US versus non-US equities. For dollar-based investors, non-US stocks have underperformed US stocks by a whopping 40% over the past five years. But are foreign stocks attractive at current prices? And if so, how much of my portfolio should I allocate abroad?
Around the World in 60 Seconds
To illustrate global market anomalies, we’ll use Vanguard ETF’s. Vanguard has created a number of low-cost, passive funds that divide world markets in a sensible manner.
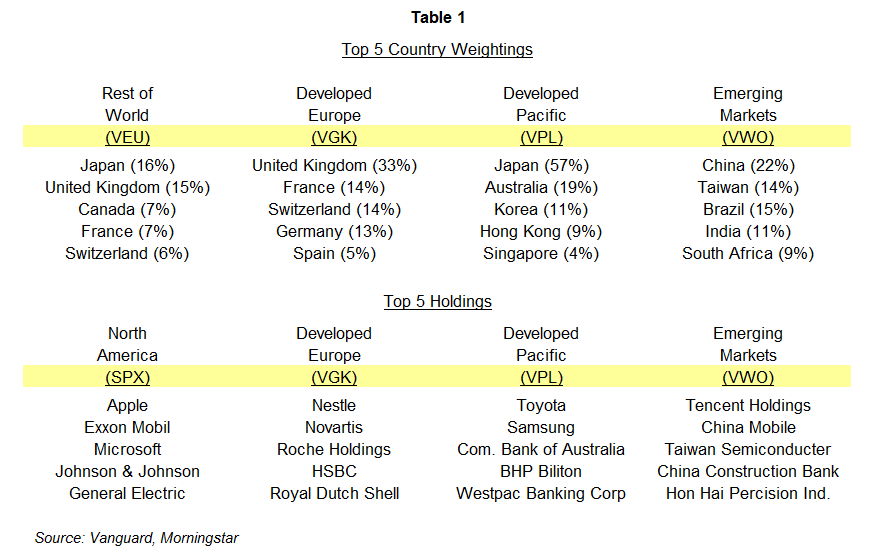
The tables below compare Vanguard international funds with the US-bellwether S&P 500 index. The Vanguard FTSE All World Ex-US fund (VEU) samples an index of non-US equities representing approximately 50% of global capitalization. VEU is weighted 48% toward developed Europe (VGK), 28% toward developed Pacific (VPL), and 18% toward emerging markets (VWO).
Table 1 presents country weightings and top holdings for each fund. US investors are probably familiar with most of the top names in developed Europe. In the developed-Pacific region, US investors will recognize some, but not all, holdings. Emerging-market companies are least familiar to US investors. These issuers are, by nature, both riskier and potentially more lucrative than their developed-market counterparts.
So how do world markets stack up? Table 2 presents fundamental statistics around the globe. By many measures, non-US markets appear relatively cheap.
We’ll explore valuation in further detail below. But first, let’s take a look at basic price history.
The Most Important Chart in the World
The chart below plots the dollar price of VEU (upper panel) along with its relative strength versus the S&P 500 (lower panel). VEU has traded essentially sideways for nearly four years without recovering its pre-crisis high of late 2007. Its relative-strength line versus the US market has declined more than 40% since 2009. Relative strength is a simple ratio of one price to another. The ratio excludes dividends, but is nonetheless a reasonable proxy for total return.
Chart 1
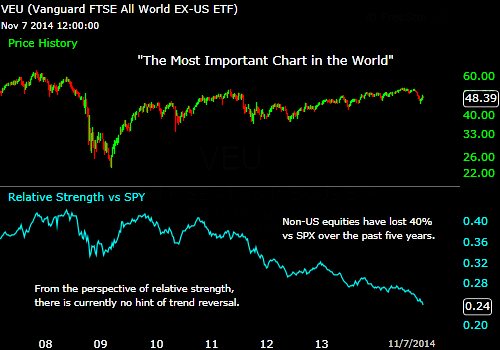
Chart courtesy ofwww.FreeStockCharts.com
Given Europe’s dominant weight in VEU, it would be easy to argue that troubles there are driving the divergence between the United Sates and the rest of the world. But the issue runs deeper. All of VEU’s constituent regions are in steep relative-strength downtrends versus the US market. The price charts for developed Europe, developed Pacific and emerging markets all look very much like VEU. All three sectors have traded sideways for nearly four years while the US has sprinted ahead.
So why is this important? Markets don’t move sideways forever. The four-year consolidation in non-US markets is either a giant topping process or a giant base-building process. We suspect the latter, especially in the case of emerging markets, which over the long run, should continue to “emerge.”
If our thesis is correct, the rest of the world will eventually catch up, and even outpace the US market. Early evidence would include a price breakout above the four-year range and a bona-fide reversal in relative strength. None of this has happened yet. But valuations are becoming stretched, putting a floor under non-US markets.
Detecting a long-term shift in favor of foreign stocks is a challenging proposition. Getting this question even partially correct may well pose the greatest asset-allocation opportunity of the next five years or longer. With all hyperbole aside, the relative strength of VEU versus the S&P 500 is, to serious investors, “the most important chart in the world.” Now let’s take a closer look at valuation.
Fundamental Value
The value of anything is defined by its market price compared with something else. Dollar prices and relative-strength lines are simple expressions of valuation. But we need to look further. We need to compare market price with the capacity of an enterprise – or group of enterprises – to produce positive cash flow.
Basic valuation statistics were presented in Table 2. We’ll now attempt to put these figures into historic context using MSCI indices as our data source. MSCI indices are very close in construction to our Vanguard funds, but offer a much longer data history.
Charts 2 and 3 present two decades of sales revenues and operating earnings for major world markets. We rebased both charts to December 2007 in order to judge activity relative to pre-crisis levels. As you can see, top-line revenues are very strong in emerging markets and North America, but flat in the Pacific, and slumping in Europe. Bottom-line earnings are strong in North America, weak in Europe, and flat elsewhere.
Chart 2
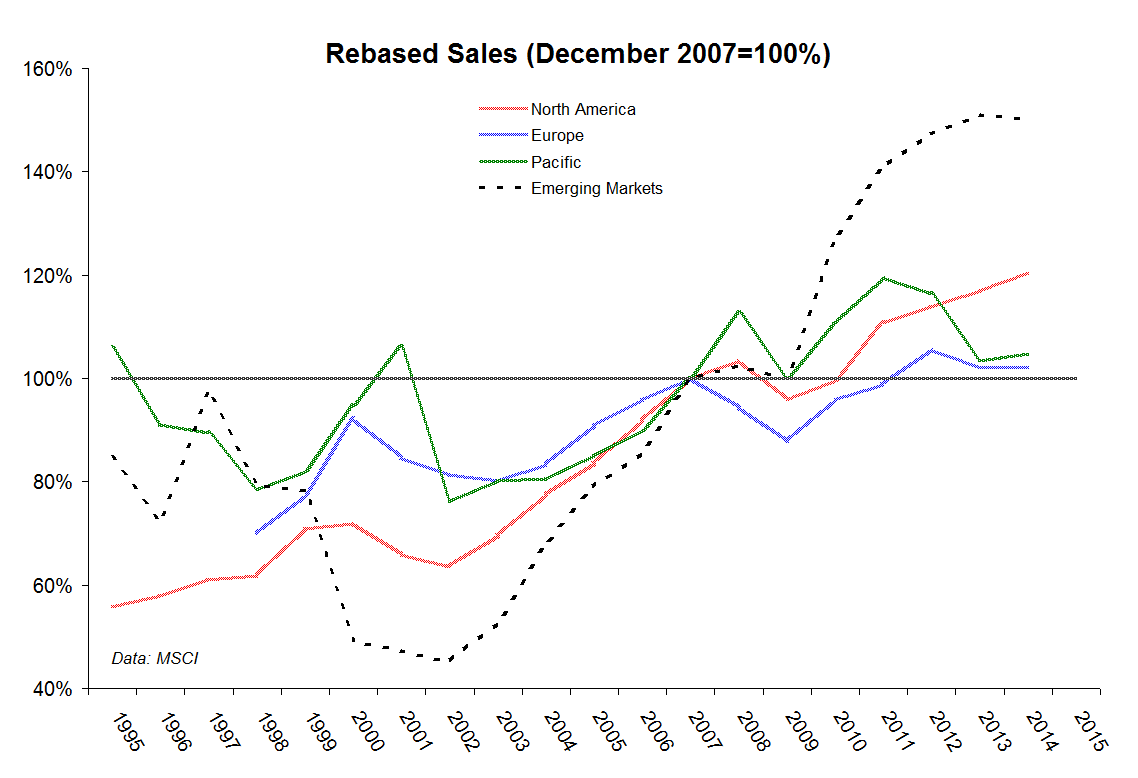
Chart 3
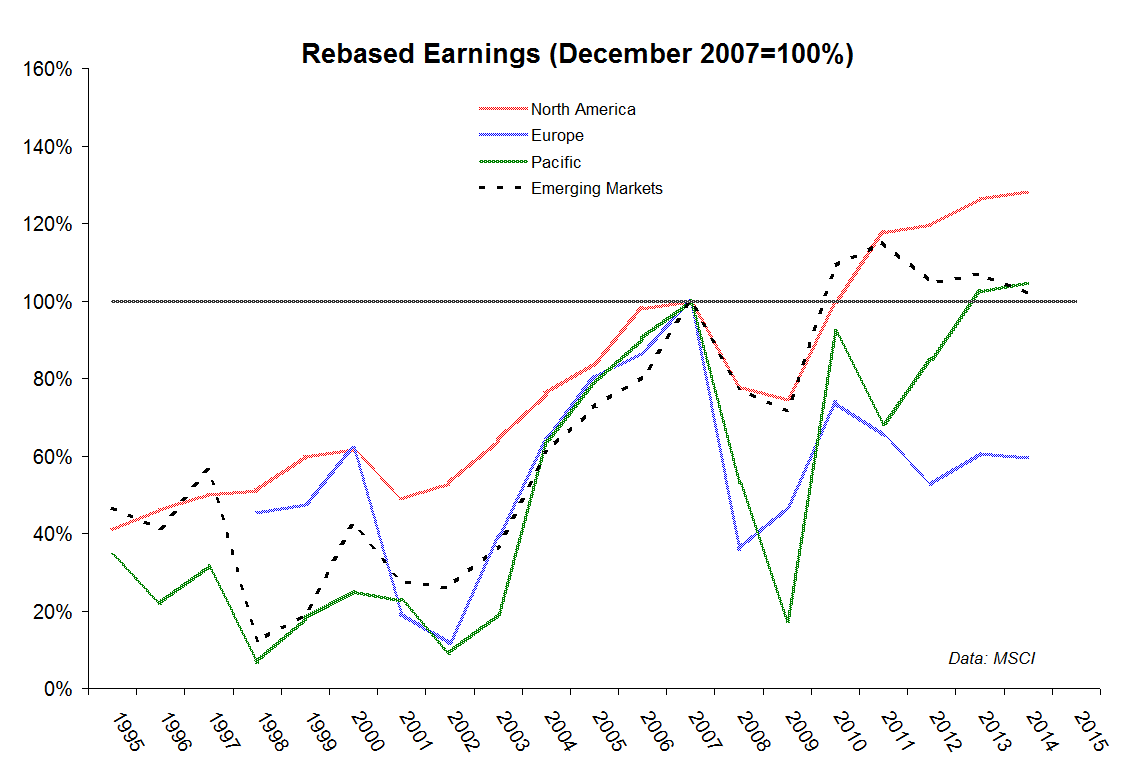
From this perspective, Europe’s lackluster investment performance over the past few years makes a great deal of sense. But good valuation work emphasizes future capacity over current results. Capacity is judged largely by the historic range of valuation multiples such as price-to-sales, price-to-earnings and price-to-book.
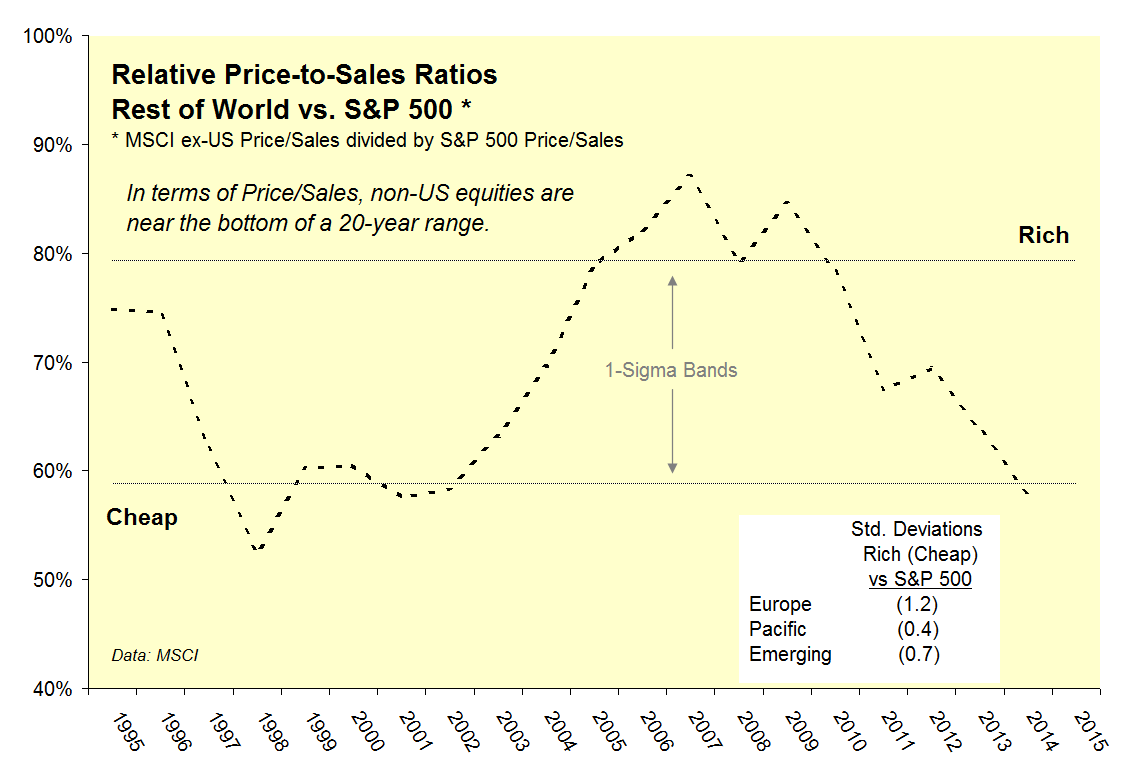
Price-to-sales is probably the most reliable measure, given differences in global accounting standards. Based on current multiples of 1.0x and 1.7x, non-US equities are priced at 58% of US valuation. But be careful with this figure. Non-US equities have always traded at a discount, at least over the past twenty years for which data is available.
Chart 4 presents the historic record based on the MSCI ACWI ex-US Index, a close cousin of VEU. From this angle, non-US equities are indeed cheap. On average, non-US stocks have traded at 68% of US price-to-sales with a low of 52% in 1998 and a high of 87% in 2007. The current reading is near the bottom of a twenty-year range.
Chart 4
This is not to say that foreign stocks are dirt cheap. Non-US equities are fairly priced relative to their own valuation history. (The twenty-year average price/sales ratio is 1.0x.) US stocks, on the other hand, are richly priced versus internal history. (Here, the twenty-year average is 1.5x.) We are simply stating that non-US markets are relatively cheap. And relative value is the key to successful asset allocation.
A Word about Currencies
US investors accept currency risk when they purchase foreign securities. If you buy a Japanese stock, for instance, you must first convert dollars into yen. The dollar/yen exchange rate thus influences your return on investment.
Currencies fluctuate for a variety of reasons, including economic strength and monetary policy. The Bank of Japan is currently conducting a yen-depreciation policy intended to stimulate the Japanese economy and stock market. For US investors to make money, however, Japanese stocks must appreciate more than the yen depreciates.
Currency fluctuations add another layer of risk and reward to global investment strategies.
Putting it All Together
Global equities are currently out of sync. We’ve seen that non-US markets are: 1) extremely cheap relative to the US market; and 2) fairly valued versus their own historic range. Relative strength, however, continues to favor the US. And well-worn trends can last much longer than expected, perhaps due to self-reinforcing processes.
So what’s an investor to do?
Investors should respect both technical and fundamental evidence. While relative strength continues to favor the US, we are alerted by extreme valuation divergences to the possibility of a sea change. Early signs would include a price breakout above the four-year range and a reversal in relative strength. We’d also like to see leadership among non-US banks, indicating that balance-sheet problems in Europe and Japan are no longer presenting severe headwinds.
Given the mixed bag of fundamental and technical evidence, global-minded investors might establish a partial position in non-US stocks with an eye toward increasing the allocation upon signs of strength. An investor wishing to establish a maximum 20% allocation, for example, might start with 5%-10%, adding the rest later as technical conditions warrant.
We expect that the rest of the world will eventually catch up, and even outpace the US market. In a case like this, there should be plenty of upside once a trend reversal is established. When sales, price-to-sales, and foreign exchange rates are all depressed, there is potential for triple rewards once a market economy clicks into gear.
Today’s global market anomalies are creating a world of opportunity for studious investors.


